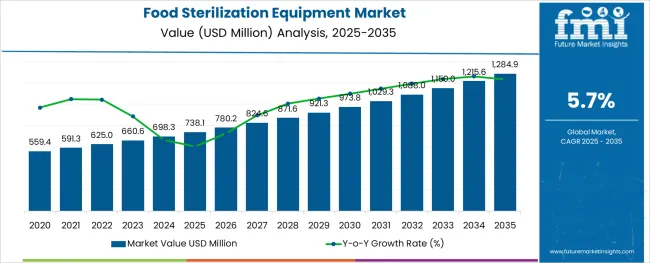
The Global Food Sterilization Equipment market is expected to reach USD 625 Million in 2022, with sales growing at a CAGR of 5.7% over the forecast period. With a favourable demand outlook, the market size will top USD 850 Million by 2032.
Attribute | Details |
---|---|
Food Sterilization Equipment Market Estimated Size in 2022 | USD 625 Million |
Food Sterilization Equipment Market Projected Value in 2032 | USD 850 Million |
Food Sterilization Equipment Market Value-based CAGR (2022 to 2032) | 5.7% CAGR |
Forecast Period | 2022 to 2032 |
Food Sterilization Equipment Market Share of India in South Asia | 31% |
As per FMI, the food sterilization equipment market was valued at USD 580 Million in 2021 and is anticipated to exhibit Y-o-Y growth of 3.2% in 2022.
Moulds and other germs can be found in spices and herbs in restaurants and cloud kitchens, where food sterilization equipment is used. This equipment is used to sterilize a variety of foods, including milk, juices, beer, fish, and meat, among others. Growing concerns regarding food safety, as well as technological advancements to improve the efficiency of this equipment, are expected to drive the market over the forecast period.
Sales of food sterilization equipment are projected to grow at a 5.7% CAGR over the forecast period, in comparison to the 4.1% CAGR registered between 2017 to 2021.
Increasing focus on food safety, along with sustainable production of food ingredients are spurring demand for food sterilization equipment. Food processing companies are investing in sterilizing equipment to extend the shelf life of these items while adhering to severe regulatory standards, which are expected to boost sales in the market in the forthcoming years.
Ongoing technological advancements in the production of non-thermal food preservation technologies will augment the growth in the market. Nonthermal technologies such as ultraviolet light, pulsed electric fields, ultrasound, and high hydrostatic pressure (HPP) are widely adopted.
This equipment maintains the nutrient values of food in a short dispensing time and at lower temperatures and is used to improve food safety and extend the shelf life of food products.
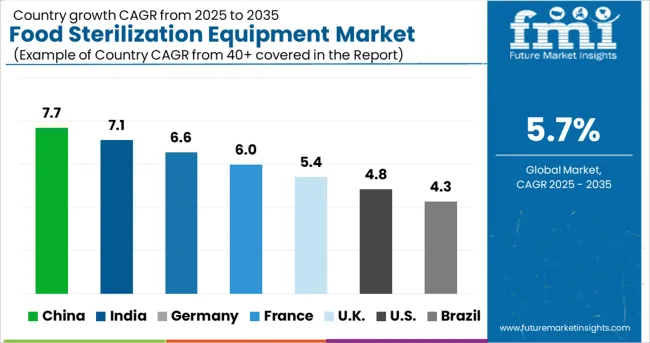
Expansion of the Foodservice Sector in Australia is Driving Sales of Food Sterilization Equipment
Sales in the Australian market are expected to increase at a 6.5% CAGR over the forecast period, accounting for a dominant share of the Oceania food sterilization equipment market. Increasing expenditure on packaged food products and ready-to-eat meals, along with the growing popularity of cloud kitchens and quick service restaurants in the country will continue fueling sales in the market.
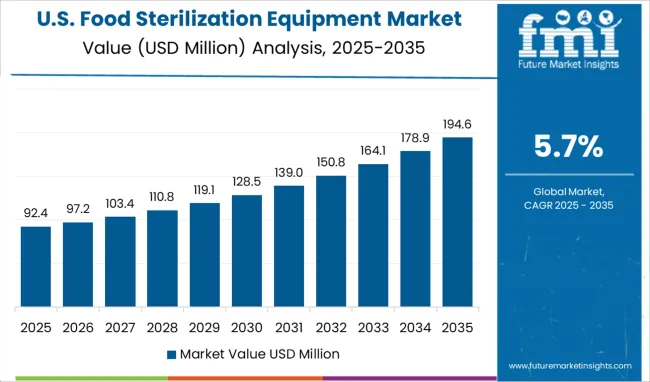
Rapid Adoption of Technologically Advanced Equipment in the Hospitality Sector Will Fuel Sales
According to FMI, demand in the USA market is forecast to increase at a robust 8.2% CAGR, emerging as a lucrative pocket in the North American food sterilization equipment market. Rising preference for online food delivery among consumers, coupled with the presence of stringent food regulatory bodies and restrictions in the country will contribute to the growth in the market over the forecast period.
Growing Preference for Online Food Delivery In India Will Spur Demand
Demand in the Indian market is forecast to grow at a robust 8.2% CAGR, accounting for 31% of the South Asia food sterilization equipment market over the forecast period. The growing establishment of cloud kitchens and fast-food chains in the country, along with increasing government-led initiatives to promote effective sterilization in public and commercial sectors will create prospects for growth for market players.
Stringent Regulations regarding Food Safety Will Propel Sales of Food Sterilization Equipment
China is anticipated to emerge as an attractive market owing to the presence of stringent government laws determining the food safety and quality standards across the food & beverage and food service sector in the country. As per the report, sales in the China market are forecast to grow at a 9.1% CAGR, holding 65% of the East Asia food sterilization equipment market through 2032.
Sales of Continuous Sterilization Equipment in Restaurants Will Gain Traction
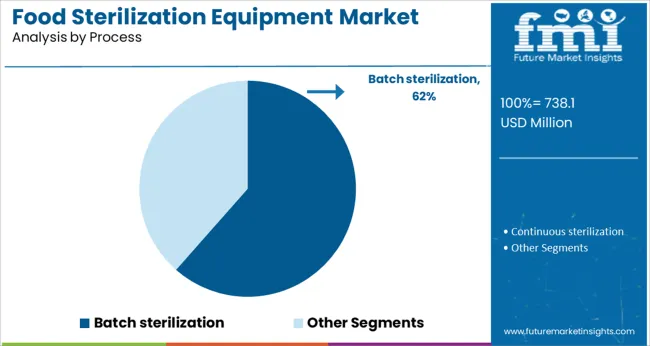
In terms of process, demand in the continuous sterilization equipment segment is poised to increase at a 6.6% CAGR over the forecast period. These equipment employ steam or direct heat for shorter heating and cooling times, reducing sterilization time and cost.
They are also used to sterilize soups, pasta, nutritious drinks, milk, cream, vegetables, newborn formula, mushrooms, meats, liquids, and ready meals. They provide uniformity and improved reproducibility at a reduced cost per unit.
Adoption of Food Sterilization Equipment for Seasoning and Herbs to Remain High
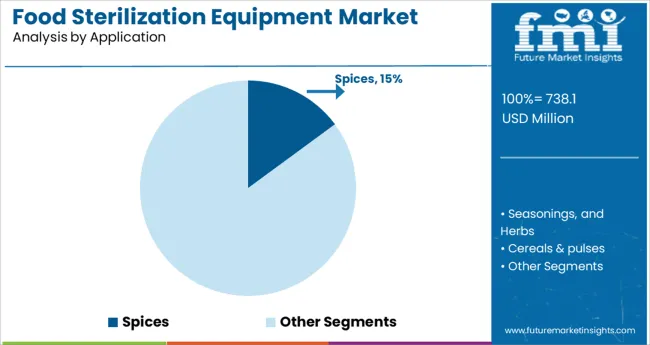
Based on application, sales in the seasoning and herbs segment will continue gaining traction over the forecast period. The need for food sterilizing equipment is high since most food companies utilize spices and herbs as significant elements in their products. Manufacturers are enhancing the sterilization process to deliver high-quality food items including spices, herbs, and seasonings, which in turn is boosting the demand for this equipment.
Increasing Sales of Heat Food Sterilization Equipment Will Augment Growth
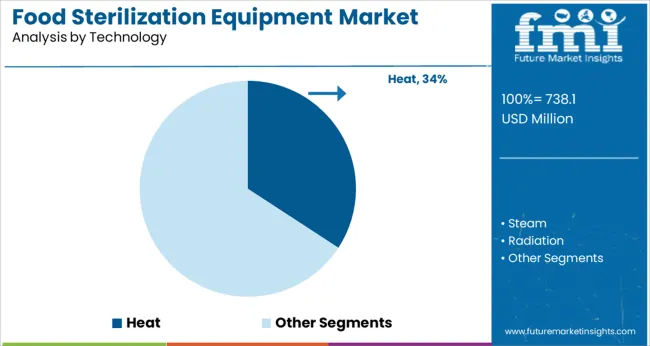
By technology, the heat food sterilization equipment segment will remain lucrative over the assessment period. Because of its ease of use and inexpensive capital commitment, heat sterilization is one of the most extensively used sterilizing procedures.
During the forecast period, the widespread use of heat sterilization technology in the food and beverage processing industry is expected to fuel growth in the market. For a wide range of high-moisture food goods and ingredients, heat sterilization technology is utilized to guarantee long-term shelf stability.
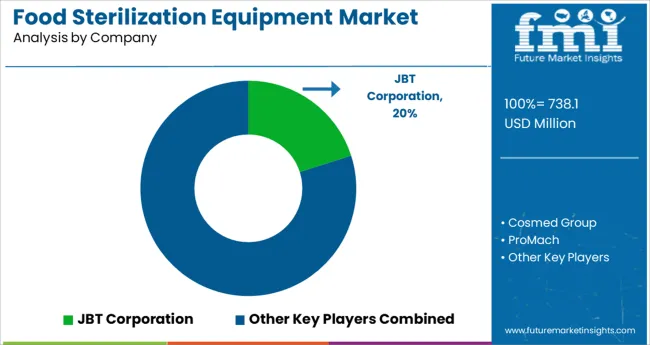
Key players are investing in mergers and acquisitions to expand their production facilities and global footprint. Furthermore, numerous firms are working on new product launches and development to gain a competitive edge in the market.
For instance:
Attribute | Details |
---|---|
Forecast Period | 2022 to 2032 |
Historical Data Available for | 2017 to 2022 |
Market Analysis | USD Million for Value and Units for Volume |
Key Regions Covered | North America; Latin America; Europe; East Asia; South Asia; Oceania; Middle East and Africa (MEA) |
Key Countries Covered | USA, Canada, Mexico, Germany, UK, France, Italy, Spain, China, Japan, India, South Korea, Australia, Brazil, Argentina, South Africa, UAE |
Key Segments Covered | Process, Technology, Type, Equipment, Application, Region |
Key Companies Profiled | JBT; Buhler AG; Cosmed Group; STERIFLOW Company; DELAMA S.P.A.; Raphanel System; Industrial Sonomechanics LLC.; Ventilex; Surdry S.L.; Allpax Products LLC.; HISAKA LTD.; Sun Sterifaab Pvt. Ltd.; 3M; Belimed; Boekel Scientific,; Getinge AB,; LTE Scientific Ltd.; Others |
Report Coverage | Market Forecast, Company Share Analysis, Competitive Landscape, Drivers, Restraints, Opportunities and Threats Analysis, Market Dynamics and Challenges, and Strategic Growth Initiatives |
Customization & Pricing | Available upon Request |
Table 01: Global Value (US$ Million) Forecast by Region, 2017 to 2032
Table 02: Global Volume (Units) Forecast by Region, 2017 to 2032
Table 03: Global Value (US$ Million) Forecast by Application, 2017 to 2032
Table 04: Global Volume (Units) Forecast by Application, 2017 to 2032
Table 05: Global Value (US$ Million) Forecast by Technology, 2017 to 2032
Table 06: Global Volume (Units) Forecast by Technology, 2017 to 2032
Table 07: Global Value (US$ Million) Forecast by Process, 2017 to 2032
Table 08: Global Volume (Units) Forecast by Process, 2017 to 2032
Table 09: Global Value (US$ Million) Forecast by Type, 2017 to 2032
Table 10: Global Volume (Units) Forecast by Type, 2017 to 2032
Table 11: Global Value (US$ Million) Forecast by Equipment, 2017 to 2032
Table 12: Global Volume (Units) Forecast by Equipment, 2017 to 2032
Table 13: North America Value (US$ Million) Forecast by Country, 2017 to 2032
Table 14: North America Volume (Units) Forecast by Country, 2017 to 2032
Table 15: North America Value (US$ Million) Forecast by Application, 2017 to 2032
Table 16: North America Volume (Units) Forecast by Application, 2017 to 2032
Table 17: North America Value (US$ Million) Forecast by Technology, 2017 to 2032
Table 18: North America Volume (Units) Forecast by Technology, 2017 to 2032
Table 19: North America Value (US$ Million) Forecast by Process, 2017 to 2032
Table 20: North America Volume (Units) Forecast by Process, 2017 to 2032
Table 21: North America Value (US$ Million) Forecast by Type, 2017 to 2032
Table 22: North America Volume (Units) Forecast by Type, 2017 to 2032
Table 23: North America Value (US$ Million) Forecast by Equipment, 2017 to 2032
Table 24: North America Volume (Units) Forecast by Equipment, 2017 to 2032
Table 25: Latin America Value (US$ Million) Forecast by Country, 2017 to 2032
Table 26: Latin America Volume (Units) Forecast by Country, 2017 to 2032
Table 27: Latin America Value (US$ Million) Forecast by Application, 2017 to 2032
Table 28: Latin America Volume (Units) Forecast by Application, 2017 to 2032
Table 29: Latin America Value (US$ Million) Forecast by Technology, 2017 to 2032
Table 30: Latin America Volume (Units) Forecast by Technology, 2017 to 2032
Table 31: Latin America Value (US$ Million) Forecast by Process, 2017 to 2032
Table 32: Latin America Volume (Units) Forecast by Process, 2017 to 2032
Table 33: Latin America Value (US$ Million) Forecast by Type, 2017 to 2032
Table 34: Latin America Volume (Units) Forecast by Type, 2017 to 2032
Table 35: Latin America Value (US$ Million) Forecast by Equipment, 2017 to 2032
Table 36: Latin America Volume (Units) Forecast by Equipment, 2017 to 2032
Table 37: Europe Value (US$ Million) Forecast by Country, 2017 to 2032
Table 38: Europe Volume (Units) Forecast by Country, 2017 to 2032
Table 39: Europe Value (US$ Million) Forecast by Application, 2017 to 2032
Table 40: Europe Volume (Units) Forecast by Application, 2017 to 2032
Table 41: Europe Value (US$ Million) Forecast by Technology, 2017 to 2032
Table 42: Europe Volume (Units) Forecast by Technology, 2017 to 2032
Table 43: Europe Value (US$ Million) Forecast by Process, 2017 to 2032
Table 44: Europe Volume (Units) Forecast by Process, 2017 to 2032
Table 45: Europe Value (US$ Million) Forecast by Type, 2017 to 2032
Table 46: Europe Volume (Units) Forecast by Type, 2017 to 2032
Table 47: Europe Value (US$ Million) Forecast by Equipment, 2017 to 2032
Table 48: Europe Volume (Units) Forecast by Equipment, 2017 to 2032
Table 49: East Asia Value (US$ Million) Forecast by Country, 2017 to 2032
Table 50: East Asia Volume (Units) Forecast by Country, 2017 to 2032
Table 51: East Asia Value (US$ Million) Forecast by Application, 2017 to 2032
Table 52: East Asia Volume (Units) Forecast by Application, 2017 to 2032
Table 53: East Asia Value (US$ Million) Forecast by Technology, 2017 to 2032
Table 54: East Asia Volume (Units) Forecast by Technology, 2017 to 2032
Table 55: East Asia Value (US$ Million) Forecast by Process, 2017 to 2032
Table 56: East Asia Volume (Units) Forecast by Process, 2017 to 2032
Table 57: East Asia Value (US$ Million) Forecast by Type, 2017 to 2032
Table 58: East Asia Volume (Units) Forecast by Type, 2017 to 2032
Table 59: East Asia Value (US$ Million) Forecast by Equipment, 2017 to 2032
Table 60: East Asia Volume (Units) Forecast by Equipment, 2017 to 2032
Table 61: South Asia Value (US$ Million) Forecast by Country, 2017 to 2032
Table 62: South Asia Volume (Units) Forecast by Country, 2017 to 2032
Table 63: South Asia Value (US$ Million) Forecast by Application, 2017 to 2032
Table 64: South Asia Volume (Units) Forecast by Application, 2017 to 2032
Table 65: South Asia Value (US$ Million) Forecast by Technology, 2017 to 2032
Table 66: South Asia Volume (Units) Forecast by Technology, 2017 to 2032
Table 67: South Asia Value (US$ Million) Forecast by Process, 2017 to 2032
Table 68: South Asia Volume (Units) Forecast by Process, 2017 to 2032
Table 69: South Asia Value (US$ Million) Forecast by Type, 2017 to 2032
Table 70: South Asia Volume (Units) Forecast by Type, 2017 to 2032
Table 71: South Asia Value (US$ Million) Forecast by Equipment, 2017 to 2032
Table 72: South Asia Volume (Units) Forecast by Equipment, 2017 to 2032
Table 73: Oceania Value (US$ Million) Forecast by Country, 2017 to 2032
Table 74: Oceania Volume (Units) Forecast by Country, 2017 to 2032
Table 75: Oceania Value (US$ Million) Forecast by Application, 2017 to 2032
Table 76: Oceania Volume (Units) Forecast by Application, 2017 to 2032
Table 77: Oceania Value (US$ Million) Forecast by Technology, 2017 to 2032
Table 78: Oceania Volume (Units) Forecast by Technology, 2017 to 2032
Table 79: Oceania Value (US$ Million) Forecast by Process, 2017 to 2032
Table 80: Oceania Volume (Units) Forecast by Process, 2017 to 2032
Table 81: Oceania Value (US$ Million) Forecast by Type, 2017 to 2032
Table 82: Oceania Volume (Units) Forecast by Type, 2017 to 2032
Table 83: Oceania Value (US$ Million) Forecast by Equipment, 2017 to 2032
Table 84: Oceania Volume (Units) Forecast by Equipment, 2017 to 2032
Table 85: MEA Value (US$ Million) Forecast by Country, 2017 to 2032
Table 86: MEA Volume (Units) Forecast by Country, 2017 to 2032
Table 87: MEA Value (US$ Million) Forecast by Application, 2017 to 2032
Table 88: MEA Volume (Units) Forecast by Application, 2017 to 2032
Table 89: MEA Value (US$ Million) Forecast by Technology, 2017 to 2032
Table 90: MEA Volume (Units) Forecast by Technology, 2017 to 2032
Table 91: MEA Value (US$ Million) Forecast by Process, 2017 to 2032
Table 92: MEA Volume (Units) Forecast by Process, 2017 to 2032
Table 93: MEA Value (US$ Million) Forecast by Type, 2017 to 2032
Table 94: MEA Volume (Units) Forecast by Type, 2017 to 2032
Table 95: MEA Value (US$ Million) Forecast by Equipment, 2017 to 2032
Table 96: MEA Volume (Units) Forecast by Equipment, 2017 to 2032
Figure 01: Global Value (US$ Million) by Application, 2022 to 2032
Figure 02: Global Value (US$ Million) by Technology, 2022 to 2032
Figure 03: Global Value (US$ Million) by Process, 2022 to 2032
Figure 04: Global Value (US$ Million) by Type, 2022 to 2032
Figure 05: Global Value (US$ Million) by Equipment, 2022 to 2032
Figure 06: Global Value (US$ Million) by Region, 2022 to 2032
Figure 07: Global Value (US$ Million) Analysis by Region, 2017 to 2032
Figure 08: Global Volume (Units) Analysis by Region, 2017 to 2032
Figure 09: Global Value Share (%) and BPS Analysis by Region, 2022 to 2032
Figure 10: Global Y-o-Y Growth (%) Projections by Region, 2022 to 2032
Figure 11: Global Value (US$ Million) Analysis by Application, 2017 to 2032
Figure 12: Global Volume (Units) Analysis by Application, 2017 to 2032
Figure 13: Global Value Share (%) and BPS Analysis by Application, 2022 to 2032
Figure 14: Global Y-o-Y Growth (%) Projections by Application, 2022 to 2032
Figure 15: Global Value (US$ Million) Analysis by Technology, 2017 to 2032
Figure 16: Global Volume (Units) Analysis by Technology, 2017 to 2032
Figure 17: Global Value Share (%) and BPS Analysis by Technology, 2022 to 2032
Figure 18: Global Y-o-Y Growth (%) Projections by Technology, 2022 to 2032
Figure 19: Global Value (US$ Million) Analysis by Process, 2017 to 2032
Figure 20: Global Volume (Units) Analysis by Process, 2017 to 2032
Figure 21: Global Value Share (%) and BPS Analysis by Process, 2022 to 2032
Figure 22: Global Y-o-Y Growth (%) Projections by Process, 2022 to 2032
Figure 23: Global Value (US$ Million) Analysis by Type, 2017 to 2032
Figure 24: Global Volume (Units) Analysis by Type, 2017 to 2032
Figure 25: Global Value Share (%) and BPS Analysis by Type, 2022 to 2032
Figure 26: Global Y-o-Y Growth (%) Projections by Type, 2022 to 2032
Figure 27: Global Value (US$ Million) Analysis by Equipment, 2017 to 2032
Figure 28: Global Volume (Units) Analysis by Equipment, 2017 to 2032
Figure 29: Global Value Share (%) and BPS Analysis by Equipment, 2022 to 2032
Figure 30: Global Y-o-Y Growth (%) Projections by Equipment, 2022 to 2032
Figure 31: Global Attractiveness by Application, 2022 to 2032
Figure 32: Global Attractiveness by Technology, 2022 to 2032
Figure 33: Global Attractiveness by Process, 2022 to 2032
Figure 34: Global Attractiveness by Type, 2022 to 2032
Figure 35: Global Attractiveness by Equipment, 2022 to 2032
Figure 36: Global Attractiveness by Region, 2022 to 2032
Figure 37: North America Value (US$ Million) by Application, 2022 to 2032
Figure 38: North America Value (US$ Million) by Technology, 2022 to 2032
Figure 39: North America Value (US$ Million) by Process, 2022 to 2032
Figure 40: North America Value (US$ Million) by Type, 2022 to 2032
Figure 41: North America Value (US$ Million) by Equipment, 2022 to 2032
Figure 42: North America Value (US$ Million) by Country, 2022 to 2032
Figure 43: North America Value (US$ Million) Analysis by Country, 2017 to 2032
Figure 44: North America Volume (Units) Analysis by Country, 2017 to 2032
Figure 45: North America Value Share (%) and BPS Analysis by Country, 2022 to 2032
Figure 46: North America Y-o-Y Growth (%) Projections by Country, 2022 to 2032
Figure 47: North America Value (US$ Million) Analysis by Application, 2017 to 2032
Figure 48: North America Volume (Units) Analysis by Application, 2017 to 2032
Figure 49: North America Value Share (%) and BPS Analysis by Application, 2022 to 2032
Figure 50: North America Y-o-Y Growth (%) Projections by Application, 2022 to 2032
Figure 51: North America Value (US$ Million) Analysis by Technology, 2017 to 2032
Figure 52: North America Volume (Units) Analysis by Technology, 2017 to 2032
Figure 53: North America Value Share (%) and BPS Analysis by Technology, 2022 to 2032
Figure 54: North America Y-o-Y Growth (%) Projections by Technology, 2022 to 2032
Figure 55: North America Value (US$ Million) Analysis by Process, 2017 to 2032
Figure 56: North America Volume (Units) Analysis by Process, 2017 to 2032
Figure 57: North America Value Share (%) and BPS Analysis by Process, 2022 to 2032
Figure 58: North America Y-o-Y Growth (%) Projections by Process, 2022 to 2032
Figure 59: North America Value (US$ Million) Analysis by Type, 2017 to 2032
Figure 60: North America Volume (Units) Analysis by Type, 2017 to 2032
Figure 61: North America Value Share (%) and BPS Analysis by Type, 2022 to 2032
Figure 62: North America Y-o-Y Growth (%) Projections by Type, 2022 to 2032
Figure 63: North America Value (US$ Million) Analysis by Equipment, 2017 to 2032
Figure 64: North America Volume (Units) Analysis by Equipment, 2017 to 2032
Figure 65: North America Value Share (%) and BPS Analysis by Equipment, 2022 to 2032
Figure 66: North America Y-o-Y Growth (%) Projections by Equipment, 2022 to 2032
Figure 67: North America Attractiveness by Application, 2022 to 2032
Figure 68: North America Attractiveness by Technology, 2022 to 2032
Figure 69: North America Attractiveness by Process, 2022 to 2032
Figure 70: North America Attractiveness by Type, 2022 to 2032
Figure 71: North America Attractiveness by Equipment, 2022 to 2032
Figure 72: North America Attractiveness by Country, 2022 to 2032
Figure 73: Latin America Value (US$ Million) by Application, 2022 to 2032
Figure 74: Latin America Value (US$ Million) by Technology, 2022 to 2032
Figure 75: Latin America Value (US$ Million) by Process, 2022 to 2032
Figure 76: Latin America Value (US$ Million) by Type, 2022 to 2032
Figure 77: Latin America Value (US$ Million) by Equipment, 2022 to 2032
Figure 78: Latin America Value (US$ Million) by Country, 2022 to 2032
Figure 79: Latin America Value (US$ Million) Analysis by Country, 2017 to 2032
Figure 80: Latin America Volume (Units) Analysis by Country, 2017 to 2032
Figure 81: Latin America Value Share (%) and BPS Analysis by Country, 2022 to 2032
Figure 82: Latin America Y-o-Y Growth (%) Projections by Country, 2022 to 2032
Figure 83: Latin America Value (US$ Million) Analysis by Application, 2017 to 2032
Figure 84: Latin America Volume (Units) Analysis by Application, 2017 to 2032
Figure 85: Latin America Value Share (%) and BPS Analysis by Application, 2022 to 2032
Figure 86: Latin America Y-o-Y Growth (%) Projections by Application, 2022 to 2032
Figure 87: Latin America Value (US$ Million) Analysis by Technology, 2017 to 2032
Figure 88: Latin America Volume (Units) Analysis by Technology, 2017 to 2032
Figure 89: Latin America Value Share (%) and BPS Analysis by Technology, 2022 to 2032
Figure 90: Latin America Y-o-Y Growth (%) Projections by Technology, 2022 to 2032
Figure 91: Latin America Value (US$ Million) Analysis by Process, 2017 to 2032
Figure 92: Latin America Volume (Units) Analysis by Process, 2017 to 2032
Figure 93: Latin America Value Share (%) and BPS Analysis by Process, 2022 to 2032
Figure 94: Latin America Y-o-Y Growth (%) Projections by Process, 2022 to 2032
Figure 95: Latin America Value (US$ Million) Analysis by Type, 2017 to 2032
Figure 96: Latin America Volume (Units) Analysis by Type, 2017 to 2032
Figure 97: Latin America Value Share (%) and BPS Analysis by Type, 2022 to 2032
Figure 98: Latin America Y-o-Y Growth (%) Projections by Type, 2022 to 2032
Figure 99: Latin America Value (US$ Million) Analysis by Equipment, 2017 to 2032
Figure 100: Latin America Volume (Units) Analysis by Equipment, 2017 to 2032
Figure 101: Latin America Value Share (%) and BPS Analysis by Equipment, 2022 to 2032
Figure 102: Latin America Y-o-Y Growth (%) Projections by Equipment, 2022 to 2032
Figure 103: Latin America Attractiveness by Application, 2022 to 2032
Figure 104: Latin America Attractiveness by Technology, 2022 to 2032
Figure 105: Latin America Attractiveness by Process, 2022 to 2032
Figure 106: Latin America Attractiveness by Type, 2022 to 2032
Figure 107: Latin America Attractiveness by Equipment, 2022 to 2032
Figure 108: Latin America Attractiveness by Country, 2022 to 2032
Figure 109: Europe Value (US$ Million) by Application, 2022 to 2032
Figure 110: Europe Value (US$ Million) by Technology, 2022 to 2032
Figure 111: Europe Value (US$ Million) by Process, 2022 to 2032
Figure 112: Europe Value (US$ Million) by Type, 2022 to 2032
Figure 113: Europe Value (US$ Million) by Equipment, 2022 to 2032
Figure 114: Europe Value (US$ Million) by Country, 2022 to 2032
Figure 115: Europe Value (US$ Million) Analysis by Country, 2017 to 2032
Figure 116: Europe Volume (Units) Analysis by Country, 2017 to 2032
Figure 117: Europe Value Share (%) and BPS Analysis by Country, 2022 to 2032
Figure 118: Europe Y-o-Y Growth (%) Projections by Country, 2022 to 2032
Figure 119: Europe Value (US$ Million) Analysis by Application, 2017 to 2032
Figure 120: Europe Volume (Units) Analysis by Application, 2017 to 2032
Figure 121: Europe Value Share (%) and BPS Analysis by Application, 2022 to 2032
Figure 122: Europe Y-o-Y Growth (%) Projections by Application, 2022 to 2032
Figure 123: Europe Value (US$ Million) Analysis by Technology, 2017 to 2032
Figure 124: Europe Volume (Units) Analysis by Technology, 2017 to 2032
Figure 125: Europe Value Share (%) and BPS Analysis by Technology, 2022 to 2032
Figure 126: Europe Y-o-Y Growth (%) Projections by Technology, 2022 to 2032
Figure 127: Europe Value (US$ Million) Analysis by Process, 2017 to 2032
Figure 128: Europe Volume (Units) Analysis by Process, 2017 to 2032
Figure 129: Europe Value Share (%) and BPS Analysis by Process, 2022 to 2032
Figure 130: Europe Y-o-Y Growth (%) Projections by Process, 2022 to 2032
Figure 131: Europe Value (US$ Million) Analysis by Type, 2017 to 2032
Figure 132: Europe Volume (Units) Analysis by Type, 2017 to 2032
Figure 133: Europe Value Share (%) and BPS Analysis by Type, 2022 to 2032
Figure 134: Europe Y-o-Y Growth (%) Projections by Type, 2022 to 2032
Figure 135: Europe Value (US$ Million) Analysis by Equipment, 2017 to 2032
Figure 136: Europe Volume (Units) Analysis by Equipment, 2017 to 2032
Figure 137: Europe Value Share (%) and BPS Analysis by Equipment, 2022 to 2032
Figure 138: Europe Y-o-Y Growth (%) Projections by Equipment, 2022 to 2032
Figure 139: Europe Attractiveness by Application, 2022 to 2032
Figure 140: Europe Attractiveness by Technology, 2022 to 2032
Figure 141: Europe Attractiveness by Process, 2022 to 2032
Figure 142: Europe Attractiveness by Type, 2022 to 2032
Figure 143: Europe Attractiveness by Equipment, 2022 to 2032
Figure 144: Europe Attractiveness by Country, 2022 to 2032
Figure 145: East Asia Value (US$ Million) by Application, 2022 to 2032
Figure 146: East Asia Value (US$ Million) by Technology, 2022 to 2032
Figure 147: East Asia Value (US$ Million) by Process, 2022 to 2032
Figure 148: East Asia Value (US$ Million) by Type, 2022 to 2032
Figure 149: East Asia Value (US$ Million) by Equipment, 2022 to 2032
Figure 150: East Asia Value (US$ Million) by Country, 2022 to 2032
Figure 151: East Asia Value (US$ Million) Analysis by Country, 2017 to 2032
Figure 152: East Asia Volume (Units) Analysis by Country, 2017 to 2032
Figure 153: East Asia Value Share (%) and BPS Analysis by Country, 2022 to 2032
Figure 154: East Asia Y-o-Y Growth (%) Projections by Country, 2022 to 2032
Figure 155: East Asia Value (US$ Million) Analysis by Application, 2017 to 2032
Figure 156: East Asia Volume (Units) Analysis by Application, 2017 to 2032
Figure 157: East Asia Value Share (%) and BPS Analysis by Application, 2022 to 2032
Figure 158: East Asia Y-o-Y Growth (%) Projections by Application, 2022 to 2032
Figure 159: East Asia Value (US$ Million) Analysis by Technology, 2017 to 2032
Figure 160: East Asia Volume (Units) Analysis by Technology, 2017 to 2032
Figure 161: East Asia Value Share (%) and BPS Analysis by Technology, 2022 to 2032
Figure 162: East Asia Y-o-Y Growth (%) Projections by Technology, 2022 to 2032
Figure 163: East Asia Value (US$ Million) Analysis by Process, 2017 to 2032
Figure 164: East Asia Volume (Units) Analysis by Process, 2017 to 2032
Figure 165: East Asia Value Share (%) and BPS Analysis by Process, 2022 to 2032
Figure 166: East Asia Y-o-Y Growth (%) Projections by Process, 2022 to 2032
Figure 167: East Asia Value (US$ Million) Analysis by Type, 2017 to 2032
Figure 168: East Asia Volume (Units) Analysis by Type, 2017 to 2032
Figure 169: East Asia Value Share (%) and BPS Analysis by Type, 2022 to 2032
Figure 170: East Asia Y-o-Y Growth (%) Projections by Type, 2022 to 2032
Figure 171: East Asia Value (US$ Million) Analysis by Equipment, 2017 to 2032
Figure 172: East Asia Volume (Units) Analysis by Equipment, 2017 to 2032
Figure 173: East Asia Value Share (%) and BPS Analysis by Equipment, 2022 to 2032
Figure 174: East Asia Y-o-Y Growth (%) Projections by Equipment, 2022 to 2032
Figure 175: East Asia Attractiveness by Application, 2022 to 2032
Figure 176: East Asia Attractiveness by Technology, 2022 to 2032
Figure 177: East Asia Attractiveness by Process, 2022 to 2032
Figure 178: East Asia Attractiveness by Type, 2022 to 2032
Figure 179: East Asia Attractiveness by Equipment, 2022 to 2032
Figure 180: East Asia Attractiveness by Country, 2022 to 2032
Figure 181: South Asia Value (US$ Million) by Application, 2022 to 2032
Figure 182: South Asia Value (US$ Million) by Technology, 2022 to 2032
Figure 183: South Asia Value (US$ Million) by Process, 2022 to 2032
Figure 184: South Asia Value (US$ Million) by Type, 2022 to 2032
Figure 185: South Asia Value (US$ Million) by Equipment, 2022 to 2032
Figure 186: South Asia Value (US$ Million) by Country, 2022 to 2032
Figure 187: South Asia Value (US$ Million) Analysis by Country, 2017 to 2032
Figure 188: South Asia Volume (Units) Analysis by Country, 2017 to 2032
Figure 189: South Asia Value Share (%) and BPS Analysis by Country, 2022 to 2032
Figure 190: South Asia Y-o-Y Growth (%) Projections by Country, 2022 to 2032
Figure 191: South Asia Value (US$ Million) Analysis by Application, 2017 to 2032
Figure 192: South Asia Volume (Units) Analysis by Application, 2017 to 2032
Figure 193: South Asia Value Share (%) and BPS Analysis by Application, 2022 to 2032
Figure 194: South Asia Y-o-Y Growth (%) Projections by Application, 2022 to 2032
Figure 195: South Asia Value (US$ Million) Analysis by Technology, 2017 to 2032
Figure 196: South Asia Volume (Units) Analysis by Technology, 2017 to 2032
Figure 197: South Asia Value Share (%) and BPS Analysis by Technology, 2022 to 2032
Figure 198: South Asia Y-o-Y Growth (%) Projections by Technology, 2022 to 2032
Figure 199: South Asia Value (US$ Million) Analysis by Process, 2017 to 2032
Figure 200: South Asia Volume (Units) Analysis by Process, 2017 to 2032
Figure 201: South Asia Value Share (%) and BPS Analysis by Process, 2022 to 2032
Figure 202: South Asia Y-o-Y Growth (%) Projections by Process, 2022 to 2032
Figure 203: South Asia Value (US$ Million) Analysis by Type, 2017 to 2032
Figure 204: South Asia Volume (Units) Analysis by Type, 2017 to 2032
Figure 205: South Asia Value Share (%) and BPS Analysis by Type, 2022 to 2032
Figure 206: South Asia Y-o-Y Growth (%) Projections by Type, 2022 to 2032
Figure 207: South Asia Value (US$ Million) Analysis by Equipment, 2017 to 2032
Figure 208: South Asia Volume (Units) Analysis by Equipment, 2017 to 2032
Figure 209: South Asia Value Share (%) and BPS Analysis by Equipment, 2022 to 2032
Figure 210: South Asia Y-o-Y Growth (%) Projections by Equipment, 2022 to 2032
Figure 211: South Asia Attractiveness by Application, 2022 to 2032
Figure 212: South Asia Attractiveness by Technology, 2022 to 2032
Figure 213: South Asia Attractiveness by Process, 2022 to 2032
Figure 214: South Asia Attractiveness by Type, 2022 to 2032
Figure 215: South Asia Attractiveness by Equipment, 2022 to 2032
Figure 216: South Asia Attractiveness by Country, 2022 to 2032
Figure 217: Oceania Value (US$ Million) by Application, 2022 to 2032
Figure 218: Oceania Value (US$ Million) by Technology, 2022 to 2032
Figure 219: Oceania Value (US$ Million) by Process, 2022 to 2032
Figure 220: Oceania Value (US$ Million) by Type, 2022 to 2032
Figure 221: Oceania Value (US$ Million) by Equipment, 2022 to 2032
Figure 222: Oceania Value (US$ Million) by Country, 2022 to 2032
Figure 223: Oceania Value (US$ Million) Analysis by Country, 2017 to 2032
Figure 224: Oceania Volume (Units) Analysis by Country, 2017 to 2032
Figure 225: Oceania Value Share (%) and BPS Analysis by Country, 2022 to 2032
Figure 226: Oceania Y-o-Y Growth (%) Projections by Country, 2022 to 2032
Figure 227: Oceania Value (US$ Million) Analysis by Application, 2017 to 2032
Figure 228: Oceania Volume (Units) Analysis by Application, 2017 to 2032
Figure 229: Oceania Value Share (%) and BPS Analysis by Application, 2022 to 2032
Figure 230: Oceania Y-o-Y Growth (%) Projections by Application, 2022 to 2032
Figure 231: Oceania Value (US$ Million) Analysis by Technology, 2017 to 2032
Figure 232: Oceania Volume (Units) Analysis by Technology, 2017 to 2032
Figure 233: Oceania Value Share (%) and BPS Analysis by Technology, 2022 to 2032
Figure 234: Oceania Y-o-Y Growth (%) Projections by Technology, 2022 to 2032
Figure 235: Oceania Value (US$ Million) Analysis by Process, 2017 to 2032
Figure 236: Oceania Volume (Units) Analysis by Process, 2017 to 2032
Figure 237: Oceania Value Share (%) and BPS Analysis by Process, 2022 to 2032
Figure 238: Oceania Y-o-Y Growth (%) Projections by Process, 2022 to 2032
Figure 239: Oceania Value (US$ Million) Analysis by Type, 2017 to 2032
Figure 240: Oceania Volume (Units) Analysis by Type, 2017 to 2032
Figure 241: Oceania Value Share (%) and BPS Analysis by Type, 2022 to 2032
Figure 242: Oceania Y-o-Y Growth (%) Projections by Type, 2022 to 2032
Figure 243: Oceania Value (US$ Million) Analysis by Equipment, 2017 to 2032
Figure 244: Oceania Volume (Units) Analysis by Equipment, 2017 to 2032
Figure 245: Oceania Value Share (%) and BPS Analysis by Equipment, 2022 to 2032
Figure 246: Oceania Y-o-Y Growth (%) Projections by Equipment, 2022 to 2032
Figure 247: Oceania Attractiveness by Application, 2022 to 2032
Figure 248: Oceania Attractiveness by Technology, 2022 to 2032
Figure 249: Oceania Attractiveness by Process, 2022 to 2032
Figure 250: Oceania Attractiveness by Type, 2022 to 2032
Figure 251: Oceania Attractiveness by Equipment, 2022 to 2032
Figure 252: Oceania Attractiveness by Country, 2022 to 2032
Figure 253: MEA Value (US$ Million) by Application, 2022 to 2032
Figure 254: MEA Value (US$ Million) by Technology, 2022 to 2032
Figure 255: MEA Value (US$ Million) by Process, 2022 to 2032
Figure 256: MEA Value (US$ Million) by Type, 2022 to 2032
Figure 257: MEA Value (US$ Million) by Equipment, 2022 to 2032
Figure 258: MEA Value (US$ Million) by Country, 2022 to 2032
Figure 259: MEA Value (US$ Million) Analysis by Country, 2017 to 2032
Figure 260: MEA Volume (Units) Analysis by Country, 2017 to 2032
Figure 261: MEA Value Share (%) and BPS Analysis by Country, 2022 to 2032
Figure 262: MEA Y-o-Y Growth (%) Projections by Country, 2022 to 2032
Figure 263: MEA Value (US$ Million) Analysis by Application, 2017 to 2032
Figure 264: MEA Volume (Units) Analysis by Application, 2017 to 2032
Figure 265: MEA Value Share (%) and BPS Analysis by Application, 2022 to 2032
Figure 266: MEA Y-o-Y Growth (%) Projections by Application, 2022 to 2032
Figure 267: MEA Value (US$ Million) Analysis by Technology, 2017 to 2032
Figure 268: MEA Volume (Units) Analysis by Technology, 2017 to 2032
Figure 269: MEA Value Share (%) and BPS Analysis by Technology, 2022 to 2032
Figure 270: MEA Y-o-Y Growth (%) Projections by Technology, 2022 to 2032
Figure 271: MEA Value (US$ Million) Analysis by Process, 2017 to 2032
Figure 272: MEA Volume (Units) Analysis by Process, 2017 to 2032
Figure 273: MEA Value Share (%) and BPS Analysis by Process, 2022 to 2032
Figure 274: MEA Y-o-Y Growth (%) Projections by Process, 2022 to 2032
Figure 275: MEA Value (US$ Million) Analysis by Type, 2017 to 2032
Figure 276: MEA Volume (Units) Analysis by Type, 2017 to 2032
Figure 277: MEA Value Share (%) and BPS Analysis by Type, 2022 to 2032
Figure 278: MEA Y-o-Y Growth (%) Projections by Type, 2022 to 2032
Figure 279: MEA Value (US$ Million) Analysis by Equipment, 2017 to 2032
Figure 280: MEA Volume (Units) Analysis by Equipment, 2017 to 2032
Figure 281: MEA Value Share (%) and BPS Analysis by Equipment, 2022 to 2032
Figure 282: MEA Y-o-Y Growth (%) Projections by Equipment, 2022 to 2032
Figure 283: MEA Attractiveness by Application, 2022 to 2032
Figure 284: MEA Attractiveness by Technology, 2022 to 2032
Figure 285: MEA Attractiveness by Process, 2022 to 2032
Figure 286: MEA Attractiveness by Type, 2022 to 2032
Figure 287: MEA Attractiveness by Equipment, 2022 to 2032
Figure 288: MEA Attractiveness by Country, 2022 to 2032
The food sterilization equipment market is projected to reach USD 625 Million in 2022.
The food sterilization equipment market is expected to rise at a CAGR of 5.7%.
JBT, Buhler AG, Cosmed Group, STERIFLOW Company, and DELAMA S.P.A., are the top players driving the market.
The North America food sterilization equipment market is expected to register a 7.3% CAGR between 2022 and 2032.
The demand for food sterilization equipment in Europe is expected to grow at a 5% CAGR through 2032.
China, the USA, Germany, Japan, and Canada are the major countries driving demand for food sterilization equipment.
Explore Similar Insights
Thank you!
You will receive an email from our Business Development Manager. Please be sure to check your SPAM/JUNK folder too.