Food Grade Solvent Market Size and Share Forecast Outlook 2025 to 2035

The Food Grade Solvent Market is expected to record a valuation of USD 8,945.2 million in 2025, reaching USD 13,830.6 million by 2035, reflecting a 4.5% CAGR over the decade. Growth during the first half of the forecast period (2025-2030) will be supported by the rising adoption of ethanol-based formulations, which remain integral to food processing, flavor extraction, and beverage applications. During this phase, the market is projected to gain nearly USD 2,022 million, underpinned by increased consumption in North America and steady expansion across Europe.
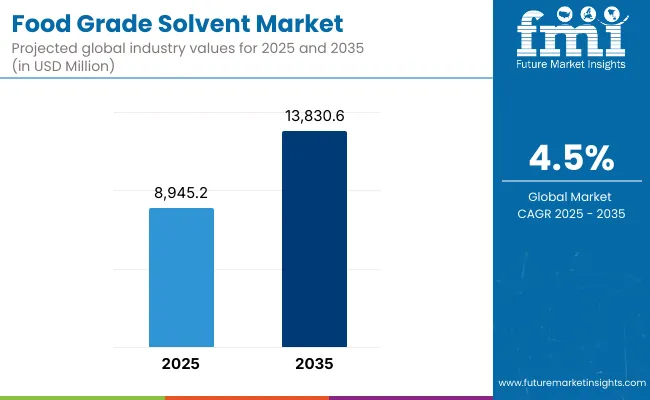
Quick Stats for Food Grade Solvent Market

  • Market Value (2025): USD 8,945.2 Million
  • Market Forecast Value (2035): USD 13,830.6 Million
  • Market Forecast CAGR (2025 to 2035): 4.5%
  • Leading Segment in 2025: Ethanol (42.0% share, USD 3,757.0 Million)
  • Key Growth Regions: South Asia & Pacific, East Asia, North America
  • Top Key Players: BASF SE, Dow Inc., ExxonMobil Chemical, LyondellBasell Industries, Eastman Chemical Company, Solvay SA, Mitsui Chemicals, Reliance Industries, Sasol, Ashland Global

Food Grade Solvent Market

Food Grade Solvent Market Key Takeaways

Metric Value
Market Estimated Value In (2025 E ) USD 8,945.2 Million
Market Forecast Value In (2035f) USD 13,830.6 Million
Forecast CAGR (2025 to 2035) 4.5%

From 2030 to 2035, the pace of growth will accelerate in Asia-Pacific, where solvent usage in bakery, dairy, and processed foods is expanding in response to consumer demand for convenience products. This period will add approximately USD 2,863 million to the market, reflecting the role of industrial modernization in South Asia and East Asia. Strong policy encouragement for clean-label and bio-based inputs will reinforce the shift toward natural solvents, which are forecast to grow at 6.1% CAGR, significantly outpacing synthetics at 3.9% CAGR.

Regional momentum will be most pronounced in China and India, which are expected to record CAGRs of 6.5% and 7.2% respectively, supported by rapid urbanization and modernization of food supply chains. While the United States retains leadership, its share is forecast to fall from 18% in 2025 to 16% by 2035, reflecting faster expansion in Asia-Pacific.

From 2020 to 2024, the Food Grade Solvent Market expanded steadily, driven by the rising need for safe and high-purity processing solutions. In 2025, the market is valued at USD 8,945.2 Million, supported by ethanol’s leadership across beverages and bakery applications. By 2035, it is forecasted to reach USD 13,830.6 Million, with growth momentum shifting toward natural/bio-based solvents, reflecting sustainability commitments and consumer demand for clean-label products. Competitive advantage is expected to evolve beyond cost leadership toward ecosystem strength, including regulatory compliance, supply chain integration, and digital solvent management.

Why is the Food Grade Solvent Market growing?

The Food Grade Solvent Market is expanding due to technological advancement, industry modernization, and evolving consumer preferences. Precision in food processing and analytical testing has been enhanced through improved solvent purification, which ensures safety and compliance in sensitive applications. Bio-based innovation is another driver, supported by fermentation technologies that lower production costs of ethanol and glycerol, enabling wider substitution for petrochemical derivatives.

Growing reliance on portable devices and digital testing platforms has also increased demand for high-purity solvents, particularly in chromatography. In parallel, the food and beverage industry is experiencing heightened demand for functional, natural, and convenience products, which require solvents in flavor extraction, preservation, and formulation. Regulatory frameworks across Europe, North America, and Asia-Pacific are reinforcing this trend by promoting sustainable practices and clean-label product adoption. Together, these factors are ensuring consistent growth, while natural solvents emerge as the most transformative category within the decade ahead.

Segmental Analysis

The Food Grade Solvent Market is segmented across product type, source, and application, each contributing unique growth dynamics. These categories are defining competitive positioning, shaping technological innovation, and guiding investment priorities for manufacturers. Product type segmentation emphasizes ethanol’s leadership, supported by its wide applicability in flavor extraction and beverage processing, while highlighting fast-growing categories such as ethyl acetate.

Source analysis illustrates the accelerating adoption of bio-based solvents, driven by sustainability mandates and consumer preference for clean-label food products. Application trends underscore the central role of food processing as the largest demand driver, while flavor extraction emerges as the fastest-growing segment, reflecting the rising importance of natural formulations. Each of these dimensions is expected to undergo transformative shifts over the decade, supported by regulatory alignment, advances in biotechnology, and evolving consumer demand for high-quality and sustainable ingredients.
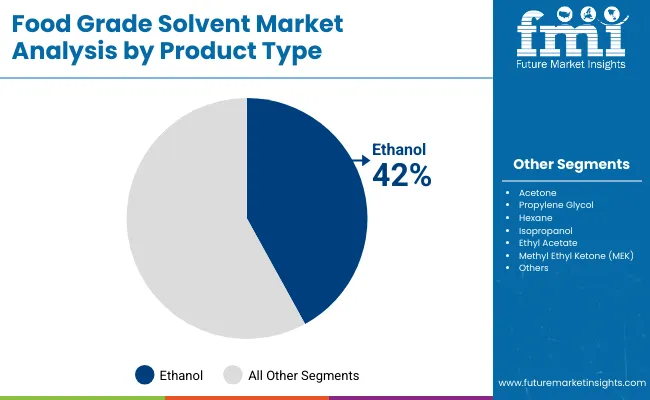
Insights into the Product Type Segment with Ethanol Leading Market Share

Food Grade Solvent Market By Product

Product Type Market Value Share, 2025
Ethanol 42.0%
Others 58.0%

Ethanol dominates the Food Grade Solvent Market with 42.0% share in 2025, expanding at 5.2% CAGR. Its wide applicability across beverages, bakery, and flavor extraction sustains its leadership. Ethyl acetate, with the fastest growth at 5.5% CAGR, is expected to gain relevance, though it remains smaller in scale compared to ethanol. Isopropanol also reflects strong utility in food-grade cleaning and analytical testing, while glycerol and propylene glycol provide formulation stability. Despite this diversity, ethanol remains unrivaled in scale, serving as the cornerstone of demand. Over the forecast period, ethanol’s balance of volume dominance and adaptability across multiple industries ensures its continued leadership, even as specialized bio-based solvents attract attention for sustainability-driven opportunities.
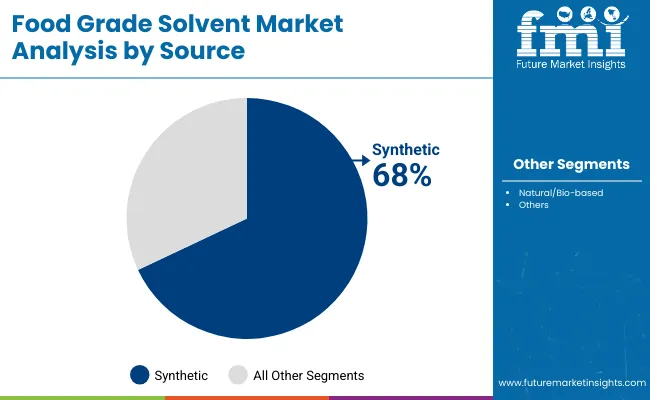
Insights into the Source Segment with Synthetic Dominating but Bio-based Expanding Fastest

Food Grade Solvent Market By Source

Source Market Value Share, 2025
Synthetic 68.0%
Others 32.0%

Synthetic solvents account for the majority of consumption, with 68.0% share in 2025, reflecting their entrenched use in preservation and bulk food production. Growth, however, is restrained at 3.9% CAGR due to sustainability pressures and rising consumer preference for natural alternatives. Bio-based solvents, though smaller at 32.0% share, are projected to expand fastest at 6.1% CAGR, supported by bioethanol and glycerol scaling through fermentation and biorefinery investments. This structural shift highlights an industry realignment, where bio-based inputs progressively capture share in premium and functional applications. By 2035, natural solvents are expected to hold a significantly larger role, reshaping competitive strategies and offering manufacturers opportunities to differentiate through sustainability-led innovation.
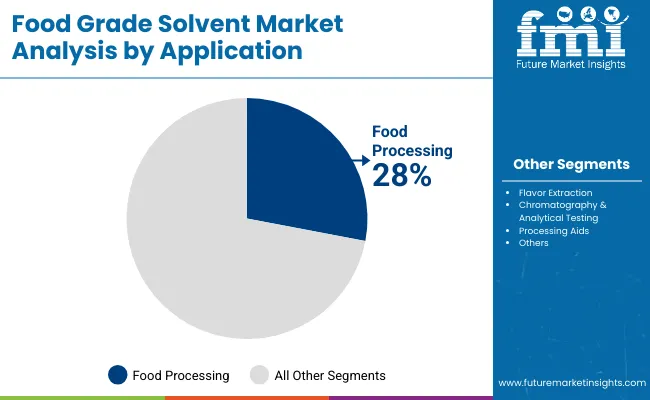
Insights into the Application Segment with Food Processing Leading Market Share

Food Grade Solvent Market By Application

Application Market Value Share, 2025
Food Processing 28.00%
Others 72.00%

Food processing leads with 28.0% share in 2025, growing steadily at 4.2% CAGR. Solvents are indispensable in ingredient refinement, preservation, and consistency across large-scale production, making this segment the backbone of demand. Flavor extraction is forecast as the fastest-growing application, reflecting a 5.6% CAGR supported by global appetite for natural and functional flavors. Chromatography and testing applications also strengthen, driven by food safety mandates and analytical precision requirements. While other categories grow at varying rates, food processing continues to command the largest absolute value, sustaining its influence across the decade. Its integration into bakery, dairy, and packaged food supply chains ensures stability, while innovation in natural formulations enhances its forward-looking role.

What are the Drivers, Restraints, and Key Trends of the Food Grade Solvent Market?

Growth of the Food Grade Solvent Market is influenced by structural demand drivers, regulatory challenges, and transformative industry trends. These forces collectively determine adoption trajectories, technological priorities, and sustainability pathways, shaping both regional opportunities and global competitiveness across the forecast horizon.

Driver: Expansion of Bio-Based Solvents

The strongest driver shaping the Food Grade Solvent Market is the accelerated adoption of bio-based solvents, which are forecast to expand at a 6.1% CAGR, significantly outpacing synthetics. This shift is being encouraged by stringent regulatory frameworks across Europe, the USA, and Asia-Pacific, where policymakers promote eco-friendly solutions in food processing and packaging. Fermentation-based ethanol and glycerol are serving as the foundation of this transformation, supported by cost reductions achieved through biotechnology and biorefinery innovations. Consumer preference for clean-label, natural, and sustainable ingredients has reinforced the attractiveness of bio-based solvents, especially in flavor extraction and dairy applications where product purity is critical.

Multinational food companies are responding by integrating bio-based solvents into their formulations to align with sustainability goals and enhance brand differentiation. Investment flows into fermentation and renewable feedstock facilities further demonstrate the scalability of bio-based production. Over the coming decade, this expansion is expected to transition bio-based solvents from niche adoption into mainstream applications, creating long-term structural changes within the market. This trend not only reflects regulatory and consumer alignment but also positions manufacturers that embrace bio-based portfolios as industry leaders in sustainability-driven innovation.

Restraint: Regulatory and Compliance Barriers

A key restraint facing the Food Grade Solvent Market is the increasing stringency of regulatory and compliance requirements, which limit the flexibility of manufacturers and slow the pace of product commercialization. Food safety agencies such as the USA Food and Drug Administration (FDA) and the European Food Safety Authority (EFSA) impose rigorous standards on solvent purity, permissible residue levels, and sourcing transparency. These measures, while critical for consumer protection, increase compliance costs for manufacturers, particularly those dependent on synthetic solvents that face stricter scrutiny. Smaller firms encounter challenges in meeting these requirements due to resource constraints, leading to slower adoption of advanced solvent formulations.

Additionally, differences in compliance frameworks between regions create complexity for global producers, necessitating multiple parallel validation processes. Regulatory restrictions on certain petrochemical derivatives, such as hexane and acetone, have further constrained their market growth, despite their established industrial utility. The push toward bio-based alternatives also requires certification and traceability mechanisms, adding layers of compliance. Although these regulations foster market credibility and ensure safety, they create a restraint by raising entry barriers and increasing operational costs. Consequently, only manufacturers with robust compliance capabilities and sustained investment in quality assurance can effectively navigate this restrictive environment.
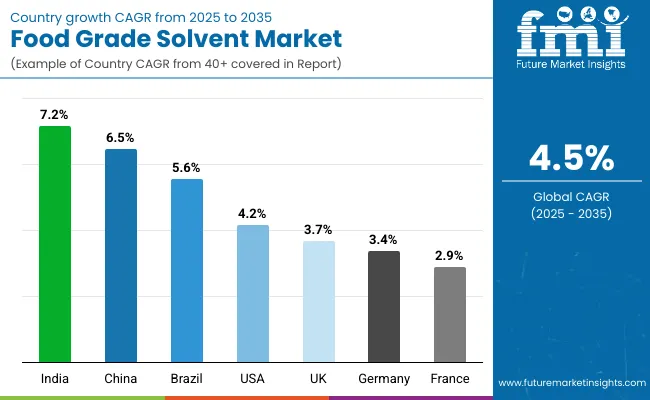
Analysis of Food Grade Solvent Market By Key Countries

Food Grade Solvent Market By Country

Countries CAGR
China 6.5%
India 7.2%
Germany 3.4%
France 2.9%
UK 3.7%
USA 4.2%
Brazil 5.6%

Adoption of food grade solvents is evolving unevenly across regions, with Asia-Pacific, Europe, and North America representing the most influential markets. In Asia-Pacific, strong growth is forecast as industrial modernization and rising packaged food consumption fuel solvent usage in bakery, dairy, and flavor extraction. China is expected to record a 6.5% CAGR, increasing its global share from 14% in 2025 to 19% in 2035, while India, expanding at 7.2% CAGR, is positioned as the fastest-growing national market. These countries are benefiting from both consumer demand and government-led policies encouraging sustainable food production.

Europe demonstrates a more compliance-driven profile, with solvent adoption shaped by strict regulations on purity, residue limits, and sustainability standards. Germany and France, recording slower CAGRs of 3.4% and 2.9% respectively, reflect market maturity but remain important hubs for innovation in bio-based formulations under EU green directives. The UK, growing at 3.7% CAGR, shows consistent reliance on solvents within beverages and bakery processing.

In North America, the United States remains a leader, holding 18% of global share in 2025, though this is expected to decline to 16% by 2035 as Asia gains prominence. With a 4.2% CAGR, USA growth remains tied to food processing modernization and sustainability transitions.
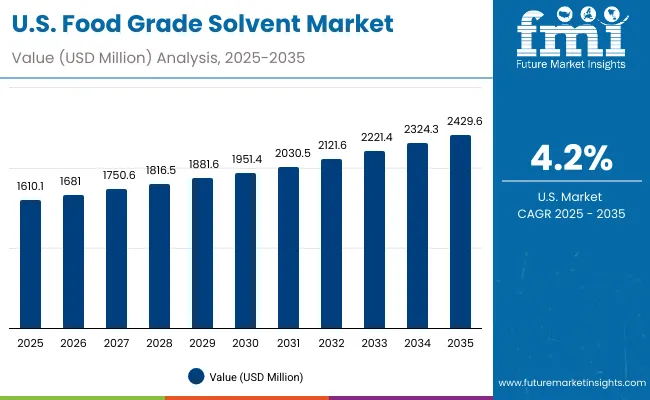
Sales Outlook for Food Grade Solvent in the United States

Food Grade Solvent Market Usa

Year USA Food Grade Solvent Market (USD Million)
2025 1,610.1
2026 1,681.0
2027 1,750.6
2028 1,816.5
2029 1,881.6
2030 1,951.4
2031 2,030.5
2032 2,121.6
2033 2,221.4
2034 2,324.3
2035 2,429.6

A CAGR of 4.2% has been projected for the United States, reflecting steady growth in a mature but compliance-driven market. Market value is expected to increase from USD 1,610.1 million in 2025 to USD 2,429.6 million by 2035, supported by strong adoption across beverages, dairy, and bakery sectors. Stringent FDA regulations ensure high safety and purity standards, reinforcing demand for ethanol, isopropanol, and ethyl acetate in food processing and testing applications. Innovation in chromatography and analytical workflows is enhancing the role of solvents in quality assurance, while sustainability transitions are encouraging substitution with bio-based ethanol and glycerol. Despite a relative decline in global share from 18% in 2025 to 16% in 2035, the USA will remain a cornerstone market for premium, compliant, and innovation-driven adoption.
  • Ethanol dominates solvent applications across beverages and dairy.
  • FDA regulations reinforce compliance and quality assurance.
  • Chromatography and analytical testing strengthen adoption.
  • Bio-based solvents gain traction under sustainability initiatives.

Growth and Expansion Outlook for the Food Grade Solvent Market in the United Kingdom

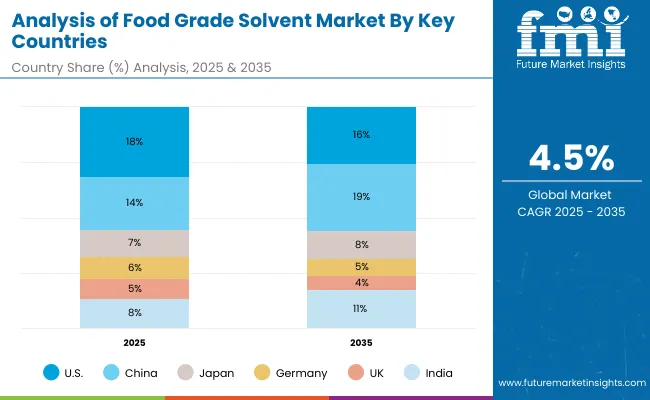
Food Grade Solvent Market Key Country

Countries / Subregion 2025 Market Share (%)
USA 18%
China 14%
Japan 7%
Germany 6%
UK 5%
India 8%
Countries / Subregion 2035 Market Share (%)
USA 16%
China 19%
Japan 8%
Germany 5%
UK 4%
India 11%

A CAGR of 3.7% has been projected for the United Kingdom, reflecting moderate but stable growth in a mature European market. Market share is expected to decline from 5% in 2025 to 4% by 2035, as faster expansion in Asia-Pacific shifts global balances. Ethanol remains the primary solvent in beverages and bakery processing, while ethyl acetate and isopropanol support preservation and formulation functions.

Regulatory alignment with EU standards ensures strict monitoring of purity, sustainability, and residue levels, creating a compliance-led adoption framework. Growth in flavor extraction highlights consumer preference for clean-label and natural products, while demand from premium bakery and beverage categories underpins steady consumption. Despite limited volume growth, the UK retains importance through innovation-driven adoption, regulatory credibility, and consumer focus on premium quality.

  • Ethanol dominates beverage and bakery applications.
  • EU-aligned regulations emphasize sustainability and safety.
  • Flavor extraction expands with clean-label demand.
  • Market importance sustained through innovation-led adoption.

Growth and Expansion Outlook for the Food Grade Solvent Market in Germany

A CAGR of 3.4% has been projected for Germany, reflecting modest expansion in a mature but regulation-heavy market. Market share is expected to decline from 6% in 2025 to 5% in 2035, as faster-growing Asian markets capture global momentum. Ethanol and ethyl acetate are widely used across bakery, dairy, and confectionery industries, while glycerol supports specialized formulations. Adoption is strongly shaped by EU regulations emphasizing safety, sustainability, and traceability, which reinforce demand for bio-based solvents despite higher compliance costs.

Innovation in green chemistry and circular economy initiatives is strengthening Germany’s role as a hub for sustainable formulation research, even as volume growth remains constrained. The country’s solvent market is expected to retain influence through its alignment with eco-conscious standards and its reputation for high-quality, precision-driven food processing.

  • Ethanol and ethyl acetate sustain core demand in food industries.
  • EU sustainability rules accelerate adoption of bio-based solvents.
  • Innovation in green chemistry supports long-term positioning.
  • Market growth constrained by maturity and compliance costs.

Growth and Expansion Outlook for the Food Grade Solvent Market in China

A CAGR of 6.5% has been projected for China, positioning it as one of the fastest-expanding national markets globally. Market share is forecast to rise from 14% in 2025 to 19% in 2035, overtaking the United States as the largest contributor. Ethanol, isopropanol, and ethyl acetate are widely adopted in beverages, packaged foods, and flavor extraction, supported by rapid industrial modernization. Strong government policies promoting sustainable food production and bio-based innovation are further reinforcing demand. Expanding middle-class consumption, coupled with growth in convenience foods and dairy products, underpins solvent uptake across applications. With increased investment in fermentation technologies and domestic production capacity, China is expected to serve as both a key demand center and a global supplier of food grade solvents.
  • Market share expands from 14% in 2025 to 19% in 2035.
  • Ethanol, isopropanol, and ethyl acetate lead consumption.
  • Policy support drives bio-based and sustainable adoption.
  • China emerges as both demand hub and export base.

Growth and Expansion Outlook for the Food Grade Solvent Market in Japan

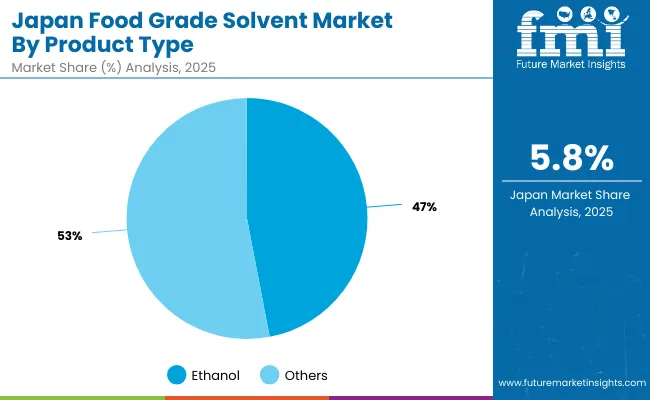
Food Grade Solvent Market Japan

Product Type Market Value Share, 2025
Ethanol 47%
Others 53%

A CAGR of around 4.0-5.0% has been projected for Japan, supported by mature but innovation-driven adoption in beverages, bakery, and dairy industries. Ethanol dominates consumption with 47% share in 2025, growing at 5.8% CAGR, supported by demand for flavor extraction and beverage preservation. Ethyl acetate and isopropanol are also gaining traction in flavor stabilization and food-grade cleaning.

Japan’s strong regulatory alignment with carbon neutrality targets is stimulating bio-based solvent substitution, particularly in high-value applications such as functional foods and cosmetics. Chromatography and analytical testing are also growing steadily, reinforcing the importance of precision-driven solvent adoption. By 2035, Japan is expected to retain its reputation as a premium, high-quality market, underpinned by its innovation-led approach to sustainability and digital testing infrastructure.
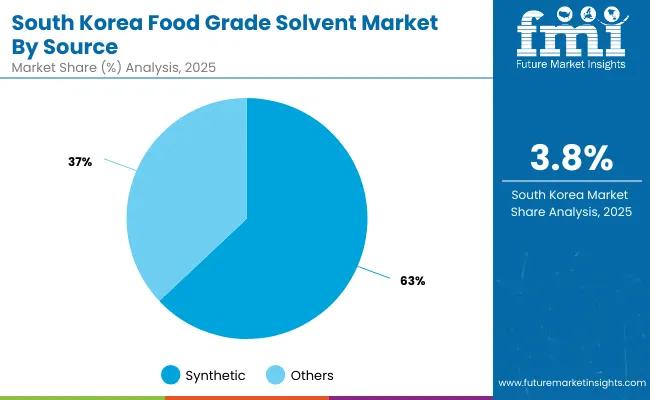
Growth and Expansion Outlook for the Food Grade Solvent Market in South Korea

Food Grade Solvent Market South Korea

Source Market Value Share, 2025
Synthetic 63%
Others 37%

A CAGR of around 4.5-5.0% has been projected for South Korea, supported by strong sustainability transitions and advanced laboratory integration. In 2025, synthetic solvents dominate with 63% share, though growth is restrained at 3.8% CAGR. Natural/bio-based solvents, representing 37% share, expand at a faster 6.4% CAGR, highlighting the country’s commitment to green technology adoption. Ethanol and isopropanol dominate applications across beverages and dairy, while ethyl acetate and propylene glycol gain importance in sauces, bakery, and confectionery. With government-led carbon neutrality goals and Industry 4.0 adoption in processing plants, South Korea is well-positioned to lead the East Asian market in sustainability-driven solvent usage by 2035.
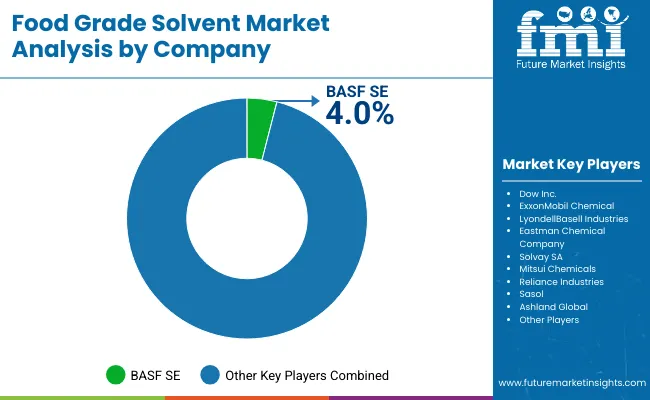
Competitive Landscape of Food Grade Solvent Market

Food Grade Solvent Market By Company

The Food Grade Solvent Market is characterized by the presence of global chemical leaders, regional producers, and specialized innovators. Established multinational companies such as BASF SE, Dow Inc., ExxonMobil Chemical, and LyondellBasell Industries dominate through integrated portfolios that include ethanol, isopropanol, and ethyl acetate. Collectively, these players account for an estimated 12-14% of global market share in 2024, highlighting a moderately consolidated structure. Their competitive advantage is reinforced by large-scale production capacities, global distribution networks, and long-standing partnerships with food and beverage manufacturers.

In parallel, regional producers in Asia-Pacific, including firms in China and India, are expanding rapidly, leveraging fermentation and biorefinery technologies to scale bio-based ethanol and glycerol production. This is reshaping competition by aligning solvent portfolios with sustainability goals and regulatory compliance. Mid-sized innovators are differentiating through product purity, specialty formulations, and integration of solvents with digital laboratory testing platforms.

The future competitive edge is expected to be defined not only by chemical innovation but also by ecosystem integration. Strategies such as bundling solvents with digital monitoring tools, adopting subscription-based supply models, and expanding bio-based production capacity will play decisive roles. Companies that adapt portfolios toward sustainability while maintaining cost competitiveness are forecast to lead the decade ahead.

Key Developments in Food Grade Solvent Market

  • March 2025 - BASF SE announced the expansion of its bioethanol production capacity at its Ludwigshafen facility to meet rising demand for food grade solvents. The move supports sustainability targets and strengthens the company’s role in supplying eco-friendly ingredients to the global food and beverage industry.
  • July 2025 - Dow Inc. introduced a high-purity ethyl acetate line designed for flavor extraction and food preservation. The new range utilizes advanced purification processes, addressing the growing preference for natural formulations and reinforcing Dow’s position in sustainable and compliance-driven solvent innovation.

Scope of the Report

Item Value
Market Size, 2025 USD 8,945.2 Million
Market Size, 2035 USD 13,830.6 Million
Absolute Growth (2025-2035) USD 4,885.4 Million
CAGR (2025-2035) 4.50%
Value Added 2025-2030 USD 2,022.0 Million
Value Added 2030-2035 USD 2,863.4 Million
Applications (2025) Food Processing: USD 2,504.7 Million (28.0%); Others: USD 6,440.5 Million (72.0%)
Product Type (2025) Ethanol: USD 3,757.0 Million (42.0%); Others: USD 5,188.2 Million (58.0%)
Source (2025) Synthetic: USD 6,083.7 Million (68.0%); Bio-based: USD 2,861.5 Million (32.0%)
End-Use Hotspots (2025) Beverages: 27.0% share; Bakery & Confectionery: 18.0% share
Growth Hotspots (CAGR) India 7.2%; China 6.5%; South Asia & Pacific 6.2%; East Asia 5.7%
Regions Covered North America, Latin America, Europe, East Asia, South Asia & Pacific, Middle East & Africa
Countries Covered United States, United Kingdom, Germany, France, China, India, Japan, South Korea, Brazil
Key Companies Profiled BASF SE, Dow Inc., ExxonMobil Chemical, LyondellBasell Industries, Eastman Chemical Company, Solvay SA, Mitsui Chemicals, Reliance Industries, Sasol, Ashland Global
Additional Attributes Bio-based adoption, fermentation-derived ethanol scale-up, AI-enabled solvent testing, and Industry 4.0 compliance integration are shaping competitive advantage.

Key Segments

By Product Type:

  • Ethanol
  • Acetone
  • Propylene Glycol
  • Hexane
  • Isopropanol
  • Ethyl Acetate
  • Methyl Ethyl Ketone (MEK)
  • Others (including glycerol, etc.)

By Source:

  • Synthetic
  • Natural/Bio-based

By Application:

  • Flavor Extraction
  • Food Processing
  • Chromatography & Analytical Testing
  • Processing Aids
  • Others (formulation, preservation, etc.)

By End-Use Industry:

  • Beverages
  • Bakery & Confectionery
  • Oils & Fats
  • Dairy & Frozen Desserts
  • Snacks & Convenience Foods
  • Others (sauces, condiments, etc.)

By Region:

  • North America
  • Latin America
  • Europe
  • East Asia
  • South Asia & Pacific
  • Middle East & Africa

Table of Content

  1. Executive Summary
    • Global Market Outlook
    • Demand-side Trends
    • Supply-side Trends
    • Technology Roadmap Analysis
    • Analysis and Recommendations
  2. Market Overview
    • Market Coverage / Taxonomy
    • Market Definition / Scope / Limitations
  3. Market Background
    • Market Dynamics
      • Drivers
      • Restraints
      • Opportunity
      • Trends
    • Scenario Forecast
      • Demand in Optimistic Scenario
      • Demand in Likely Scenario
      • Demand in Conservative Scenario
    • Opportunity Map Analysis
    • Product Life Cycle Analysis
    • Supply Chain Analysis
    • Investment Feasibility Matrix
    • Value Chain Analysis
    • PESTLE and Porter’s Analysis
    • Regulatory Landscape
    • Regional Parent Market Outlook
    • Production and Consumption Statistics
    • Import and Export Statistics
  4. Global Market Analysis 2020 to 2024 and Forecast, 2025 to 2035
    • Historical Market Size Value (USD Million) & Volume (MT) Analysis, 2020 to 2024
    • Current and Future Market Size Value (USD Million) & Volume (MT) Projections, 2025 to 2035
      • Y-o-Y Growth Trend Analysis
      • Absolute $ Opportunity Analysis
  5. Global Market Pricing Analysis 2020 to 2024 and Forecast 2025 to 2035
  6. Global Market Analysis 2020 to 2024 and Forecast 2025 to 2035, By Product Type
    • Introduction / Key Findings
    • Historical Market Size Value (USD Million) & Volume (MT) Analysis By Product Type, 2020 to 2024
    • Current and Future Market Size Value (USD Million) & Volume (MT) Analysis and Forecast By Product Type, 2025 to 2035
      • Ethanol
      • Acetone
      • Propylene Glycol
      • Hexane
      • Isopropanol
      • Ethyl Acetate
      • Methyl Ethyl Ketone (MEK)
      • Others (including glycerol, etc.)
    • Y-o-Y Growth Trend Analysis By Product Type, 2020 to 2024
    • Absolute $ Opportunity Analysis By Product Type, 2025 to 2035
  7. Global Market Analysis 2020 to 2024 and Forecast 2025 to 2035, By Source
    • Introduction / Key Findings
    • Historical Market Size Value (USD Million) & Volume (MT) Analysis By Source, 2020 to 2024
    • Current and Future Market Size Value (USD Million) & Volume (MT) Analysis and Forecast By Source, 2025 to 2035
      • Synthetic
      • Natural/Bio-based
    • Y-o-Y Growth Trend Analysis By Source, 2020 to 2024
    • Absolute $ Opportunity Analysis By Source, 2025 to 2035
  8. Global Market Analysis 2020 to 2024 and Forecast 2025 to 2035, By Application
    • Introduction / Key Findings
    • Historical Market Size Value (USD Million) & Volume (MT) Analysis By Application, 2020 to 2024
    • Current and Future Market Size Value (USD Million) & Volume (MT) Analysis and Forecast By Application, 2025 to 2035
      • Flavor Extraction
      • Food Processing
      • Chromatography & Analytical Testing
      • Processing Aids
      • Others (formulation, preservation, etc.)
    • Y-o-Y Growth Trend Analysis By Application, 2020 to 2024
    • Absolute $ Opportunity Analysis By Application, 2025 to 2035
  9. Global Market Analysis 2020 to 2024 and Forecast 2025 to 2035, By End-Use Industry
    • Introduction / Key Findings
    • Historical Market Size Value (USD Million) & Volume (MT) Analysis By End-Use Industry, 2020 to 2024
    • Current and Future Market Size Value (USD Million) & Volume (MT) Analysis and Forecast By End-Use Industry, 2025 to 2035
      • Beverages
      • Bakery & Confectionery
      • Oils & Fats
      • Dairy & Frozen Desserts
      • Snacks & Convenience Foods
      • Others (sauces, condiments, etc.)
    • Y-o-Y Growth Trend Analysis By End-Use Industry, 2020 to 2024
    • Absolute $ Opportunity Analysis By End-Use Industry, 2025 to 2035
  10. Global Market Analysis 2020 to 2024 and Forecast 2025 to 2035, By Region
    • Introduction
    • Historical Market Size Value (USD Million) & Volume (MT) Analysis By Region, 2020 to 2024
    • Current Market Size Value (USD Million) & Volume (MT) Analysis and Forecast By Region, 2025 to 2035
      • North America
      • Latin America
      • Europe
      • East Asia
      • South Asia & Pacific
      • Middle East & Africa
    • Market Attractiveness Analysis By Region
  11. North America Market Analysis 2020 to 2024 and Forecast 2025 to 2035, By Country
    • Historical Market Size Value (USD Million) & Volume (MT) Trend Analysis By Market Taxonomy, 2020 to 2024
    • Market Size Value (USD Million) & Volume (MT) Forecast By Market Taxonomy, 2025 to 2035
      • By Country
        • USA
        • Canada
      • By Product Type
      • By Source
      • By Application
      • By End-Use Industry
    • Market Attractiveness Analysis
      • By Country
      • By Product Type
      • By Source
      • By Application
      • By End-Use Industry
    • Key Takeaways
  12. Latin America Market Analysis 2020 to 2024 and Forecast 2025 to 2035, By Country
    • Historical Market Size Value (USD Million) & Volume (MT) Trend Analysis By Market Taxonomy, 2020 to 2024
    • Market Size Value (USD Million) & Volume (MT) Forecast By Market Taxonomy, 2025 to 2035
      • By Country
        • Brazil
        • Mexico
        • Colombia
        • Rest of Latin America
      • By Product Type
      • By Source
      • By Application
      • By End-Use Industry
    • Market Attractiveness Analysis
      • By Country
      • By Product Type
      • By Source
      • By Application
      • By End-Use Industry
    • Key Takeaways
  13. Europe Market Analysis 2020 to 2024 and Forecast 2025 to 2035, By Country
    • Historical Market Size Value (USD Million) & Volume (MT) Trend Analysis By Market Taxonomy, 2020 to 2024
    • Market Size Value (USD Million) & Volume (MT) Forecast By Market Taxonomy, 2025 to 2035
      • By Country
        • Germany
        • UK
        • France
        • Italy
        • Spain
        • Belgium
        • Netherlands
        • Nordic
        • Russia
        • Poland
        • Switzerland
        • Rest of Europe
      • By Product Type
      • By Source
      • By Application
      • By End-Use Industry
    • Market Attractiveness Analysis
      • By Country
      • By Product Type
      • By Source
      • By Application
      • By End-Use Industry
    • Key Takeaways
  14. East Asia Market Analysis 2020 to 2024 and Forecast 2025 to 2035, By Country
    • Historical Market Size Value (USD Million) & Volume (MT) Trend Analysis By Market Taxonomy, 2020 to 2024
    • Market Size Value (USD Million) & Volume (MT) Forecast By Market Taxonomy, 2025 to 2035
      • By Country
        • China
        • Japan
        • South Korea
      • By Product Type
      • By Source
      • By Application
      • By End-Use Industry
    • Market Attractiveness Analysis
      • By Country
      • By Product Type
      • By Source
      • By Application
      • By End-Use Industry
    • Key Takeaways
  15. South Asia & Pacific Market Analysis 2020 to 2024 and Forecast 2025 to 2035, By Country
    • Historical Market Size Value (USD Million) & Volume (MT) Trend Analysis By Market Taxonomy, 2020 to 2024
    • Market Size Value (USD Million) & Volume (MT) Forecast By Market Taxonomy, 2025 to 2035
      • By Country
        • India
        • Thailand
        • Malaysia
        • Indonesia
        • Singapore
        • Vietnam
        • Australia
        • New Zealand
        • Rest of South Asia & Pacific
      • By Product Type
      • By Source
      • By Application
      • By End-Use Industry
    • Market Attractiveness Analysis
      • By Country
      • By Product Type
      • By Source
      • By Application
      • By End-Use Industry
    • Key Takeaways
  16. Middle East & Africa Market Analysis 2020 to 2024 and Forecast 2025 to 2035, By Country
    • Historical Market Size Value (USD Million) & Volume (MT) Trend Analysis By Market Taxonomy, 2020 to 2024
    • Market Size Value (USD Million) & Volume (MT) Forecast By Market Taxonomy, 2025 to 2035
      • By Country
        • Turkey
        • UAE
        • Saudi Arabia
        • Israel
        • Other GCC Countries
        • North Africa
        • South Africa
        • Central Africa
      • By Product Type
      • By Source
      • By Application
      • By End-Use Industry
    • Market Attractiveness Analysis
      • By Country
      • By Product Type
      • By Source
      • By Application
      • By End-Use Industry
    • Key Takeaways
  17. Key Countries Market Analysis
    • USA
      • Pricing Analysis
      • Market Share Analysis, 2024
        • By Product Type
        • By Source
        • By Application
        • By End-Use Industry
    • Canada
      • Pricing Analysis
      • Market Share Analysis, 2024
        • By Product Type
        • By Source
        • By Application
        • By End-Use Industry
    • Brazil
      • Pricing Analysis
      • Market Share Analysis, 2024
        • By Product Type
        • By Source
        • By Application
        • By End-Use Industry
    • Mexico
      • Pricing Analysis
      • Market Share Analysis, 2024
        • By Product Type
        • By Source
        • By Application
        • By End-Use Industry
    • Columbia
      • Pricing Analysis
      • Market Share Analysis, 2024
        • By Product Type
        • By Source
        • By Application
        • By End-Use Industry
    • Germany
      • Pricing Analysis
      • Market Share Analysis, 2024
        • By Product Type
        • By Source
        • By Application
        • By End-Use Industry
    • UK
      • Pricing Analysis
      • Market Share Analysis, 2024
        • By Product Type
        • By Source
        • By Application
        • By End-Use Industry
    • France
      • Pricing Analysis
      • Market Share Analysis, 2024
        • By Product Type
        • By Source
        • By Application
        • By End-Use Industry
    • Italy
      • Pricing Analysis
      • Market Share Analysis, 2024
        • By Product Type
        • By Source
        • By Application
        • By End-Use Industry
    • Spain
      • Pricing Analysis
      • Market Share Analysis, 2024
        • By Product Type
        • By Source
        • By Application
        • By End-Use Industry
    • Belgium
      • Pricing Analysis
      • Market Share Analysis, 2024
        • By Product Type
        • By Source
        • By Application
        • By End-Use Industry
    • Netherlands
      • Pricing Analysis
      • Market Share Analysis, 2024
        • By Product Type
        • By Source
        • By Application
        • By End-Use Industry
    • Nordic
      • Pricing Analysis
      • Market Share Analysis, 2024
        • By Product Type
        • By Source
        • By Application
        • By End-Use Industry
    • Russia
      • Pricing Analysis
      • Market Share Analysis, 2024
        • By Product Type
        • By Source
        • By Application
        • By End-Use Industry
    • Poland
      • Pricing Analysis
      • Market Share Analysis, 2024
        • By Product Type
        • By Source
        • By Application
        • By End-Use Industry
    • Switzerland
      • Pricing Analysis
      • Market Share Analysis, 2024
        • By Product Type
        • By Source
        • By Application
        • By End-Use Industry
    • China
      • Pricing Analysis
      • Market Share Analysis, 2024
        • By Product Type
        • By Source
        • By Application
        • By End-Use Industry
    • Japan
      • Pricing Analysis
      • Market Share Analysis, 2024
        • By Product Type
        • By Source
        • By Application
        • By End-Use Industry
    • South Korea
      • Pricing Analysis
      • Market Share Analysis, 2024
        • By Product Type
        • By Source
        • By Application
        • By End-Use Industry
    • India
      • Pricing Analysis
      • Market Share Analysis, 2024
        • By Product Type
        • By Source
        • By Application
        • By End-Use Industry
    • Thailand
      • Pricing Analysis
      • Market Share Analysis, 2024
        • By Product Type
        • By Source
        • By Application
        • By End-Use Industry
    • Malaysia
      • Pricing Analysis
      • Market Share Analysis, 2024
        • By Product Type
        • By Source
        • By Application
        • By End-Use Industry
    • Indonesia
      • Pricing Analysis
      • Market Share Analysis, 2024
        • By Product Type
        • By Source
        • By Application
        • By End-Use Industry
    • Singapore
      • Pricing Analysis
      • Market Share Analysis, 2024
        • By Product Type
        • By Source
        • By Application
        • By End-Use Industry
    • Vietnam
      • Pricing Analysis
      • Market Share Analysis, 2024
        • By Product Type
        • By Source
        • By Application
        • By End-Use Industry
    • Australia
      • Pricing Analysis
      • Market Share Analysis, 2024
        • By Product Type
        • By Source
        • By Application
        • By End-Use Industry
    • New Zealand
      • Pricing Analysis
      • Market Share Analysis, 2024
        • By Product Type
        • By Source
        • By Application
        • By End-Use Industry
    • Turkey
      • Pricing Analysis
      • Market Share Analysis, 2024
        • By Product Type
        • By Source
        • By Application
        • By End-Use Industry
    • UAE
      • Pricing Analysis
      • Market Share Analysis, 2024
        • By Product Type
        • By Source
        • By Application
        • By End-Use Industry
    • Saudi Arabia
      • Pricing Analysis
      • Market Share Analysis, 2024
        • By Product Type
        • By Source
        • By Application
        • By End-Use Industry
  18. Market Structure Analysis
    • Competition Dashboard
    • Competition Benchmarking
    • Market Share Analysis of Top Players
      • By Regional
      • By Product Type
      • By Source
      • By Application
      • By End-Use Industry
  19. Competition Analysis
    • Competition Deep Dive
  20. Assumptions & Acronyms Used
  21. Research Methodology

List of Tables

  • Table 1: Global Market Value (USD Million) Forecast by Region, 2020-2035
  • Table 2: Global Market Volume (MT) Forecast by Region, 2020-2035
  • Table 3: Global Market Value (USD Million) Forecast by Product Type, 2020-2035
  • Table 4: Global Market Volume (MT) Forecast by Product Type, 2020-2035
  • Table 5: Global Market Value (USD Million) Forecast by Source, 2020-2035
  • Table 6: Global Market Volume (MT) Forecast by Source, 2020-2035
  • Table 7: Global Market Value (USD Million) Forecast by Application, 2020-2035
  • Table 8: Global Market Volume (MT) Forecast by Application, 2020-2035
  • Table 9: Global Market Value (USD Million) Forecast by End-Use Industry, 2020-2035
  • Table 10: Global Market Volume (MT) Forecast by End-Use Industry, 2020-2035
  • Table 11: North America Market Value (USD Million) Forecast by Country, 2020-2035
  • Table 12: North America Market Volume (MT) Forecast by Country, 2020-2035
  • Table 13: North America Market Value (USD Million) Forecast by Product Type, 2020-2035
  • Table 14: North America Market Volume (MT) Forecast by Product Type, 2020-2035
  • Table 15: North America Market Value (USD Million) Forecast by Source, 2020-2035
  • Table 16: North America Market Volume (MT) Forecast by Source, 2020-2035
  • Table 17: North America Market Value (USD Million) Forecast by Application, 2020-2035
  • Table 18: North America Market Volume (MT) Forecast by Application, 2020-2035
  • Table 19: North America Market Value (USD Million) Forecast by End-Use Industry, 2020-2035
  • Table 20: North America Market Volume (MT) Forecast by End-Use Industry, 2020-2035
  • Table 21: Latin America Market Value (USD Million) Forecast by Country, 2020-2035
  • Table 22: Latin America Market Volume (MT) Forecast by Country, 2020-2035
  • Table 23: Latin America Market Value (USD Million) Forecast by Product Type, 2020-2035
  • Table 24: Latin America Market Volume (MT) Forecast by Product Type, 2020-2035
  • Table 25: Latin America Market Value (USD Million) Forecast by Source, 2020-2035
  • Table 26: Latin America Market Volume (MT) Forecast by Source, 2020-2035
  • Table 27: Latin America Market Value (USD Million) Forecast by Application, 2020-2035
  • Table 28: Latin America Market Volume (MT) Forecast by Application, 2020-2035
  • Table 29: Latin America Market Value (USD Million) Forecast by End-Use Industry, 2020-2035
  • Table 30: Latin America Market Volume (MT) Forecast by End-Use Industry, 2020-2035
  • Table 31: Europe Market Value (USD Million) Forecast by Country, 2020-2035
  • Table 32: Europe Market Volume (MT) Forecast by Country, 2020-2035
  • Table 33: Europe Market Value (USD Million) Forecast by Product Type, 2020-2035
  • Table 34: Europe Market Volume (MT) Forecast by Product Type, 2020-2035
  • Table 35: Europe Market Value (USD Million) Forecast by Source, 2020-2035
  • Table 36: Europe Market Volume (MT) Forecast by Source, 2020-2035
  • Table 37: Europe Market Value (USD Million) Forecast by Application, 2020-2035
  • Table 38: Europe Market Volume (MT) Forecast by Application, 2020-2035
  • Table 39: Europe Market Value (USD Million) Forecast by End-Use Industry, 2020-2035
  • Table 40: Europe Market Volume (MT) Forecast by End-Use Industry, 2020-2035
  • Table 41: East Asia Market Value (USD Million) Forecast by Country, 2020-2035
  • Table 42: East Asia Market Volume (MT) Forecast by Country, 2020-2035
  • Table 43: East Asia Market Value (USD Million) Forecast by Product Type, 2020-2035
  • Table 44: East Asia Market Volume (MT) Forecast by Product Type, 2020-2035
  • Table 45: East Asia Market Value (USD Million) Forecast by Source, 2020-2035
  • Table 46: East Asia Market Volume (MT) Forecast by Source, 2020-2035
  • Table 47: East Asia Market Value (USD Million) Forecast by Application, 2020-2035
  • Table 48: East Asia Market Volume (MT) Forecast by Application, 2020-2035
  • Table 49: East Asia Market Value (USD Million) Forecast by End-Use Industry, 2020-2035
  • Table 50: East Asia Market Volume (MT) Forecast by End-Use Industry, 2020-2035
  • Table 51: South Asia & Pacific Market Value (USD Million) Forecast by Country, 2020-2035
  • Table 52: South Asia & Pacific Market Volume (MT) Forecast by Country, 2020-2035
  • Table 53: South Asia & Pacific Market Value (USD Million) Forecast by Product Type, 2020-2035
  • Table 54: South Asia & Pacific Market Volume (MT) Forecast by Product Type, 2020-2035
  • Table 55: South Asia & Pacific Market Value (USD Million) Forecast by Source, 2020-2035
  • Table 56: South Asia & Pacific Market Volume (MT) Forecast by Source, 2020-2035
  • Table 57: South Asia & Pacific Market Value (USD Million) Forecast by Application, 2020-2035
  • Table 58: South Asia & Pacific Market Volume (MT) Forecast by Application, 2020-2035
  • Table 59: South Asia & Pacific Market Value (USD Million) Forecast by End-Use Industry, 2020-2035
  • Table 60: South Asia & Pacific Market Volume (MT) Forecast by End-Use Industry, 2020-2035
  • Table 61: Middle East & Africa Market Value (USD Million) Forecast by Country, 2020-2035
  • Table 62: Middle East & Africa Market Volume (MT) Forecast by Country, 2020-2035
  • Table 63: Middle East & Africa Market Value (USD Million) Forecast by Product Type, 2020-2035
  • Table 64: Middle East & Africa Market Volume (MT) Forecast by Product Type, 2020-2035
  • Table 65: Middle East & Africa Market Value (USD Million) Forecast by Source, 2020-2035
  • Table 66: Middle East & Africa Market Volume (MT) Forecast by Source, 2020-2035
  • Table 67: Middle East & Africa Market Value (USD Million) Forecast by Application, 2020-2035
  • Table 68: Middle East & Africa Market Volume (MT) Forecast by Application, 2020-2035
  • Table 69: Middle East & Africa Market Value (USD Million) Forecast by End-Use Industry, 2020-2035
  • Table 70: Middle East & Africa Market Volume (MT) Forecast by End-Use Industry, 2020-2035

List of Figures

  • Figure 1: Global Market Volume (MT) Forecast 2020-2035
  • Figure 2: Global Market Pricing Analysis
  • Figure 3: Global Market Value (USD Million) Forecast 2020-2035
  • Figure 4: Global Market Value Share and BPS Analysis by Product Type, 2025 and 2035
  • Figure 5: Global Market Y-o-Y Growth Comparison by Product Type, 2025-2035
  • Figure 6: Global Market Attractiveness Analysis by Product Type
  • Figure 7: Global Market Value Share and BPS Analysis by Source, 2025 and 2035
  • Figure 8: Global Market Y-o-Y Growth Comparison by Source, 2025-2035
  • Figure 9: Global Market Attractiveness Analysis by Source
  • Figure 10: Global Market Value Share and BPS Analysis by Application, 2025 and 2035
  • Figure 11: Global Market Y-o-Y Growth Comparison by Application, 2025-2035
  • Figure 12: Global Market Attractiveness Analysis by Application
  • Figure 13: Global Market Value Share and BPS Analysis by End-Use Industry, 2025 and 2035
  • Figure 14: Global Market Y-o-Y Growth Comparison by End-Use Industry, 2025-2035
  • Figure 15: Global Market Attractiveness Analysis by End-Use Industry
  • Figure 16: Global Market Value (USD Million) Share and BPS Analysis by Region, 2025 and 2035
  • Figure 17: Global Market Y-o-Y Growth Comparison by Region, 2025-2035
  • Figure 18: Global Market Attractiveness Analysis by Region
  • Figure 19: North America Market Incremental $ Opportunity, 2025-2035
  • Figure 20: Latin America Market Incremental $ Opportunity, 2025-2035
  • Figure 21: Europe Market Incremental $ Opportunity, 2025-2035
  • Figure 22: East Asia Market Incremental $ Opportunity, 2025-2035
  • Figure 23: South Asia & Pacific Market Incremental $ Opportunity, 2025-2035
  • Figure 24: Middle East & Africa Market Incremental $ Opportunity, 2025-2035
  • Figure 25: North America Market Value Share and BPS Analysis by Country, 2025 and 2035
  • Figure 26: North America Market Value Share and BPS Analysis by Product Type, 2025 and 2035
  • Figure 27: North America Market Y-o-Y Growth Comparison by Product Type, 2025-2035
  • Figure 28: North America Market Attractiveness Analysis by Product Type
  • Figure 29: North America Market Value Share and BPS Analysis by Source, 2025 and 2035
  • Figure 30: North America Market Y-o-Y Growth Comparison by Source, 2025-2035
  • Figure 31: North America Market Attractiveness Analysis by Source
  • Figure 32: North America Market Value Share and BPS Analysis by Application, 2025 and 2035
  • Figure 33: North America Market Y-o-Y Growth Comparison by Application, 2025-2035
  • Figure 34: North America Market Attractiveness Analysis by Application
  • Figure 35: North America Market Value Share and BPS Analysis by End-Use Industry, 2025 and 2035
  • Figure 36: North America Market Y-o-Y Growth Comparison by End-Use Industry, 2025-2035
  • Figure 37: North America Market Attractiveness Analysis by End-Use Industry
  • Figure 38: Latin America Market Value Share and BPS Analysis by Country, 2025 and 2035
  • Figure 39: Latin America Market Value Share and BPS Analysis by Product Type, 2025 and 2035
  • Figure 40: Latin America Market Y-o-Y Growth Comparison by Product Type, 2025-2035
  • Figure 41: Latin America Market Attractiveness Analysis by Product Type
  • Figure 42: Latin America Market Value Share and BPS Analysis by Source, 2025 and 2035
  • Figure 43: Latin America Market Y-o-Y Growth Comparison by Source, 2025-2035
  • Figure 44: Latin America Market Attractiveness Analysis by Source
  • Figure 45: Latin America Market Value Share and BPS Analysis by Application, 2025 and 2035
  • Figure 46: Latin America Market Y-o-Y Growth Comparison by Application, 2025-2035
  • Figure 47: Latin America Market Attractiveness Analysis by Application
  • Figure 48: Latin America Market Value Share and BPS Analysis by End-Use Industry, 2025 and 2035
  • Figure 49: Latin America Market Y-o-Y Growth Comparison by End-Use Industry, 2025-2035
  • Figure 50: Latin America Market Attractiveness Analysis by End-Use Industry
  • Figure 51: Europe Market Value Share and BPS Analysis by Country, 2025 and 2035
  • Figure 52: Europe Market Value Share and BPS Analysis by Product Type, 2025 and 2035
  • Figure 53: Europe Market Y-o-Y Growth Comparison by Product Type, 2025-2035
  • Figure 54: Europe Market Attractiveness Analysis by Product Type
  • Figure 55: Europe Market Value Share and BPS Analysis by Source, 2025 and 2035
  • Figure 56: Europe Market Y-o-Y Growth Comparison by Source, 2025-2035
  • Figure 57: Europe Market Attractiveness Analysis by Source
  • Figure 58: Europe Market Value Share and BPS Analysis by Application, 2025 and 2035
  • Figure 59: Europe Market Y-o-Y Growth Comparison by Application, 2025-2035
  • Figure 60: Europe Market Attractiveness Analysis by Application
  • Figure 61: Europe Market Value Share and BPS Analysis by End-Use Industry, 2025 and 2035
  • Figure 62: Europe Market Y-o-Y Growth Comparison by End-Use Industry, 2025-2035
  • Figure 63: Europe Market Attractiveness Analysis by End-Use Industry
  • Figure 64: East Asia Market Value Share and BPS Analysis by Country, 2025 and 2035
  • Figure 65: East Asia Market Value Share and BPS Analysis by Product Type, 2025 and 2035
  • Figure 66: East Asia Market Y-o-Y Growth Comparison by Product Type, 2025-2035
  • Figure 67: East Asia Market Attractiveness Analysis by Product Type
  • Figure 68: East Asia Market Value Share and BPS Analysis by Source, 2025 and 2035
  • Figure 69: East Asia Market Y-o-Y Growth Comparison by Source, 2025-2035
  • Figure 70: East Asia Market Attractiveness Analysis by Source
  • Figure 71: East Asia Market Value Share and BPS Analysis by Application, 2025 and 2035
  • Figure 72: East Asia Market Y-o-Y Growth Comparison by Application, 2025-2035
  • Figure 73: East Asia Market Attractiveness Analysis by Application
  • Figure 74: East Asia Market Value Share and BPS Analysis by End-Use Industry, 2025 and 2035
  • Figure 75: East Asia Market Y-o-Y Growth Comparison by End-Use Industry, 2025-2035
  • Figure 76: East Asia Market Attractiveness Analysis by End-Use Industry
  • Figure 77: South Asia & Pacific Market Value Share and BPS Analysis by Country, 2025 and 2035
  • Figure 78: South Asia & Pacific Market Value Share and BPS Analysis by Product Type, 2025 and 2035
  • Figure 79: South Asia & Pacific Market Y-o-Y Growth Comparison by Product Type, 2025-2035
  • Figure 80: South Asia & Pacific Market Attractiveness Analysis by Product Type
  • Figure 81: South Asia & Pacific Market Value Share and BPS Analysis by Source, 2025 and 2035
  • Figure 82: South Asia & Pacific Market Y-o-Y Growth Comparison by Source, 2025-2035
  • Figure 83: South Asia & Pacific Market Attractiveness Analysis by Source
  • Figure 84: South Asia & Pacific Market Value Share and BPS Analysis by Application, 2025 and 2035
  • Figure 85: South Asia & Pacific Market Y-o-Y Growth Comparison by Application, 2025-2035
  • Figure 86: South Asia & Pacific Market Attractiveness Analysis by Application
  • Figure 87: South Asia & Pacific Market Value Share and BPS Analysis by End-Use Industry, 2025 and 2035
  • Figure 88: South Asia & Pacific Market Y-o-Y Growth Comparison by End-Use Industry, 2025-2035
  • Figure 89: South Asia & Pacific Market Attractiveness Analysis by End-Use Industry
  • Figure 90: Middle East & Africa Market Value Share and BPS Analysis by Country, 2025 and 2035
  • Figure 91: Middle East & Africa Market Value Share and BPS Analysis by Product Type, 2025 and 2035
  • Figure 92: Middle East & Africa Market Y-o-Y Growth Comparison by Product Type, 2025-2035
  • Figure 93: Middle East & Africa Market Attractiveness Analysis by Product Type
  • Figure 94: Middle East & Africa Market Value Share and BPS Analysis by Source, 2025 and 2035
  • Figure 95: Middle East & Africa Market Y-o-Y Growth Comparison by Source, 2025-2035
  • Figure 96: Middle East & Africa Market Attractiveness Analysis by Source
  • Figure 97: Middle East & Africa Market Value Share and BPS Analysis by Application, 2025 and 2035
  • Figure 98: Middle East & Africa Market Y-o-Y Growth Comparison by Application, 2025-2035
  • Figure 99: Middle East & Africa Market Attractiveness Analysis by Application
  • Figure 100: Middle East & Africa Market Value Share and BPS Analysis by End-Use Industry, 2025 and 2035
  • Figure 101: Middle East & Africa Market Y-o-Y Growth Comparison by End-Use Industry, 2025-2035
  • Figure 102: Middle East & Africa Market Attractiveness Analysis by End-Use Industry
  • Figure 103: Global Market - Tier Structure Analysis
  • Figure 104: Global Market - Company Share Analysis

Frequently Asked Questions

What is the market size of the Food Grade Solvent Market in 2025?

The market is valued at USD 8,945.2 million in 2025, led by ethanol, which accounts for the largest share.

What is the projected market size by 2035?

The market is expected to reach USD 13,830.6 million by 2035, reflecting consistent growth over the decade.

What is the CAGR for the forecast period 2025-2035?

The market is projected to expand at a 4.5% CAGR during 2025-2035

Which product type dominates the Food Grade Solvent Market in 2025?

Ethanol dominates with 42.0% market share in 2025, driven by strong usage across beverages, bakery, and flavor extraction.

Which source segment is expanding fastest?

The Natural/Bio-based solvents category, holding 32.0% share in 2025, is growing at a 6.1% CAGR, outpacing synthetic solvents due to sustainability initiatives.

Explore Similar Insights

Future Market Insights

Food Grade Solvent Market

Chat With

MaRIA

Hi There, I am MaRIA, Your Market Research Intelligence Assistant. How may I help you?