Serine Amino Acid Market Size and Share Forecast Outlook 2025 to 2035

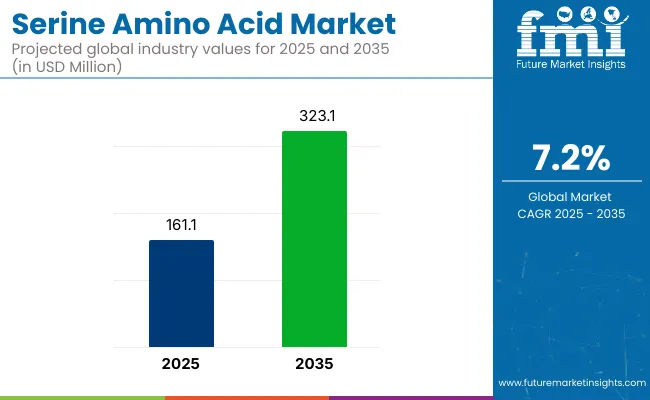
The global serine amino acid market is valued at USD 161.1 million in 2025 and is slated to reach USD 323.1 million by 2035, reflecting a CAGR of 7.2%. This growth will be driven by increasing awareness of cognitive health, rising demand for personalized nutrition, and technological advancements in biotechnology.
Quick Stats for Serine Amino Acid Market

  • Market Value (2025): USD 161.1 million
  • Forecast Value (2035): USD 323.1 million
  • Forecast CAGR: 7.2%
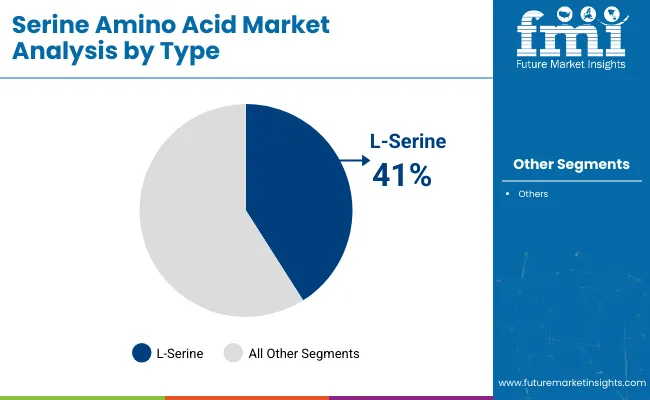
  • Type Leader in 2025: L-Serine (41% Market Share)
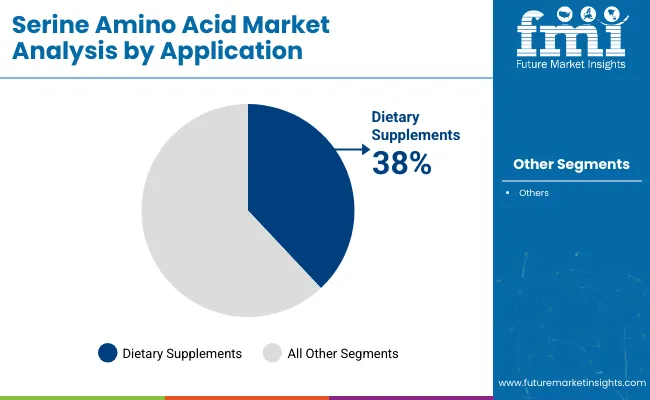
  • Top Application Segment: Dietary Supplements (38% Market Share in 2025)
  • Key Growth Region: East Asia (Japan is the fastest-growing market with 8.9% CAGR)

Serine Amino Acid Market

Metric Value
Market Size in 2025 USD 161.1 million
Market Size in 2035 USD 323.1 million
CAGR (2025 to 2035) 7.2%

In addition, growing applications in the pharmaceutical and functional food sectors are expected to propel market expansion. Supportive regulatory frameworks and sustainability efforts will also boost the adoption of serine amino acids globally.

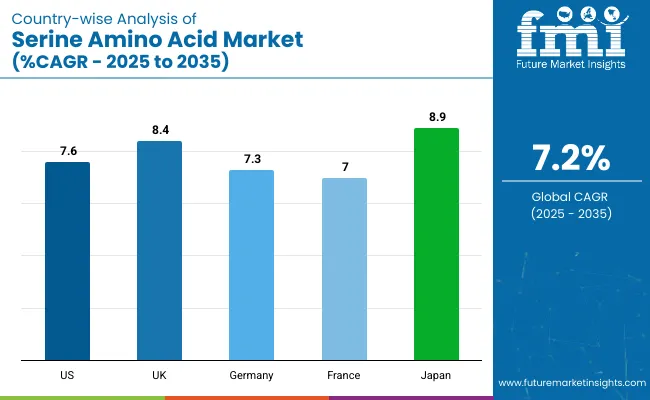
Japan is projected to grow at a CAGR of 8.9% by 2035, supported by its advanced pharmaceutical sector and increasing demand for cognitive health supplements. The UK is expected to expand at a CAGR of 8.4%, driven by public health initiatives and rising adoption of serine in nutraceuticals.

The USA will follow closely with a CAGR of 7.6%, fueled by growing healthcare spending and clinical use of serine in neurological therapies. L-serine will lead the type segment with a 41% share in 2025, while dietary supplements will dominate the application segment with a 38% share due to growing brain health awareness.

The market holds a relatively small but growing share across its parent markets. It accounts for approximately 3-4% of the global amino acids market, given its niche applications. In the nutraceutical ingredients market, its share is estimated at 2-3%, largely driven by cognitive health supplements.

Within the functional food ingredients segment, serine represents around 1-2%, while its share in the pharmaceutical ingredients market is about 2%, due to its role in neurology and metabolic therapies. In feed additives, the share remains below 1%, but is expected to grow with expanding animal nutrition research.

Analyzing Serine Amino Acid Market by Top Investment Segments

The serine amino acid market segments include type, application, and region. The type segment covers L-serine, D-serine, and DL-serine. The application segment includes dietary supplements, pharmaceuticals, and cosmetics. The regional segment comprises North America, Latin America, Western Europe, Eastern Europe, South Asia and Pacific, East Asia, and the Middle East and Africa.

L-Serine to Lead the Type Segment with 41% Market Share in 2025

L-serine is projected to dominate the type segment with a 41% market share, driven by its significant role in neurological function and its growing inclusion in dietary and pharmaceutical formulations.
  • The increasing demand for cognitive health solutions and research advancements in amino acid therapy are further fueling the demand for L-serine across global markets.
  • Additionally, its high bioavailability and compatibility with various delivery formats make L-serine a preferred choice among manufacturers and consumers alike.

Serine Amino Acid Market Analysis By Type

Dietary Supplements to Dominate the Application Segment with 38% Market Share in 2025

Dietary supplements are expected to remain the most lucrative segment, capturing a 38% market share in 2025. This is primarily due to the rising consumer focus on mental well-being, memory support, and healthy aging, which has driven demand for serine-enriched supplements.
  • Increased awareness about the role of serine in neurotransmitter production and stress management is further supporting this growth.
  • Additionally, the popularity of clean-label and plant-based supplements is encouraging manufacturers to include L-serine in innovative formulations across global health and wellness markets.

Serine Amino Acid Market Analysis By Application

Top Serine Amino Acid Market Dynamics

The market is expanding steadily, driven by rising demand for cognitive health supplements, increasing applications in pharmaceutical formulations, and advancements in biotechnology-based amino acid production for dietary and medical use.

Recent Trends in the Serine Amino Acid Market

  • Growing use of L-serine in personalized nutrition and cognitive health products
  • Increased adoption of biotechnology and fermentation for sustainable serine production
  • Surge in demand for clean-label and plant-based serine supplements
  • Integration of digital tools for traceability and quality control
  • Rising R&D investments in neuroprotective applications of serine

Challenges in the Serine Amino Acid Market
  • High production costs impacting price competitiveness
  • Stringent regulatory approvals are delaying product launches
  • Limited consumer awareness about serine’s health benefits
  • Supply chain disruptions due to geopolitical and raw material constraints
  • Intellectual property and patent infringement concerns for novel formulations

Analyzing Top Countries Developing and Consuming Serine Amino Acids

Country Wise Analysis Of Serine Amino Acid Market

Among the top five countries, Japan is expected to lead the market with the highest CAGR of 8.9% from 2025 to 2035, driven by its aging population and pharmaceutical advancements. The UK follows closely with 8.4%, backed by public health initiatives and strong nutraceutical demand.

The USA holds a solid CAGR of 7.6%, supported by healthcare spending and neurological research. Germany and France trail slightly with CAGRs of 7.3% and 7.0%, respectively, driven by pharmaceutical, cosmetic, and preventive healthcare trends.

The report covers in-depth analysis of 40+ countries; five top-performing OECD countries are highlighted below. 

USA Serine Amino Acids Market Analysis

The USA serine amino acid market is projected to grow at a CAGR of 7.6% from 2025 to 2035, driven by rising healthcare spending and growing interest in neurological health.

  • Growing demand for cognitive health supplements among the aging population.
  • Extensive pharmaceutical research on serine for neurological disorders.
  • High consumer adoption of functional and clean-label supplements.
  • Advanced production capabilities supported by biotech firms.

UK Serine Amino Acids Market Analysis

The UK serine amino acids revenueis expected to register a CAGR of 8.4% between 2025and 2035, propelled by regulatory initiatives and public funding for cognitive health research.

  • Government-backed health research is driving serine demand.
  • Strong consumer shift toward brain-supporting supplements.
  • FSA-enforced quality standards ensure product safety.
  • Expansion of online nutraceutical and supplement sales.

Serine Amino Acids Demand Analysis in Germany

Germany's serine amino acid revenue is forecasted to grow at a CAGR of 7.3% from 2025 to 2035, supported by robust demand from the pharmaceutical and cosmetics sectors.

  • Surge in demand for pharma-grade amino acid formulations.
  • Growing R&D investments in skincare and cosmetic uses.
  • Regulatory emphasis on ingredient safety and efficacy.
  • High awareness of amino acids in cognitive health.

Serine Amino Acids Demand Analysis in France

Demand for serine amino acids in France is anticipated to grow at a CAGR of 7.0% from 2025 to 2035, driven by the rise of preventive healthcare and dietary supplementation trends.

  • Rising adoption of preventive health and wellness products.
  • Clean-label trend driving serine-based supplement innovation.
  • Increased investments in clinical trials involving serine.
  • Strong distribution through retail pharmacies and e-commerce.

Japan Serine Amino Acids Market Analysis

Demand for serine amino acids in Japan is projected to grow at a CAGR of 8.9% between 2025 and 2035, fuelled by its advanced pharmaceutical industry and aging population.
  • High demand for cognitive support in elderly demographics.
  • Japan-based firms are leading serine-related R&D breakthroughs.
  • Integration of serine in functional beverages and foods.
  • Expanding export of amino acid-based formulations.

Leading Serine Amino Acid Manufacturers and Suppliers

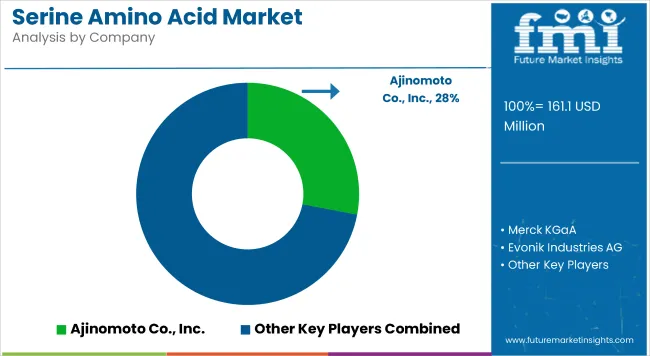
Serine Amino Acid Market Analysis By Company

The market features a moderately consolidated landscape, with key players such as Ajinomoto Co., Inc., Merck KGaA, and Evonik Industries AG holding significant market shares. These companies lead the market through strong R&D investments, proprietary fermentation technologies, and established distribution channels in pharmaceuticals, nutraceuticals, and functional foods.

Top suppliers are actively competing through strategies focused on biotechnology innovation, pricing optimization, capacity expansion, and global partnerships. Ajinomoto, for example, leverages its long-standing amino acid production expertise to cater to the rising demand for L-serine in cognitive health supplements. Merck KGaA emphasizes pharmaceutical-grade serine supply for use in neurological therapies.

Recent Serine Amino Acid Industry News

  • In June 2025, Ajinomoto Health & Nutrition North America opened a renovated Quality Control Laboratory to support growth in supplying active pharmaceutical ingredient (API) amino acids and blends globally. (Source: Ajinomoto)

Serine Amino Acids Market - Report Scope

Report Attributes Details
Current Total Market Size (2025) USD 161.1 million
Projected Market Size (2035) USD 323.1 million
CAGR (2025 to 2035) 7.2%
Base Year for Estimation 2024
Historical Period 2020 to 2024
Projections Period 2025 to 2035
Market Analysis Parameters Revenue in USD million / Volume (Metric Tons)
By Type L-Serine, D-Serine, and DL-Serine
By Application Dietary Supplements, Pharmaceutical, and Cosmetics
Regions Covered North America, Latin America, Western Europe, Eastern Europe, East Asia, South Asia & Pacific, Middle East & Africa
Countries Covered United States, Canada, United Kingdom, Germany, France, China, Japan, South Korea, Brazil, Australia
Key Players Ajinomoto Co., Inc., Merck KGaA, Evonik Industries AG, Thermo Fisher Scientific, Kyowa Hakko Bio Co., Ltd, Tokyo Chemical Industry Co., Ltd, Mitsui Chemicals, Bioven Ingredients, Lipotec S.A.U., Sichuan Tongsheng Amino Acid Co., Ltd
Additional Attributes Dollar sales by value, market share analysis by region, and country-wise analysis.

Key Segmentation

By Type:

  • L-Serine
  • D-Serine
  • DL-Serine

By Application:

  • Dietary Supplements
  • Pharmaceutical
  • Cosmetics

By Region:

  • North America
  • Latin America
  • East Asia
  • Western Europe
  • Eastern Europe
  • South Asia and Pacific
  • The Middle East and Africa

Table of Content

  1. Executive Summary
    • Global Market Outlook
    • Demand-side Trends
    • Supply-side Trends
    • Technology Roadmap Analysis
    • Analysis and Recommendations
  2. Market Overview
    • Market Coverage/Taxonomy
    • Market Definition/Scope/Limitations
  3. Market Background
    • Market Dynamics
      • Drivers
      • Restraints
      • Opportunity
      • Trends
    • Scenario Forecast
      • Demand in Optimistic Scenario
      • Demand in Likely Scenario
      • Demand in Conservative Scenario
    • Opportunity Map Analysis
    • Product Life Cycle Analysis
    • Supply Chain Analysis
      • Supply Side Participants and their Roles
        • Producers
        • Mid-Level Participants (Traders/ Agents/ Brokers)
        • Wholesalers and Distributors
      • Value Added and Value Created at Node in the Supply Chain
      • List of Raw Material Suppliers
      • List of Existing and Potential Buyer’s
    • Investment Feasibility Matrix
    • Value Chain Analysis
      • Profit Margin Analysis
      • Wholesalers and Distributors
      • Retailers
    • PESTLE and Porter’s Analysis
    • Regulatory Landscape
      • By Key Regions
      • By Key Countries
    • Regional Parent Market Outlook
    • Production and Consumption Statistics
    • Import and Export Statistics
  4. Global Market Analysis 2020 to 2024 and Forecast, 2025 to 2035
    • Historical Market Size Value (USD Million) & Volume (Metric Tons) Analysis, 2020 to 2024
    • Current and Future Market Size Value (USD Million) & Volume (Metric Tons) Projections, 2025 to 2035
      • Y-o-Y Growth Trend Analysis
      • Absolute $ Opportunity Analysis
  5. Global Market Pricing Analysis 2020 to 2024 and Forecast 2025 to 2035
  6. Global Market Analysis 2020 to 2024 and Forecast 2025 to 2035, By Type
    • Introduction/Key Findings
    • Historical Market Size Value (USD Million) & Volume (Metric Tons) Analysis By Type, 2020 to 2024
    • Current and Future Market Size Value (USD Million) & Volume (Metric Tons) Analysis and Forecast By Type, 2025 to 2035
      • L-Serine
      • D-Serine
      • DL-Serine
    • Y-o-Y Growth Trend Analysis By Type, 2020 to 2024
    • Absolute $ Opportunity Analysis By Type, 2025 to 2035
  7. Global Market Analysis 2020 to 2024 and Forecast 2025 to 2035, By Application
    • Introduction/Key Findings
    • Historical Market Size Value (USD Million) & Volume (Metric Tons) Analysis By Application, 2020 to 2024
    • Current and Future Market Size Value (USD Million) & Volume (Metric Tons) Analysis and Forecast By Application, 2025 to 2035
      • Dietary Supplements
      • Pharmaceutical
      • Cosmetics
    • Y-o-Y Growth Trend Analysis By Application, 2020 to 2024
    • Absolute $ Opportunity Analysis By Application, 2025 to 2035
  8. Global Market Analysis 2020 to 2024 and Forecast 2025 to 2035, By Region
    • Introduction
    • Historical Market Size Value (USD Million) & Volume (Metric Tons) Analysis By Region, 2020 to 2024
    • Current Market Size Value (USD Million) & Volume (Metric Tons) Analysis and Forecast By Region, 2025 to 2035
      • North America
      • Latin America
      • Western Europe
      • Eastern Europe
      • East Asia
      • South Asia & Pacific
      • Middle East and Africa
    • Market Attractiveness Analysis By Region
  9. North America Market Analysis 2020 to 2024 and Forecast 2025 to 2035, By Country
    • Historical Market Size Value (USD Million) & Volume (Metric Tons) Trend Analysis By Market Taxonomy, 2020 to 2024
    • Market Size Value (USD Million) & Volume (Metric Tons) Forecast By Market Taxonomy, 2025 to 2035
      • By Country
        • USA
        • Canada
        • Mexico
      • By Type
      • By Application
    • Market Attractiveness Analysis
      • By Country
      • By Type
      • By Application
    • Key Takeaways
  10. Latin America Market Analysis 2020 to 2024 and Forecast 2025 to 2035, By Country
    • Historical Market Size Value (USD Million) & Volume (Metric Tons) Trend Analysis By Market Taxonomy, 2020 to 2024
    • Market Size Value (USD Million) & Volume (Metric Tons) Forecast By Market Taxonomy, 2025 to 2035
      • By Country
        • Brazil
        • Argentina
        • Rest of LATAM
      • By Type
      • By Application
    • Market Attractiveness Analysis
      • By Country
      • By Type
      • By Application
    • Key Takeaways
  11. Western Europe Market Analysis 2020 to 2024 and Forecast 2025 to 2035, By Country
    • Historical Market Size Value (USD Million) & Volume (Metric Tons) Trend Analysis By Market Taxonomy, 2020 to 2024
    • Market Size Value (USD Million) & Volume (Metric Tons) Forecast By Market Taxonomy, 2025 to 2035
      • By Country
        • Germany
        • Italy
        • France
        • UK
        • Spain
        • BENELUX
        • Nordic
        • Rest of W.Europe
      • By Type
      • By Application
    • Market Attractiveness Analysis
      • By Country
      • By Type
      • By Application
    • Key Takeaways
  12. Eastern Europe Market Analysis 2020 to 2024 and Forecast 2025 to 2035, By Country
    • Historical Market Size Value (USD Million) & Volume (Metric Tons) Trend Analysis By Market Taxonomy, 2020 to 2024
    • Market Size Value (USD Million) & Volume (Metric Tons) Forecast By Market Taxonomy, 2025 to 2035
      • By Country
        • Russia
        • Hungary
        • Poland
        • Balkan & Baltics
        • Rest of E. Europe
      • By Type
      • By Application
    • Market Attractiveness Analysis
      • By Country
      • By Type
      • By Application
    • Key Takeaways
  13. East Asia Market Analysis 2020 to 2024 and Forecast 2025 to 2035, By Country
    • Historical Market Size Value (USD Million) & Volume (Metric Tons) Trend Analysis By Market Taxonomy, 2020 to 2024
    • Market Size Value (USD Million) & Volume (Metric Tons) Forecast By Market Taxonomy, 2025 to 2035
      • By Country
        • China
        • Japan
        • South Korea
      • By Type
      • By Application
    • Market Attractiveness Analysis
      • By Country
      • By Type
      • By Application
    • Key Takeaways
  14. South Asia & Pacific Market Analysis 2020 to 2024 and Forecast 2025 to 2035, By Country
    • Historical Market Size Value (USD Million) & Volume (Metric Tons) Trend Analysis By Market Taxonomy, 2020 to 2024
    • Market Size Value (USD Million) & Volume (Metric Tons) Forecast By Market Taxonomy, 2025 to 2035
      • By Country
        • India
        • Australia & New Zealand
        • ASEAN
        • Rest of SAP
      • By Type
      • By Application
    • Market Attractiveness Analysis
      • By Country
      • By Type
      • By Application
    • Key Takeaways
  15. Middle East and Africa Market Analysis 2020 to 2024 and Forecast 2025 to 2035, By Country
    • Historical Market Size Value (USD Million) & Volume (Metric Tons) Trend Analysis By Market Taxonomy, 2020 to 2024
    • Market Size Value (USD Million) & Volume (Metric Tons) Forecast By Market Taxonomy, 2025 to 2035
      • By Country
        • GCC Countries
        • Northern Africa
        • South Africa
        • Turkiye
        • Rest of MEA
      • By Type
      • By Application
    • Market Attractiveness Analysis
      • By Country
      • By Type
      • By Application
    • Key Takeaways
  16. Key Countries Market Analysis
    • USA
      • Pricing Analysis
      • Market Share Analysis, 2024
        • By Type
        • By Application
    • Canada
      • Pricing Analysis
      • Market Share Analysis, 2024
        • By Type
        • By Application
    • Brazil
      • Pricing Analysis
      • Market Share Analysis, 2024
        • By Type
        • By Application
    • Mexico
      • Pricing Analysis
      • Market Share Analysis, 2024
        • By Type
        • By Application
    • Argentina
      • Pricing Analysis
      • Market Share Analysis, 2024
        • By Type
        • By Application
  17. Market Structure Analysis
    • Competition Dashboard
    • Competition Benchmarking
    • Market Share Analysis of Top Players
      • By Regional
      • By Type
      • By Application
  18. Competition Analysis
    • Competition Deep Dive
      • Tokyo Chemical Industry Co., Ltd
        • Overview
        • Product Portfolio
        • Profitability by Market Segments (Product/Age /Sales Channel/Region)
        • Sales Footprint
        • Strategy Overview
          • Marketing Strategy
          • Product Strategy
          • Channel Strategy
      • Thermo Fisher Scientific India Pvt. Ltd
        • Overview
        • Product Portfolio
        • Profitability by Market Segments (Product/Age /Sales Channel/Region)
        • Sales Footprint
        • Strategy Overview
          • Marketing Strategy
          • Product Strategy
          • Channel Strategy
      • Merck KGaA
        • Overview
        • Product Portfolio
        • Profitability by Market Segments (Product/Age /Sales Channel/Region)
        • Sales Footprint
        • Strategy Overview
          • Marketing Strategy
          • Product Strategy
          • Channel Strategy
      • Kyowa Hakko Bio Co., Ltd
        • Overview
        • Product Portfolio
        • Profitability by Market Segments (Product/Age /Sales Channel/Region)
        • Sales Footprint
        • Strategy Overview
          • Marketing Strategy
          • Product Strategy
          • Channel Strategy
      • Evonik Industries AG
        • Overview
        • Product Portfolio
        • Profitability by Market Segments (Product/Age /Sales Channel/Region)
        • Sales Footprint
        • Strategy Overview
          • Marketing Strategy
          • Product Strategy
          • Channel Strategy
      • Ajinomoto Co., Inc.
        • Overview
        • Product Portfolio
        • Profitability by Market Segments (Product/Age /Sales Channel/Region)
        • Sales Footprint
        • Strategy Overview
          • Marketing Strategy
          • Product Strategy
          • Channel Strategy
      • Sichuan Tongsheng Amino acid Co., Ltd
        • Overview
        • Product Portfolio
        • Profitability by Market Segments (Product/Age /Sales Channel/Region)
        • Sales Footprint
        • Strategy Overview
          • Marketing Strategy
          • Product Strategy
          • Channel Strategy
      • Lipotec S.A.U.
        • Overview
        • Product Portfolio
        • Profitability by Market Segments (Product/Age /Sales Channel/Region)
        • Sales Footprint
        • Strategy Overview
          • Marketing Strategy
          • Product Strategy
          • Channel Strategy
      • Bioven Ingredients
        • Overview
        • Product Portfolio
        • Profitability by Market Segments (Product/Age /Sales Channel/Region)
        • Sales Footprint
        • Strategy Overview
          • Marketing Strategy
          • Product Strategy
          • Channel Strategy
      • Mitsui Chemicals
        • Overview
        • Product Portfolio
        • Profitability by Market Segments (Product/Age /Sales Channel/Region)
        • Sales Footprint
        • Strategy Overview
          • Marketing Strategy
          • Product Strategy
          • Channel Strategy
  19. Assumptions & Acronyms Used
  20. Research Methodology

List of Tables

  • Table 1: Global Market Value (USD Million) Forecast by Region, 2020-2035
  • Table 2: Global Market Volume (Metric Tons) Forecast by Region, 2020-2035
  • Table 3: Global Market Value (USD Million) Forecast by Type, 2020-2035
  • Table 4: Global Market Volume (Metric Tons) Forecast by Type, 2020-2035
  • Table 5: Global Market Value (USD Million) Forecast by Application, 2020-2035
  • Table 6: Global Market Volume (Metric Tons) Forecast by Application, 2020-2035
  • Table 7: North America Market Value (USD Million) Forecast by Country, 2020-2035
  • Table 8: North America Market Volume (Metric Tons) Forecast by Country, 2020-2035
  • Table 9: North America Market Value (USD Million) Forecast by Type, 2020-2035
  • Table 10: North America Market Volume (Metric Tons) Forecast by Type, 2020-2035
  • Table 11: North America Market Value (USD Million) Forecast by Application, 2020-2035
  • Table 12: North America Market Volume (Metric Tons) Forecast by Application, 2020-2035
  • Table 13: Latin America Market Value (USD Million) Forecast by Country, 2020-2035
  • Table 14: Latin America Market Volume (Metric Tons) Forecast by Country, 2020-2035
  • Table 15: Latin America Market Value (USD Million) Forecast by Type, 2020-2035
  • Table 16: Latin America Market Volume (Metric Tons) Forecast by Type, 2020-2035
  • Table 17: Latin America Market Value (USD Million) Forecast by Application, 2020-2035
  • Table 18: Latin America Market Volume (Metric Tons) Forecast by Application, 2020-2035
  • Table 19: Western Europe Market Value (USD Million) Forecast by Country, 2020-2035
  • Table 20: Western Europe Market Volume (Metric Tons) Forecast by Country, 2020-2035
  • Table 21: Western Europe Market Value (USD Million) Forecast by Type, 2020-2035
  • Table 22: Western Europe Market Volume (Metric Tons) Forecast by Type, 2020-2035
  • Table 23: Western Europe Market Value (USD Million) Forecast by Application, 2020-2035
  • Table 24: Western Europe Market Volume (Metric Tons) Forecast by Application, 2020-2035
  • Table 25: Eastern Europe Market Value (USD Million) Forecast by Country, 2020-2035
  • Table 26: Eastern Europe Market Volume (Metric Tons) Forecast by Country, 2020-2035
  • Table 27: Eastern Europe Market Value (USD Million) Forecast by Type, 2020-2035
  • Table 28: Eastern Europe Market Volume (Metric Tons) Forecast by Type, 2020-2035
  • Table 29: Eastern Europe Market Value (USD Million) Forecast by Application, 2020-2035
  • Table 30: Eastern Europe Market Volume (Metric Tons) Forecast by Application, 2020-2035
  • Table 31: East Asia Market Value (USD Million) Forecast by Country, 2020-2035
  • Table 32: East Asia Market Volume (Metric Tons) Forecast by Country, 2020-2035
  • Table 33: East Asia Market Value (USD Million) Forecast by Type, 2020-2035
  • Table 34: East Asia Market Volume (Metric Tons) Forecast by Type, 2020-2035
  • Table 35: East Asia Market Value (USD Million) Forecast by Application, 2020-2035
  • Table 36: East Asia Market Volume (Metric Tons) Forecast by Application, 2020-2035
  • Table 37: South Asia & Pacific Market Value (USD Million) Forecast by Country, 2020-2035
  • Table 38: South Asia & Pacific Market Volume (Metric Tons) Forecast by Country, 2020-2035
  • Table 39: South Asia & Pacific Market Value (USD Million) Forecast by Type, 2020-2035
  • Table 40: South Asia & Pacific Market Volume (Metric Tons) Forecast by Type, 2020-2035
  • Table 41: South Asia & Pacific Market Value (USD Million) Forecast by Application, 2020-2035
  • Table 42: South Asia & Pacific Market Volume (Metric Tons) Forecast by Application, 2020-2035
  • Table 43: Middle East and Africa Market Value (USD Million) Forecast by Country, 2020-2035
  • Table 44: Middle East and Africa Market Volume (Metric Tons) Forecast by Country, 2020-2035
  • Table 45: Middle East and Africa Market Value (USD Million) Forecast by Type, 2020-2035
  • Table 46: Middle East and Africa Market Volume (Metric Tons) Forecast by Type, 2020-2035
  • Table 47: Middle East and Africa Market Value (USD Million) Forecast by Application, 2020-2035
  • Table 48: Middle East and Africa Market Volume (Metric Tons) Forecast by Application, 2020-2035

List of Figures

  • Figure 1: Global Market Volume (Metric Tons) Forecast 2020-2035
  • Figure 2: Global Market Pricing Analysis
  • Figure 3: Global Market Value (USD Million) Forecast 2020-2035
  • Figure 4: Global Market Value Share and BPS Analysis by Type, 2025 and 2035
  • Figure 5: Global Market Y-o-Y Growth Comparison by Type, 2025-2035
  • Figure 6: Global Market Attractiveness Analysis by Type
  • Figure 7: Global Market Value Share and BPS Analysis by Application, 2025 and 2035
  • Figure 8: Global Market Y-o-Y Growth Comparison by Application, 2025-2035
  • Figure 9: Global Market Attractiveness Analysis by Application
  • Figure 10: Global Market Value (USD Million) Share and BPS Analysis by Region, 2025 and 2035
  • Figure 11: Global Market Y-o-Y Growth Comparison by Region, 2025-2035
  • Figure 12: Global Market Attractiveness Analysis by Region
  • Figure 13: North America Market Incremental $ Opportunity, 2025-2035
  • Figure 14: Latin America Market Incremental $ Opportunity, 2025-2035
  • Figure 15: Western Europe Market Incremental $ Opportunity, 2025-2035
  • Figure 16: Eastern Europe Market Incremental $ Opportunity, 2025-2035
  • Figure 17: East Asia Market Incremental $ Opportunity, 2025-2035
  • Figure 18: South Asia & Pacific Market Incremental $ Opportunity, 2025-2035
  • Figure 19: Middle East and Africa Market Incremental $ Opportunity, 2025-2035
  • Figure 20: North America Market Value Share and BPS Analysis by Country, 2025 and 2035
  • Figure 21: North America Market Value Share and BPS Analysis by Type, 2025 and 2035
  • Figure 22: North America Market Y-o-Y Growth Comparison by Type, 2025-2035
  • Figure 23: North America Market Attractiveness Analysis by Type
  • Figure 24: North America Market Value Share and BPS Analysis by Application, 2025 and 2035
  • Figure 25: North America Market Y-o-Y Growth Comparison by Application, 2025-2035
  • Figure 26: North America Market Attractiveness Analysis by Application
  • Figure 27: Latin America Market Value Share and BPS Analysis by Country, 2025 and 2035
  • Figure 28: Latin America Market Value Share and BPS Analysis by Type, 2025 and 2035
  • Figure 29: Latin America Market Y-o-Y Growth Comparison by Type, 2025-2035
  • Figure 30: Latin America Market Attractiveness Analysis by Type
  • Figure 31: Latin America Market Value Share and BPS Analysis by Application, 2025 and 2035
  • Figure 32: Latin America Market Y-o-Y Growth Comparison by Application, 2025-2035
  • Figure 33: Latin America Market Attractiveness Analysis by Application
  • Figure 34: Western Europe Market Value Share and BPS Analysis by Country, 2025 and 2035
  • Figure 35: Western Europe Market Value Share and BPS Analysis by Type, 2025 and 2035
  • Figure 36: Western Europe Market Y-o-Y Growth Comparison by Type, 2025-2035
  • Figure 37: Western Europe Market Attractiveness Analysis by Type
  • Figure 38: Western Europe Market Value Share and BPS Analysis by Application, 2025 and 2035
  • Figure 39: Western Europe Market Y-o-Y Growth Comparison by Application, 2025-2035
  • Figure 40: Western Europe Market Attractiveness Analysis by Application
  • Figure 41: Eastern Europe Market Value Share and BPS Analysis by Country, 2025 and 2035
  • Figure 42: Eastern Europe Market Value Share and BPS Analysis by Type, 2025 and 2035
  • Figure 43: Eastern Europe Market Y-o-Y Growth Comparison by Type, 2025-2035
  • Figure 44: Eastern Europe Market Attractiveness Analysis by Type
  • Figure 45: Eastern Europe Market Value Share and BPS Analysis by Application, 2025 and 2035
  • Figure 46: Eastern Europe Market Y-o-Y Growth Comparison by Application, 2025-2035
  • Figure 47: Eastern Europe Market Attractiveness Analysis by Application
  • Figure 48: East Asia Market Value Share and BPS Analysis by Country, 2025 and 2035
  • Figure 49: East Asia Market Value Share and BPS Analysis by Type, 2025 and 2035
  • Figure 50: East Asia Market Y-o-Y Growth Comparison by Type, 2025-2035
  • Figure 51: East Asia Market Attractiveness Analysis by Type
  • Figure 52: East Asia Market Value Share and BPS Analysis by Application, 2025 and 2035
  • Figure 53: East Asia Market Y-o-Y Growth Comparison by Application, 2025-2035
  • Figure 54: East Asia Market Attractiveness Analysis by Application
  • Figure 55: South Asia & Pacific Market Value Share and BPS Analysis by Country, 2025 and 2035
  • Figure 56: South Asia & Pacific Market Value Share and BPS Analysis by Type, 2025 and 2035
  • Figure 57: South Asia & Pacific Market Y-o-Y Growth Comparison by Type, 2025-2035
  • Figure 58: South Asia & Pacific Market Attractiveness Analysis by Type
  • Figure 59: South Asia & Pacific Market Value Share and BPS Analysis by Application, 2025 and 2035
  • Figure 60: South Asia & Pacific Market Y-o-Y Growth Comparison by Application, 2025-2035
  • Figure 61: South Asia & Pacific Market Attractiveness Analysis by Application
  • Figure 62: Middle East and Africa Market Value Share and BPS Analysis by Country, 2025 and 2035
  • Figure 63: Middle East and Africa Market Value Share and BPS Analysis by Type, 2025 and 2035
  • Figure 64: Middle East and Africa Market Y-o-Y Growth Comparison by Type, 2025-2035
  • Figure 65: Middle East and Africa Market Attractiveness Analysis by Type
  • Figure 66: Middle East and Africa Market Value Share and BPS Analysis by Application, 2025 and 2035
  • Figure 67: Middle East and Africa Market Y-o-Y Growth Comparison by Application, 2025-2035
  • Figure 68: Middle East and Africa Market Attractiveness Analysis by Application
  • Figure 69: Global Market - Tier Structure Analysis
  • Figure 70: Global Market - Company Share Analysis

Frequently Asked Questions

What is the size of the serine amino acid market in 2025?

The market is expected to be valued at USD 161.1 million in 2025.

What is the expected value of the serine amino acid market by 2035?

It is projected to reach USD 323.1 million by 2035.

Which type segment holds the largest share in this serine amino acid market?

L-Serine leads the market with a 41% share in 2025.

Which application segment is most lucrative in the serine amino acid market?

Dietary supplements dominate with a 38% market share in 2025.

Which country will witness the fastest growth 2035 in the serine amino acid market?

Japan is forecasted to grow at the highest CAGR of 8.9%.

Explore Similar Insights

Future Market Insights

Serine Amino Acid Market