Essential Fatty Acids Market Size and Share Forecast Outlook 2025 to 2035

The global essential fatty acids market is valued at USD 6.5 billion in 2025 and is slated to reach USD 16.7 billion by 2035, reflecting a CAGR of 9.9%.
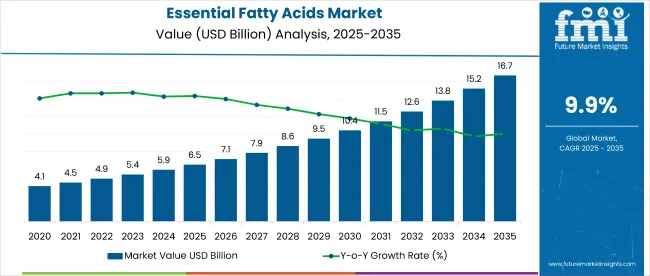
Quick Stats for Essential Fatty Acids Market

  • Market Value (2025): USD 6.5 billion
  • Forecast Value (2035): USD 16.7 billion
  • Forecast CAGR: 9.9%
  • Application Leader in 2025: Dietary Supplements (74.5% Market Share)
  • Top Source Segment: Marine(68%Market Share in 2025)
  • Key Growth Region: Western Europe (UK is the fastest-growing market with 9.2% CAGR)

Essential Fatty Acids Market

Metric Value
Market Size (2025) USD 6.5 billion
Market Size (2035) USD 16.7 billion
CAGR (2025 to 2035) 9.9%

Factors contributing to this growth include rising health awareness, increased consumption of dietary supplements, and the growing popularity of plant-based and marine omega-3 products. In addition, advancements in extraction technologies and clean-label product development are encouraging innovation across functional food and nutraceutical sectors.

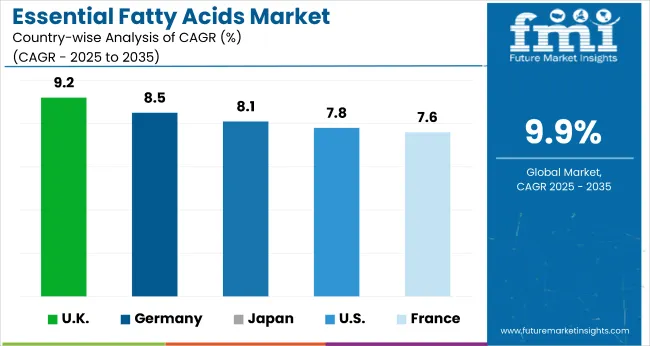
The UK is forecasted to grow at the highest CAGR of 9.2% from 2025 to 2035, driven by demand for plant-based diets and mental wellness supplements. Germany follows with an 8.5% CAGR, supported by heart health awareness and preference for sustainable marine oils.

Japan is projected to grow at 8.1%, led by an aging population and high trust in omega-rich seafood. In 2025, dietary supplements will lead the application category with a 74.5% market share, while marine will dominate the source segment with a 68% share in 2025.

Recent innovations in the essential fatty acids market include algae-based omega-3 supplements, solvent-free extraction methods, and cetoleic acid-enriched formulations that improve EPA and DHA conversion. Companies are introducing sugar-free omega-3 gummies and microencapsulated delivery systems for better taste and bioavailability. Regulatory bodies like the USA FDA and EFSA have approved health claims for omega-3 benefits related to heart and brain health.

As of 2025, the market holds a significant yet niche share within its parent industries. It accounts for approximately 12% of the global nutraceuticals market, driven by its role in preventive healthcare. Within the dietary supplements segment, it represents nearly 15%, largely due to widespread omega-3 usage.

In the functional food and beverages sector, essential fatty acids contribute around 8%, mainly through fortified products. The market holds a 6% share in the pharmaceutical ingredients space, while in animal nutrition, its share is estimated at 10%, with growing inclusion in pet and livestock diets for gut and immunity support.

Analyzing Essential Fatty Acids Market by Top Investment Segments

The essential fatty acids market segments include product type, application, source, form, and region. By product type, the market covers omega-3 fatty acids (ALA, DHA, EPA), omega-6 fatty acids (LA, ARA), omega-7 fatty acids, and omega-9 fatty acids. By application, the market includes dietary supplements, infant formula, pharmaceuticals, food and beverages, animal food and feed, and cosmetics.

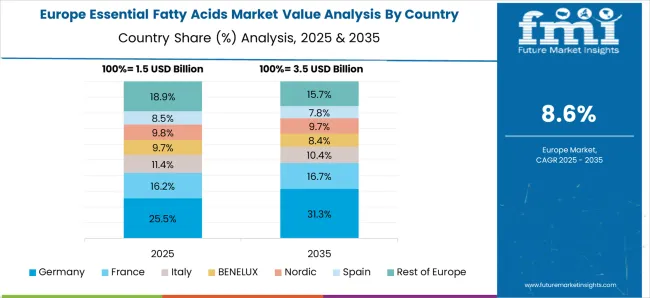
By source, the market consists of marine (fish oil, krill oil, algal oil, and fungal oil), plant-based (chia seed oil, flaxseed oil, and others such as hemp seed oil, perilla oil, and canola oil), and dairy products. By form, the market covers oil, syrup, powder, and others (capsules, soft gels, gummies). The regional segment includes North America, Latin America, Western Europe, Eastern Europe, South Asia and Pacific, East Asia, and the Middle East & Africa.
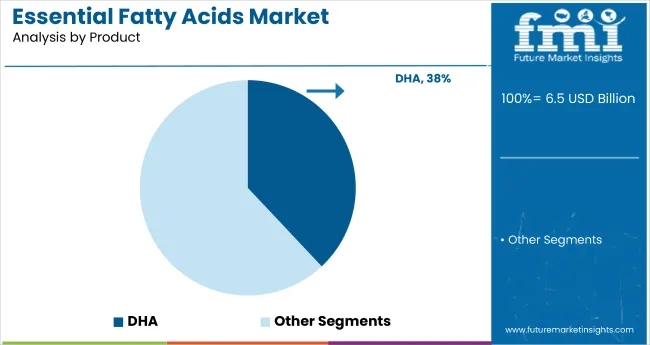
DHA to Lead the Omega-3 Product Segment with 38% Market Share in 2025

Essential Fatty Acids Market Analysis By Product

DHA (Docosahexaenoic Acid) is projected to be the most lucrative segment, with a 38% market share within the omega-3 fatty acid category in 2025.
  • Its rising inclusion in prenatal and pediatric nutrition products has significantly boosted demand. Additionally, growing awareness of neurological wellness among aging populations is driving DHA adoption in adult supplements.
  • As consumers increasingly prioritize preventive healthcare, DHA continues to outperform other essential fatty acids, securing a leading position in the product hierarchy of the global market.

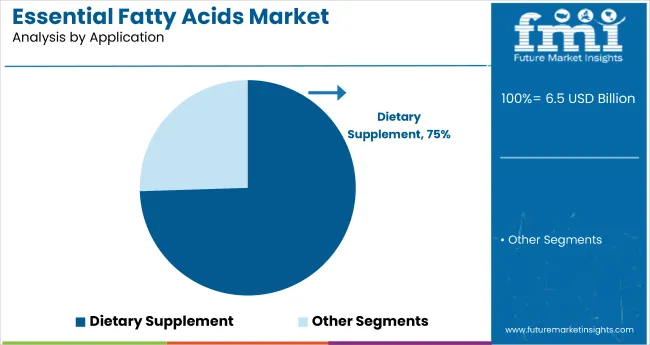
Dietary Supplements to Dominate the Application Segment with 74.5% Market Share in 2025

Essential Fatty Acids Market Analysis By Application

Dietary supplements are projected to be the most lucrative application segment in the essential fatty acids market, capturing an estimated 74.5% market share.
  • Supplements enriched with DHA and EPA are widely used for heart, brain, and eye health. The convenience of soft gels, gummies, and capsules has further supported uptake.
  • Additionally, expanding distribution through online retail and pharmacies is enabling wider access to essential fatty acid supplements across both developed and emerging regions.

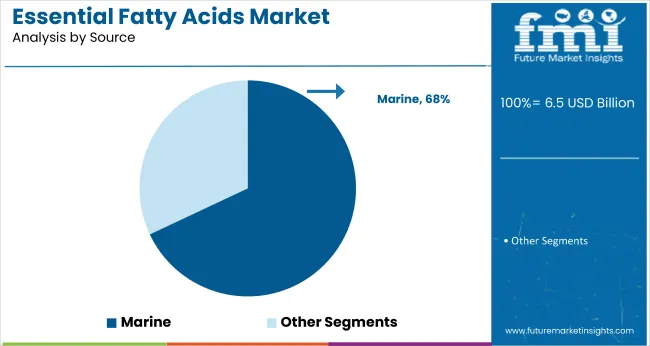
Marine to Lead the Source Segment with 68% Market Share in 2025

Essential Fatty Acids Market Analysis By Source

Marine-based sources are expected to capture 68% of the essential fatty acids market, accounting for the largest share due to their high concentrations of EPA and DHA.
  • Fish oil continues to be favored for its superior bioavailability and heart health benefits.
  • Fish oil remains the top choice globally, especially in North America, Europe, and East Asia, despite the rise of plant-based alternatives.

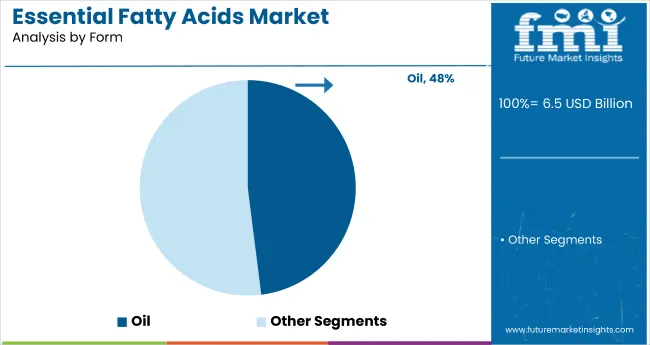
Oil-Based Formulations to Lead the Form Segment with 48% Market Share in 2025

Essential Fatty Acids Market Analysis By Form

Oil-based formulations are projected to lead the essential fatty acids market, accounting for an estimated 48% share.

  • The demand for oil-based essential fatty acids remains strong among consumers seeking heart, brain, and eye health support.
  • Despite the emergence of powdered and syrup forms, oil continues to dominate due to its proven stability, efficacy, and broad application across both clinical and consumer health settings.

Leading Essential Fatty Acids Dynamics

The market is expanding steadily, fueled by growing awareness of preventive health, rising demand for omega-3 and omega-6 supplements, and ongoing innovations in marine- and plant-based formulations.

Recent Trends in the Essential Fatty Acids Market

  • Rising demand for plant-based omega-3s from algae and flaxseed.
  • Increasing use of microencapsulation to improve bioavailability and shelf life.
  • Surge in omega-3 gummy formats catering to pediatric and geriatric consumers.
  • Regulatory support for heart and brain health claims is driving supplement sales.

Key Challenges in the Essential Fatty Acids Market
  • Fluctuations in fish oil supply due to overfishing and sustainability concerns.
  • High production costs of algae-derived omega-3 limit mass adoption.
  • Limited consumer awareness in emerging economies regarding fatty acid benefits.
  • Complex regulatory compliance across multiple regions and applications.

Analyzing Top Countries Producing and Consuming Essential Fatty Acids Products

Country Wise Analysis Of Essential Fatty Acids Market

The UK is projected to lead the market among the listed countries, registering the highest CAGR of 9.2% from 2025 to 2035, driven by demand for plant-based and clean-label products. Germany follows with an 8.5% CAGR, fueled by heart health awareness and functional nutrition trends.

Japan ranks third with 8.1%, supported by its aging population and preference for omega-rich seafood. The USA market is set to grow at 7.8%, driven by supplement demand and FDA support. France records the slowest growth at 7.6%, with gains linked to maternal health and advancements in clinical nutrition.

The report covers in-depth analysis of 40+ countries, five top-performing OECD countries are highlighted below. 
USA Essential Fatty Acids Products Analysis

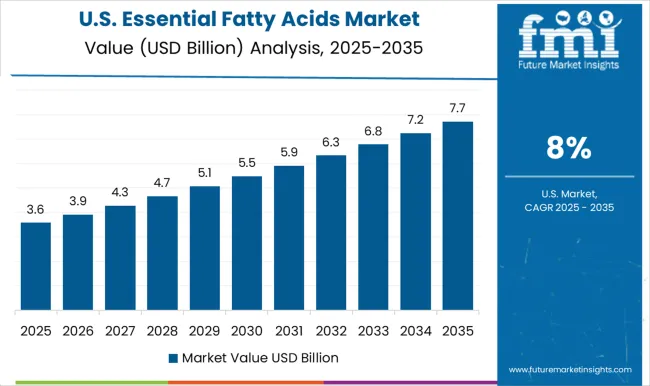
The USA essential fatty acids products revenue is projected to grow at a CAGR of 7.8% from 2025 to 2035, driven by rising health consciousness and the widespread use of dietary supplements.

  • Growing demand for omega-3 supplements among aging populations.
  • Strong market for infant nutrition fortified with DHA.
  • High adoption of functional foods enriched with fatty acids.
  • FDA support for health claims driving consumer trust.

Essential Fatty Acids Products Demand Analysis in the UK

The UK essential fatty acids products demand is expected to expand at a CAGR of 9.2% from 2025 to 2035, supported by the growing popularity of plant-based diets and rising consumer focus on mental wellness.
  • Increased use of flaxseed and algal oil in vegan formulations.
  • Steady demand for clean-label nutritional supplements.
  • High product penetration through retail pharmacies and e-commerce.
  • Mental health and cognitive performance products are gaining traction.

Germany Essential Fatty Acids Products Analysis

Sales of essential fatty acids products in Germany are projected to grow at a CAGR of 8.5% from 2025 to 2035, driven by consumer interest in heart health and the rising use of functional nutrition.

  • Strong demand for omega-3-enriched food products.
  • Focus on preventive health fuels dietary supplement adoption.
  • Rising imports of sustainable marine-based oils(e.g., fish oil, krill oil).
  • Regulatory efficiency ensures product quality and safety.

France Essential Fatty Acids Products Analysis

Sales of essential fatty acids products in France are expected to witness a CAGR of 7.6% from 2025 to 2035, propelled by advancements in clinical nutrition and a growing focus on maternal and infant health.
  • Prenatal and pediatric supplements are driving DHA demand.
  • High consumption of fortified dairy products with EFAs.
  • Growing awareness of the anti-inflammatory benefits of omega-3.
  • Supportive policies promoting balanced nutritional intake.

Essential Fatty Acids Products Demand Analysis in Japan

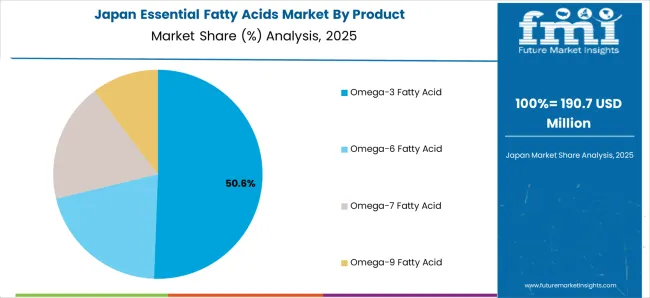
The Japan essential fatty acids products revenue is set to grow at a CAGR of 8.1% from 2025 to 2035, supported by an aging population and traditional preferences for omega-rich seafood.
  • High consumer trust in fish-derived omega-3 ingredients.
  • Rising use of EFAs in skincare and beauty supplements.
  • Popularity of functional beverages enriched with DHA.
  • Government initiatives supporting healthy aging products.

Leading Essential Fatty Acids Manufacturers and Suppliers

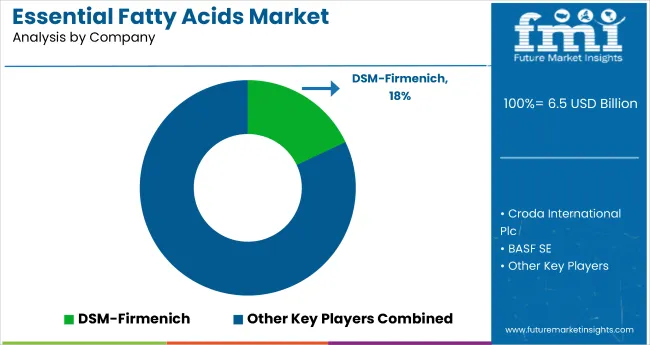
Essential Fatty Acids Market Analysis By Company

The market is moderately fragmented, with a mix of tier-one multinationals and several specialized marine and plant-based oil producers. Companies like BASF SE, DSM, and Aker Bio Marine dominate in terms of innovation, global reach, and ingredient portfolios, while regional firms such as sea Dragon Ltd. and Lysi hf. Serve niche markets with specialized marine oils.

Leading companies are actively competing through pricing optimization, R&D investment, product differentiation, and sustainability-driven partnerships. Innovation in solvent-free extraction, algae-based DHA production, and clinical-grade omega-3 formulations have emerged as a core strategy.

Essential Fatty Acids Report Scope

Report Attributes Details
Current Total Market Size (2025) USD 6.5 billion
Projected Market Size (2035) USD 16.7 billion
CAGR (2025 to 2035) 9.9%
Base Year for Estimation 2024
Historical Period 2020 to 2024
Projections Period 2025 to 2035
Market Analysis Parameters Revenue in USD billion/Volume in Metric Tons
By Product Type Omega-3 (ALA, DHA, EPA), Omega-6 (LA, ARA), Omega-7 Fatty Acid, Omega-9 Fatty Acid
By Application Dietary Supplement, Infant Formula, Pharmaceutical, Food & Beverages, Animal Food and Feed, and Cosmetics
By Source Marine (Fish Oil, Krill Oil, Algal and Fungus Oil), Plant (Flax Seed Oil, Chia Seed Oil, Others such as Hemp Seed Oil, Evening Primrose Oil, Perilla Seed Oil, and Soybean Oil), Dairy
By Form Oil, Syrup, Powder, Others (Softgel Capsules, Gummies, Emulsions, and Spray/Drops)
Regions Covered North America, Latin America, Western Europe, Eastern Europe, East Asia, South Asia & Pacific, Middle East & Africa
Countries Covered United States, Canada, United Kingdom, Germany, France, China, Japan, South Korea, Brazil, Australia
Key Players ASF SE, FMC Corporation, The Dow Chemical Company, Koninklijke DSM NV, Enzymotec Ltd., Croda International Plc, Omega Protein Corporation, Aker BioMarine AS, Polaris Nutritional Lipids, Cargill Inc., Arista Industries, Nutrifynn Caps Inc., Sea Dragon Ltd., Lysi hf., GC Rieber Oils AS, Bizen Chemical Co., LTD, Maruha Nichiro Corporation, Olvea Fish Oils, Arctic Nutrition AS, and Golden Omega.
Additional Attributes Dollar sales by value, market share analysis by region, and country-wise analysis.

Key Segments

By Product:

  • Omega-3 Fatty Acid
    • ALA
    • DHA
    • EPA
  • Omega-6 Fatty Acid
    • LA
    • ARA
  • Omega-7 Fatty Acid
  • Omega-9 Fatty Acid

By Application:

  • Dietary Supplement
  • Infant Formula
  • Pharmaceutical
  • Food and Beverages
  • Animal Food and Feed
  • Cosmetics

By Source:

  • Marine
    • Algal and Fungus Oil
    • Fish Oil
    • Krill Oil
  • Plant
    • Chia Seed Oil
    • Flax Seed Oil
    • Others
  • Dairy Products

By Form:

  • Oil
  • Syrup
  • Powder
  • Others

By Region:

  • North America
  • Latin America
  • Europe
  • East Asia
  • South Asia
  • Oceania
  • Middle East & Africa (MEA)

Table of Content

  1. Executive Summary
    • Global Market Outlook
    • Demand-side Trends
    • Supply-side Trends
    • Technology Roadmap Analysis
    • Analysis and Recommendations
  2. Market Overview
    • Market Coverage/Taxonomy
    • Market Definition/Scope/Limitations
  3. Market Background
    • Market Dynamics
      • Drivers
      • Restraints
      • Opportunity
      • Trends
    • Scenario Forecast
      • Demand in Optimistic Scenario
      • Demand in Likely Scenario
      • Demand in Conservative Scenario
    • Opportunity Map Analysis
    • Product Life Cycle Analysis
    • Supply Chain Analysis
      • Supply Side Participants and their Roles
        • Producers
        • Mid-Level Participants (Traders/ Agents/ Brokers)
        • Wholesalers and Distributors
      • Value Added and Value Created at Node in the Supply Chain
      • List of Raw Material Suppliers
      • List of Existing and Potential Buyer’s
    • Investment Feasibility Matrix
    • Value Chain Analysis
      • Profit Margin Analysis
      • Wholesalers and Distributors
      • Retailers
    • PESTLE and Porter’s Analysis
    • Regulatory Landscape
      • By Key Regions
      • By Key Countries
    • Regional Parent Market Outlook
    • Production and Consumption Statistics
    • Import and Export Statistics
  4. Global Market Analysis 2020 to 2024 and Forecast, 2025 to 2035
    • Historical Market Size Value (USD Billion) & Volume (Metric Tons) Analysis, 2020 to 2024
    • Current and Future Market Size Value (USD Billion) & Volume (Metric Tons) Projections, 2025 to 2035
      • Y-o-Y Growth Trend Analysis
      • Absolute $ Opportunity Analysis
  5. Global Market Pricing Analysis 2020 to 2024 and Forecast 2025 to 2035
  6. Global Market Analysis 2020 to 2024 and Forecast 2025 to 2035, By Product
    • Introduction/Key Findings
    • Historical Market Size Value (USD Billion) & Volume (Metric Tons) Analysis By Product, 2020 to 2024
    • Current and Future Market Size Value (USD Billion) & Volume (Metric Tons) Analysis and Forecast By Product, 2025 to 2035
      • Omega-3 Fatty Acid
        • ALA
        • DHA
        • EPA
      • Omega-6 Fatty Acid
        • LA
        • ARA
      • Omega-7 Fatty Acid
      • Omega-9 Fatty Acid
    • Y-o-Y Growth Trend Analysis By Product, 2020 to 2024
    • Absolute $ Opportunity Analysis By Product, 2025 to 2035
  7. Global Market Analysis 2020 to 2024 and Forecast 2025 to 2035, By Application
    • Introduction/Key Findings
    • Historical Market Size Value (USD Billion) & Volume (Metric Tons) Analysis By Application, 2020 to 2024
    • Current and Future Market Size Value (USD Billion) & Volume (Metric Tons) Analysis and Forecast By Application, 2025 to 2035
      • Dietary Supplement
      • Infant Formula
      • Pharmaceutical
      • Food and Beverages
      • Animal Food and Feed
      • Cosmetics
    • Y-o-Y Growth Trend Analysis By Application, 2020 to 2024
    • Absolute $ Opportunity Analysis By Application, 2025 to 2035
  8. Global Market Analysis 2020 to 2024 and Forecast 2025 to 2035, By Source
    • Introduction/Key Findings
    • Historical Market Size Value (USD Billion) & Volume (Metric Tons) Analysis By Source, 2020 to 2024
    • Current and Future Market Size Value (USD Billion) & Volume (Metric Tons) Analysis and Forecast By Source, 2025 to 2035
      • Marine
        • Algal and Fungus Oil
        • Fish Oil
        • Krill Oil
      • Plant
        • Chia Seed Oil
        • Flax Seed Oil
        • Others (Hemp Seed Oil, Evening Primrose Oil, Perilla Seed Oil, and Soybean Oil)
      • Dairy Products
    • Y-o-Y Growth Trend Analysis By Source, 2020 to 2024
    • Absolute $ Opportunity Analysis By Source, 2025 to 2035
  9. Global Market Analysis 2020 to 2024 and Forecast 2025 to 2035, By Form
    • Introduction/Key Findings
    • Historical Market Size Value (USD Billion) & Volume (Metric Tons) Analysis By Form, 2020 to 2024
    • Current and Future Market Size Value (USD Billion) & Volume (Metric Tons) Analysis and Forecast By Form, 2025 to 2035
      • Oil
      • Syrup
      • Powder
      • Others
        • Softgel Capsules
        • Gummies
        • Emulsions
        • Spray/Drops
    • Y-o-Y Growth Trend Analysis By Form, 2020 to 2024
    • Absolute $ Opportunity Analysis By Form, 2025 to 2035
  10. Global Market Analysis 2020 to 2024 and Forecast 2025 to 2035, By Region
    • Introduction
    • Historical Market Size Value (USD Billion) & Volume (Metric Tons) Analysis By Region, 2020 to 2024
    • Current Market Size Value (USD Billion) & Volume (Metric Tons) Analysis and Forecast By Region, 2025 to 2035
      • North America
      • Latin America
      • Western Europe
      • Eastern Europe
      • East Asia
      • South Asia & Pacific
      • Middle East and Africa
    • Market Attractiveness Analysis By Region
  11. North America Market Analysis 2020 to 2024 and Forecast 2025 to 2035, By Country
    • Historical Market Size Value (USD Billion) & Volume (Metric Tons) Trend Analysis By Market Taxonomy, 2020 to 2024
    • Market Size Value (USD Billion) & Volume (Metric Tons) Forecast By Market Taxonomy, 2025 to 2035
      • By Country
        • USA
        • Canada
        • Mexico
      • By Product
      • By Application
      • By Source
      • By Form
    • Market Attractiveness Analysis
      • By Country
      • By Product
      • By Application
      • By Source
      • By Form
    • Key Takeaways
  12. Latin America Market Analysis 2020 to 2024 and Forecast 2025 to 2035, By Country
    • Historical Market Size Value (USD Billion) & Volume (Metric Tons) Trend Analysis By Market Taxonomy, 2020 to 2024
    • Market Size Value (USD Billion) & Volume (Metric Tons) Forecast By Market Taxonomy, 2025 to 2035
      • By Country
        • Brazil
        • Argentina
        • Rest of LATAM
      • By Product
      • By Application
      • By Source
      • By Form
    • Market Attractiveness Analysis
      • By Country
      • By Product
      • By Application
      • By Source
      • By Form
    • Key Takeaways
  13. Western Europe Market Analysis 2020 to 2024 and Forecast 2025 to 2035, By Country
    • Historical Market Size Value (USD Billion) & Volume (Metric Tons) Trend Analysis By Market Taxonomy, 2020 to 2024
    • Market Size Value (USD Billion) & Volume (Metric Tons) Forecast By Market Taxonomy, 2025 to 2035
      • By Country
        • Germany
        • Italy
        • France
        • UK
        • Spain
        • BENELUX
        • Nordic
        • Rest of W.Europe
      • By Product
      • By Application
      • By Source
      • By Form
    • Market Attractiveness Analysis
      • By Country
      • By Product
      • By Application
      • By Source
      • By Form
    • Key Takeaways
  14. Eastern Europe Market Analysis 2020 to 2024 and Forecast 2025 to 2035, By Country
    • Historical Market Size Value (USD Billion) & Volume (Metric Tons) Trend Analysis By Market Taxonomy, 2020 to 2024
    • Market Size Value (USD Billion) & Volume (Metric Tons) Forecast By Market Taxonomy, 2025 to 2035
      • By Country
        • Russia
        • Hungary
        • Poland
        • Balkan & Baltics
        • Rest of E. Europe
      • By Product
      • By Application
      • By Source
      • By Form
    • Market Attractiveness Analysis
      • By Country
      • By Product
      • By Application
      • By Source
      • By Form
    • Key Takeaways
  15. East Asia Market Analysis 2020 to 2024 and Forecast 2025 to 2035, By Country
    • Historical Market Size Value (USD Billion) & Volume (Metric Tons) Trend Analysis By Market Taxonomy, 2020 to 2024
    • Market Size Value (USD Billion) & Volume (Metric Tons) Forecast By Market Taxonomy, 2025 to 2035
      • By Country
        • China
        • Japan
        • South Korea
      • By Product
      • By Application
      • By Source
      • By Form
    • Market Attractiveness Analysis
      • By Country
      • By Product
      • By Application
      • By Source
      • By Form
    • Key Takeaways
  16. South Asia & Pacific Market Analysis 2020 to 2024 and Forecast 2025 to 2035, By Country
    • Historical Market Size Value (USD Billion) & Volume (Metric Tons) Trend Analysis By Market Taxonomy, 2020 to 2024
    • Market Size Value (USD Billion) & Volume (Metric Tons) Forecast By Market Taxonomy, 2025 to 2035
      • By Country
        • India
        • Australia & New Zealand
        • ASEAN
        • Rest of SAP
      • By Product
      • By Application
      • By Source
      • By Form
    • Market Attractiveness Analysis
      • By Country
      • By Product
      • By Application
      • By Source
      • By Form
    • Key Takeaways
  17. Middle East and Africa Market Analysis 2020 to 2024 and Forecast 2025 to 2035, By Country
    • Historical Market Size Value (USD Billion) & Volume (Metric Tons) Trend Analysis By Market Taxonomy, 2020 to 2024
    • Market Size Value (USD Billion) & Volume (Metric Tons) Forecast By Market Taxonomy, 2025 to 2035
      • By Country
        • GCC Countries
        • Northern Africa
        • South Africa
        • Turkiye
        • Rest of MEA
      • By Product
      • By Application
      • By Source
      • By Form
    • Market Attractiveness Analysis
      • By Country
      • By Product
      • By Application
      • By Source
      • By Form
    • Key Takeaways
  18. Key Countries Market Analysis
    • USA
      • Pricing Analysis
      • Market Share Analysis, 2024
        • By Product
        • By Application
        • By Source
        • By Form
    • Canada
      • Pricing Analysis
      • Market Share Analysis, 2024
        • By Product
        • By Application
        • By Source
        • By Form
    • Brazil
      • Pricing Analysis
      • Market Share Analysis, 2024
        • By Product
        • By Application
        • By Source
        • By Form
    • Mexico
      • Pricing Analysis
      • Market Share Analysis, 2024
        • By Product
        • By Application
        • By Source
        • By Form
    • Argentina
      • Pricing Analysis
      • Market Share Analysis, 2024
        • By Product
        • By Application
        • By Source
        • By Form
  19. Market Structure Analysis
    • Competition Dashboard
    • Competition Benchmarking
    • Market Share Analysis of Top Players
      • By Regional
      • By Product
      • By Application
      • By Source
      • By Form
  20. Competition Analysis
    • Competition Deep Dive
      • BASF SE
        • Overview
        • Product Portfolio
        • Profitability by Market Segments (Product/Age /Sales Channel/Region)
        • Sales Footprint
        • Strategy Overview
          • Marketing Strategy
          • Product Strategy
          • Channel Strategy
      • FMC Corporation
        • Overview
        • Product Portfolio
        • Profitability by Market Segments (Product/Age /Sales Channel/Region)
        • Sales Footprint
        • Strategy Overview
          • Marketing Strategy
          • Product Strategy
          • Channel Strategy
      • The Dow Chemical Company
        • Overview
        • Product Portfolio
        • Profitability by Market Segments (Product/Age /Sales Channel/Region)
        • Sales Footprint
        • Strategy Overview
          • Marketing Strategy
          • Product Strategy
          • Channel Strategy
      • Koninklijke DSM NV
        • Overview
        • Product Portfolio
        • Profitability by Market Segments (Product/Age /Sales Channel/Region)
        • Sales Footprint
        • Strategy Overview
          • Marketing Strategy
          • Product Strategy
          • Channel Strategy
      • Enzymotec Ltd.
        • Overview
        • Product Portfolio
        • Profitability by Market Segments (Product/Age /Sales Channel/Region)
        • Sales Footprint
        • Strategy Overview
          • Marketing Strategy
          • Product Strategy
          • Channel Strategy
      • Croda International Plc
        • Overview
        • Product Portfolio
        • Profitability by Market Segments (Product/Age /Sales Channel/Region)
        • Sales Footprint
        • Strategy Overview
          • Marketing Strategy
          • Product Strategy
          • Channel Strategy
      • Omega Protein Corporation
        • Overview
        • Product Portfolio
        • Profitability by Market Segments (Product/Age /Sales Channel/Region)
        • Sales Footprint
        • Strategy Overview
          • Marketing Strategy
          • Product Strategy
          • Channel Strategy
      • Aker BioMarine AS
        • Overview
        • Product Portfolio
        • Profitability by Market Segments (Product/Age /Sales Channel/Region)
        • Sales Footprint
        • Strategy Overview
          • Marketing Strategy
          • Product Strategy
          • Channel Strategy
      • Polaris Nutritional Lipids
        • Overview
        • Product Portfolio
        • Profitability by Market Segments (Product/Age /Sales Channel/Region)
        • Sales Footprint
        • Strategy Overview
          • Marketing Strategy
          • Product Strategy
          • Channel Strategy
      • Cargill, Incorporated
        • Overview
        • Product Portfolio
        • Profitability by Market Segments (Product/Age /Sales Channel/Region)
        • Sales Footprint
        • Strategy Overview
          • Marketing Strategy
          • Product Strategy
          • Channel Strategy
      • Arista Industries
        • Overview
        • Product Portfolio
        • Profitability by Market Segments (Product/Age /Sales Channel/Region)
        • Sales Footprint
        • Strategy Overview
          • Marketing Strategy
          • Product Strategy
          • Channel Strategy
      • Nutrifynn Caps, Inc.
        • Overview
        • Product Portfolio
        • Profitability by Market Segments (Product/Age /Sales Channel/Region)
        • Sales Footprint
        • Strategy Overview
          • Marketing Strategy
          • Product Strategy
          • Channel Strategy
      • Sea Dragon Ltd.
        • Overview
        • Product Portfolio
        • Profitability by Market Segments (Product/Age /Sales Channel/Region)
        • Sales Footprint
        • Strategy Overview
          • Marketing Strategy
          • Product Strategy
          • Channel Strategy
      • Lysi hf.
        • Overview
        • Product Portfolio
        • Profitability by Market Segments (Product/Age /Sales Channel/Region)
        • Sales Footprint
        • Strategy Overview
          • Marketing Strategy
          • Product Strategy
          • Channel Strategy
      • GC Rieber Oils AS
        • Overview
        • Product Portfolio
        • Profitability by Market Segments (Product/Age /Sales Channel/Region)
        • Sales Footprint
        • Strategy Overview
          • Marketing Strategy
          • Product Strategy
          • Channel Strategy
      • Bizen Chemical Co. LTD
        • Overview
        • Product Portfolio
        • Profitability by Market Segments (Product/Age /Sales Channel/Region)
        • Sales Footprint
        • Strategy Overview
          • Marketing Strategy
          • Product Strategy
          • Channel Strategy
      • Maruha Nichiro Corporation
        • Overview
        • Product Portfolio
        • Profitability by Market Segments (Product/Age /Sales Channel/Region)
        • Sales Footprint
        • Strategy Overview
          • Marketing Strategy
          • Product Strategy
          • Channel Strategy
      • Olvea Fish Oils
        • Overview
        • Product Portfolio
        • Profitability by Market Segments (Product/Age /Sales Channel/Region)
        • Sales Footprint
        • Strategy Overview
          • Marketing Strategy
          • Product Strategy
          • Channel Strategy
      • Arctic Nutrition AS
        • Overview
        • Product Portfolio
        • Profitability by Market Segments (Product/Age /Sales Channel/Region)
        • Sales Footprint
        • Strategy Overview
          • Marketing Strategy
          • Product Strategy
          • Channel Strategy
      • Golden Omega
        • Overview
        • Product Portfolio
        • Profitability by Market Segments (Product/Age /Sales Channel/Region)
        • Sales Footprint
        • Strategy Overview
          • Marketing Strategy
          • Product Strategy
          • Channel Strategy
  21. Assumptions & Acronyms Used
  22. Research Methodology

List of Tables

  • Table 1: Global Market Value (USD Billion) Forecast by Region, 2020-2035
  • Table 2: Global Market Volume (Metric Tons) Forecast by Region, 2020-2035
  • Table 3: Global Market Value (USD Billion) Forecast by Product, 2020-2035
  • Table 4: Global Market Volume (Metric Tons) Forecast by Product, 2020-2035
  • Table 5: Global Market Value (USD Billion) Forecast by Application, 2020-2035
  • Table 6: Global Market Volume (Metric Tons) Forecast by Application, 2020-2035
  • Table 7: Global Market Value (USD Billion) Forecast by Source, 2020-2035
  • Table 8: Global Market Volume (Metric Tons) Forecast by Source, 2020-2035
  • Table 9: Global Market Value (USD Billion) Forecast by Form, 2020-2035
  • Table 10: Global Market Volume (Metric Tons) Forecast by Form, 2020-2035
  • Table 11: North America Market Value (USD Billion) Forecast by Country, 2020-2035
  • Table 12: North America Market Volume (Metric Tons) Forecast by Country, 2020-2035
  • Table 13: North America Market Value (USD Billion) Forecast by Product, 2020-2035
  • Table 14: North America Market Volume (Metric Tons) Forecast by Product, 2020-2035
  • Table 15: North America Market Value (USD Billion) Forecast by Application, 2020-2035
  • Table 16: North America Market Volume (Metric Tons) Forecast by Application, 2020-2035
  • Table 17: North America Market Value (USD Billion) Forecast by Source, 2020-2035
  • Table 18: North America Market Volume (Metric Tons) Forecast by Source, 2020-2035
  • Table 19: North America Market Value (USD Billion) Forecast by Form, 2020-2035
  • Table 20: North America Market Volume (Metric Tons) Forecast by Form, 2020-2035
  • Table 21: Latin America Market Value (USD Billion) Forecast by Country, 2020-2035
  • Table 22: Latin America Market Volume (Metric Tons) Forecast by Country, 2020-2035
  • Table 23: Latin America Market Value (USD Billion) Forecast by Product, 2020-2035
  • Table 24: Latin America Market Volume (Metric Tons) Forecast by Product, 2020-2035
  • Table 25: Latin America Market Value (USD Billion) Forecast by Application, 2020-2035
  • Table 26: Latin America Market Volume (Metric Tons) Forecast by Application, 2020-2035
  • Table 27: Latin America Market Value (USD Billion) Forecast by Source, 2020-2035
  • Table 28: Latin America Market Volume (Metric Tons) Forecast by Source, 2020-2035
  • Table 29: Latin America Market Value (USD Billion) Forecast by Form, 2020-2035
  • Table 30: Latin America Market Volume (Metric Tons) Forecast by Form, 2020-2035
  • Table 31: Western Europe Market Value (USD Billion) Forecast by Country, 2020-2035
  • Table 32: Western Europe Market Volume (Metric Tons) Forecast by Country, 2020-2035
  • Table 33: Western Europe Market Value (USD Billion) Forecast by Product, 2020-2035
  • Table 34: Western Europe Market Volume (Metric Tons) Forecast by Product, 2020-2035
  • Table 35: Western Europe Market Value (USD Billion) Forecast by Application, 2020-2035
  • Table 36: Western Europe Market Volume (Metric Tons) Forecast by Application, 2020-2035
  • Table 37: Western Europe Market Value (USD Billion) Forecast by Source, 2020-2035
  • Table 38: Western Europe Market Volume (Metric Tons) Forecast by Source, 2020-2035
  • Table 39: Western Europe Market Value (USD Billion) Forecast by Form, 2020-2035
  • Table 40: Western Europe Market Volume (Metric Tons) Forecast by Form, 2020-2035
  • Table 41: Eastern Europe Market Value (USD Billion) Forecast by Country, 2020-2035
  • Table 42: Eastern Europe Market Volume (Metric Tons) Forecast by Country, 2020-2035
  • Table 43: Eastern Europe Market Value (USD Billion) Forecast by Product, 2020-2035
  • Table 44: Eastern Europe Market Volume (Metric Tons) Forecast by Product, 2020-2035
  • Table 45: Eastern Europe Market Value (USD Billion) Forecast by Application, 2020-2035
  • Table 46: Eastern Europe Market Volume (Metric Tons) Forecast by Application, 2020-2035
  • Table 47: Eastern Europe Market Value (USD Billion) Forecast by Source, 2020-2035
  • Table 48: Eastern Europe Market Volume (Metric Tons) Forecast by Source, 2020-2035
  • Table 49: Eastern Europe Market Value (USD Billion) Forecast by Form, 2020-2035
  • Table 50: Eastern Europe Market Volume (Metric Tons) Forecast by Form, 2020-2035
  • Table 51: East Asia Market Value (USD Billion) Forecast by Country, 2020-2035
  • Table 52: East Asia Market Volume (Metric Tons) Forecast by Country, 2020-2035
  • Table 53: East Asia Market Value (USD Billion) Forecast by Product, 2020-2035
  • Table 54: East Asia Market Volume (Metric Tons) Forecast by Product, 2020-2035
  • Table 55: East Asia Market Value (USD Billion) Forecast by Application, 2020-2035
  • Table 56: East Asia Market Volume (Metric Tons) Forecast by Application, 2020-2035
  • Table 57: East Asia Market Value (USD Billion) Forecast by Source, 2020-2035
  • Table 58: East Asia Market Volume (Metric Tons) Forecast by Source, 2020-2035
  • Table 59: East Asia Market Value (USD Billion) Forecast by Form, 2020-2035
  • Table 60: East Asia Market Volume (Metric Tons) Forecast by Form, 2020-2035
  • Table 61: South Asia & Pacific Market Value (USD Billion) Forecast by Country, 2020-2035
  • Table 62: South Asia & Pacific Market Volume (Metric Tons) Forecast by Country, 2020-2035
  • Table 63: South Asia & Pacific Market Value (USD Billion) Forecast by Product, 2020-2035
  • Table 64: South Asia & Pacific Market Volume (Metric Tons) Forecast by Product, 2020-2035
  • Table 65: South Asia & Pacific Market Value (USD Billion) Forecast by Application, 2020-2035
  • Table 66: South Asia & Pacific Market Volume (Metric Tons) Forecast by Application, 2020-2035
  • Table 67: South Asia & Pacific Market Value (USD Billion) Forecast by Source, 2020-2035
  • Table 68: South Asia & Pacific Market Volume (Metric Tons) Forecast by Source, 2020-2035
  • Table 69: South Asia & Pacific Market Value (USD Billion) Forecast by Form, 2020-2035
  • Table 70: South Asia & Pacific Market Volume (Metric Tons) Forecast by Form, 2020-2035
  • Table 71: Middle East and Africa Market Value (USD Billion) Forecast by Country, 2020-2035
  • Table 72: Middle East and Africa Market Volume (Metric Tons) Forecast by Country, 2020-2035
  • Table 73: Middle East and Africa Market Value (USD Billion) Forecast by Product, 2020-2035
  • Table 74: Middle East and Africa Market Volume (Metric Tons) Forecast by Product, 2020-2035
  • Table 75: Middle East and Africa Market Value (USD Billion) Forecast by Application, 2020-2035
  • Table 76: Middle East and Africa Market Volume (Metric Tons) Forecast by Application, 2020-2035
  • Table 77: Middle East and Africa Market Value (USD Billion) Forecast by Source, 2020-2035
  • Table 78: Middle East and Africa Market Volume (Metric Tons) Forecast by Source, 2020-2035
  • Table 79: Middle East and Africa Market Value (USD Billion) Forecast by Form, 2020-2035
  • Table 80: Middle East and Africa Market Volume (Metric Tons) Forecast by Form, 2020-2035

List of Figures

  • Figure 1: Global Market Volume (Metric Tons) Forecast 2020-2035
  • Figure 2: Global Market Pricing Analysis
  • Figure 3: Global Market Value (USD Billion) Forecast 2020-2035
  • Figure 4: Global Market Value Share and BPS Analysis by Product, 2025 and 2035
  • Figure 5: Global Market Y-o-Y Growth Comparison by Product, 2025-2035
  • Figure 6: Global Market Attractiveness Analysis by Product
  • Figure 7: Global Market Value Share and BPS Analysis by Application, 2025 and 2035
  • Figure 8: Global Market Y-o-Y Growth Comparison by Application, 2025-2035
  • Figure 9: Global Market Attractiveness Analysis by Application
  • Figure 10: Global Market Value Share and BPS Analysis by Source, 2025 and 2035
  • Figure 11: Global Market Y-o-Y Growth Comparison by Source, 2025-2035
  • Figure 12: Global Market Attractiveness Analysis by Source
  • Figure 13: Global Market Value Share and BPS Analysis by Form, 2025 and 2035
  • Figure 14: Global Market Y-o-Y Growth Comparison by Form, 2025-2035
  • Figure 15: Global Market Attractiveness Analysis by Form
  • Figure 16: Global Market Value (USD Billion) Share and BPS Analysis by Region, 2025 and 2035
  • Figure 17: Global Market Y-o-Y Growth Comparison by Region, 2025-2035
  • Figure 18: Global Market Attractiveness Analysis by Region
  • Figure 19: North America Market Incremental $ Opportunity, 2025-2035
  • Figure 20: Latin America Market Incremental $ Opportunity, 2025-2035
  • Figure 21: Western Europe Market Incremental $ Opportunity, 2025-2035
  • Figure 22: Eastern Europe Market Incremental $ Opportunity, 2025-2035
  • Figure 23: East Asia Market Incremental $ Opportunity, 2025-2035
  • Figure 24: South Asia & Pacific Market Incremental $ Opportunity, 2025-2035
  • Figure 25: Middle East and Africa Market Incremental $ Opportunity, 2025-2035
  • Figure 26: North America Market Value Share and BPS Analysis by Country, 2025 and 2035
  • Figure 27: North America Market Value Share and BPS Analysis by Product, 2025 and 2035
  • Figure 28: North America Market Y-o-Y Growth Comparison by Product, 2025-2035
  • Figure 29: North America Market Attractiveness Analysis by Product
  • Figure 30: North America Market Value Share and BPS Analysis by Application, 2025 and 2035
  • Figure 31: North America Market Y-o-Y Growth Comparison by Application, 2025-2035
  • Figure 32: North America Market Attractiveness Analysis by Application
  • Figure 33: North America Market Value Share and BPS Analysis by Source, 2025 and 2035
  • Figure 34: North America Market Y-o-Y Growth Comparison by Source, 2025-2035
  • Figure 35: North America Market Attractiveness Analysis by Source
  • Figure 36: North America Market Value Share and BPS Analysis by Form, 2025 and 2035
  • Figure 37: North America Market Y-o-Y Growth Comparison by Form, 2025-2035
  • Figure 38: North America Market Attractiveness Analysis by Form
  • Figure 39: Latin America Market Value Share and BPS Analysis by Country, 2025 and 2035
  • Figure 40: Latin America Market Value Share and BPS Analysis by Product, 2025 and 2035
  • Figure 41: Latin America Market Y-o-Y Growth Comparison by Product, 2025-2035
  • Figure 42: Latin America Market Attractiveness Analysis by Product
  • Figure 43: Latin America Market Value Share and BPS Analysis by Application, 2025 and 2035
  • Figure 44: Latin America Market Y-o-Y Growth Comparison by Application, 2025-2035
  • Figure 45: Latin America Market Attractiveness Analysis by Application
  • Figure 46: Latin America Market Value Share and BPS Analysis by Source, 2025 and 2035
  • Figure 47: Latin America Market Y-o-Y Growth Comparison by Source, 2025-2035
  • Figure 48: Latin America Market Attractiveness Analysis by Source
  • Figure 49: Latin America Market Value Share and BPS Analysis by Form, 2025 and 2035
  • Figure 50: Latin America Market Y-o-Y Growth Comparison by Form, 2025-2035
  • Figure 51: Latin America Market Attractiveness Analysis by Form
  • Figure 52: Western Europe Market Value Share and BPS Analysis by Country, 2025 and 2035
  • Figure 53: Western Europe Market Value Share and BPS Analysis by Product, 2025 and 2035
  • Figure 54: Western Europe Market Y-o-Y Growth Comparison by Product, 2025-2035
  • Figure 55: Western Europe Market Attractiveness Analysis by Product
  • Figure 56: Western Europe Market Value Share and BPS Analysis by Application, 2025 and 2035
  • Figure 57: Western Europe Market Y-o-Y Growth Comparison by Application, 2025-2035
  • Figure 58: Western Europe Market Attractiveness Analysis by Application
  • Figure 59: Western Europe Market Value Share and BPS Analysis by Source, 2025 and 2035
  • Figure 60: Western Europe Market Y-o-Y Growth Comparison by Source, 2025-2035
  • Figure 61: Western Europe Market Attractiveness Analysis by Source
  • Figure 62: Western Europe Market Value Share and BPS Analysis by Form, 2025 and 2035
  • Figure 63: Western Europe Market Y-o-Y Growth Comparison by Form, 2025-2035
  • Figure 64: Western Europe Market Attractiveness Analysis by Form
  • Figure 65: Eastern Europe Market Value Share and BPS Analysis by Country, 2025 and 2035
  • Figure 66: Eastern Europe Market Value Share and BPS Analysis by Product, 2025 and 2035
  • Figure 67: Eastern Europe Market Y-o-Y Growth Comparison by Product, 2025-2035
  • Figure 68: Eastern Europe Market Attractiveness Analysis by Product
  • Figure 69: Eastern Europe Market Value Share and BPS Analysis by Application, 2025 and 2035
  • Figure 70: Eastern Europe Market Y-o-Y Growth Comparison by Application, 2025-2035
  • Figure 71: Eastern Europe Market Attractiveness Analysis by Application
  • Figure 72: Eastern Europe Market Value Share and BPS Analysis by Source, 2025 and 2035
  • Figure 73: Eastern Europe Market Y-o-Y Growth Comparison by Source, 2025-2035
  • Figure 74: Eastern Europe Market Attractiveness Analysis by Source
  • Figure 75: Eastern Europe Market Value Share and BPS Analysis by Form, 2025 and 2035
  • Figure 76: Eastern Europe Market Y-o-Y Growth Comparison by Form, 2025-2035
  • Figure 77: Eastern Europe Market Attractiveness Analysis by Form
  • Figure 78: East Asia Market Value Share and BPS Analysis by Country, 2025 and 2035
  • Figure 79: East Asia Market Value Share and BPS Analysis by Product, 2025 and 2035
  • Figure 80: East Asia Market Y-o-Y Growth Comparison by Product, 2025-2035
  • Figure 81: East Asia Market Attractiveness Analysis by Product
  • Figure 82: East Asia Market Value Share and BPS Analysis by Application, 2025 and 2035
  • Figure 83: East Asia Market Y-o-Y Growth Comparison by Application, 2025-2035
  • Figure 84: East Asia Market Attractiveness Analysis by Application
  • Figure 85: East Asia Market Value Share and BPS Analysis by Source, 2025 and 2035
  • Figure 86: East Asia Market Y-o-Y Growth Comparison by Source, 2025-2035
  • Figure 87: East Asia Market Attractiveness Analysis by Source
  • Figure 88: East Asia Market Value Share and BPS Analysis by Form, 2025 and 2035
  • Figure 89: East Asia Market Y-o-Y Growth Comparison by Form, 2025-2035
  • Figure 90: East Asia Market Attractiveness Analysis by Form
  • Figure 91: South Asia & Pacific Market Value Share and BPS Analysis by Country, 2025 and 2035
  • Figure 92: South Asia & Pacific Market Value Share and BPS Analysis by Product, 2025 and 2035
  • Figure 93: South Asia & Pacific Market Y-o-Y Growth Comparison by Product, 2025-2035
  • Figure 94: South Asia & Pacific Market Attractiveness Analysis by Product
  • Figure 95: South Asia & Pacific Market Value Share and BPS Analysis by Application, 2025 and 2035
  • Figure 96: South Asia & Pacific Market Y-o-Y Growth Comparison by Application, 2025-2035
  • Figure 97: South Asia & Pacific Market Attractiveness Analysis by Application
  • Figure 98: South Asia & Pacific Market Value Share and BPS Analysis by Source, 2025 and 2035
  • Figure 99: South Asia & Pacific Market Y-o-Y Growth Comparison by Source, 2025-2035
  • Figure 100: South Asia & Pacific Market Attractiveness Analysis by Source
  • Figure 101: South Asia & Pacific Market Value Share and BPS Analysis by Form, 2025 and 2035
  • Figure 102: South Asia & Pacific Market Y-o-Y Growth Comparison by Form, 2025-2035
  • Figure 103: South Asia & Pacific Market Attractiveness Analysis by Form
  • Figure 104: Middle East and Africa Market Value Share and BPS Analysis by Country, 2025 and 2035
  • Figure 105: Middle East and Africa Market Value Share and BPS Analysis by Product, 2025 and 2035
  • Figure 106: Middle East and Africa Market Y-o-Y Growth Comparison by Product, 2025-2035
  • Figure 107: Middle East and Africa Market Attractiveness Analysis by Product
  • Figure 108: Middle East and Africa Market Value Share and BPS Analysis by Application, 2025 and 2035
  • Figure 109: Middle East and Africa Market Y-o-Y Growth Comparison by Application, 2025-2035
  • Figure 110: Middle East and Africa Market Attractiveness Analysis by Application
  • Figure 111: Middle East and Africa Market Value Share and BPS Analysis by Source, 2025 and 2035
  • Figure 112: Middle East and Africa Market Y-o-Y Growth Comparison by Source, 2025-2035
  • Figure 113: Middle East and Africa Market Attractiveness Analysis by Source
  • Figure 114: Middle East and Africa Market Value Share and BPS Analysis by Form, 2025 and 2035
  • Figure 115: Middle East and Africa Market Y-o-Y Growth Comparison by Form, 2025-2035
  • Figure 116: Middle East and Africa Market Attractiveness Analysis by Form
  • Figure 117: Global Market - Tier Structure Analysis
  • Figure 118: Global Market - Company Share Analysis

Frequently Asked Questions

What is the projected size of the essential fatty acids market in 2025?

The market size is estimated to reach USD 6.5 billion in 2025.

How much is the essential fatty acids market expected to grow by 2035?

The market is projected to reach USD 16.7 billion by 2035, growing at a CAGR of 9.9%.

Which source segment is most lucrative in the essential fatty acids market?

Marine-based oils remains the most lucrative source, accounting for a 68% share in 2025.

What is the leading application segment in the essential fatty acids market in 2025?

Dietary supplements are expected to dominate with a 74.5% share in 2025.

What is the country with the highest CAGR in the essential fatty acids market from 2025 to 2035?

The UK is projected to register the highest CAGR of 9.2% during the forecast period.

Explore Similar Insights

Future Market Insights

Essential Fatty Acids Market