Frozen Food Packaging Market Outlook (2023 to 2033)

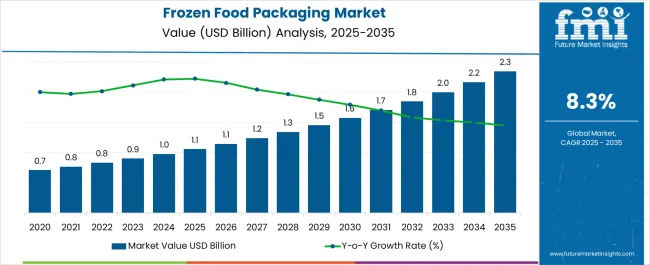
The frozen food packaging market is estimated to be valued at US$ 900 million in 2023 and is rising to US$ 2.0 billion by 2033. Sales of frozen food packaging are likely to grow at a CAGR of 8.3% during the forecast period. The following factor propelling the market size are:

  • The rising demand for excellent packaging for safe food items is increasing the adoption of frozen food packaging.
  • The increasing population, urbanization, and fast-paced life are shifting consumers' preferences toward packed products and are raising the demand for frozen food packaging.
  • To prepare an instant meal, less time and an increase in modernization cooking are surging the frozen food packaging market opportunities.
  • Increased workforce, busy schedules, and changes in dynamics are growing the adoption of frozen food packaging.
  • Adopting a luxurious lifestyle, growing consumption of frozen food, and emerging economies in developing nations boost market expansion.
  • The rise in demand for innovative and easy-to-carry food and attractive packaging is flourishing the market growth.
  • The growing demand for convenience food, uneven meal-time, and eating habits increase the frozen food packaging market size.
  • The manufacturers are advancing the food industry by developing ready-to-eat packed products that are estimated to booming the market share.
  • The growing demand for frozen food packaging is increasing to enhance food safety and shelf-life for a longer period.

Don't pay for what you don't need

Customize your report by selecting specific countries or regions and save 30%!

How are Manufacturers Improving the Market Opportunities with Innovations?

The manufacturers are increasing the adoption of sustainable packaging with novel technology to provide different frozen food packaging formats. Manufacturing companies are developing better materials to protect food items, such as using premium quality paper in the food sector.

Small-sized businesses maintain food quality and increase the demand for frozen food packaging. Moreover, the focus on biodegradable materials to secure the environment, such as paper-based frozen food packaging, is growing market expansion. Customized applications and growing awareness of actual food packaging are increasing global market opportunities.

Attributes Details
Market CAGR (2023 to 2033) 8.3%
Market Valuation (2023) US$ 900 million
Market Valuation (2033) US$ 2.0 billion

Frozen Food Packaging Market Past vs Future Performance

According to Future Market Insights, the global frozen food packaging market is projected at a healthy 8.3% CAGR during the forecast period. Historically, the market registered a CAGR of 12.2% between 2017 to 2022.

The consumers shifting preferences from traditional to quick meal cooking are increasing the adoption of frozen food packaging during the forecast period. The benefits of easy and fast cooking trends are surging the market growth. Growing demand for processed foods and adopting western culture are expanding the sales of frozen food packaging.

The recent analysis indicates a monumental rise in demand and consumption of frozen foods. The demand for easy-to-cook foods offers maximum convenience to the final consumer. The factors mentioned above are anticipated to result in the growing market popularity of frozen foods in all parts of the world. In addition, increased awareness regarding food wastage boosted the market opportunities during the forecast period.

  • Short Term (2023 to 2026): The rising demand for frozen food packaging increases the shelf-life of food items.
  • Medium Term (2026 to 2029): The growing urbanization, easy-to-cook meal, and busy schedules are increasing the market growth.
  • Long Term (2029 to 2033): Adopting biodegradable packaging to reduce hazardous environment are driving market opportunities.
Ismail Sutaria
Ismail Sutaria

Principal Consultant

Talk to Analyst

Find your sweet spots for generating winning opportunities in this market.

Top Two Segment in the Market

Segments Material Type
Top Category Plastic
Historic CAGR 12%
Forecast CAGR 7.8%
Segments Packaging Type
Top Category Rigid
Historic CAGR 11%
Forecast CAGR 7.4%

Why is Plastic Preferred Material?

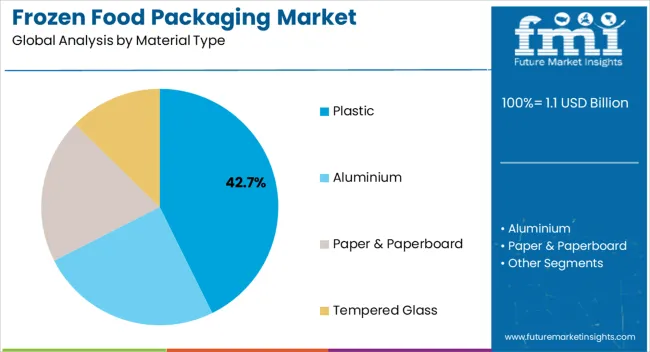
The plastic category leads the material type segment by capturing a CAGR of 11% during the forecast period. The key producers of frozen food packaging use various materials, but plastic offers them a wide range of options. Some of these are polypropylene, polyethylene, and many others to choose from per their needs. Moreover, using plastic for producing frozen food packaging increases the profit margin of the manufacturers.

Plastic is cost-effective in comparison with aluminum, glass, and other materials. Thus, the flexibility and easy availability make plastic the most preferred material for producing frozen food packaging worldwide. Historically, the global sales of plastic frozen food packaging captured a 12.2% CAGR between 2017 to 2022.

Rigid Frozen Food Packaging Category Dominates Global Market

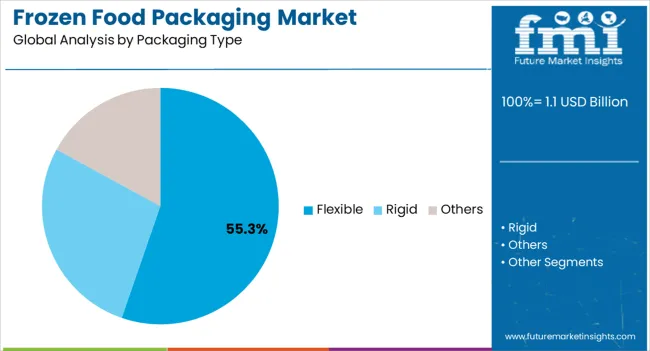
Rigid packaging is leading the market by accounting for a CAGR of 7.4% during the forecast period. The increasing demand for rigid packaging for frozen food to maintain the quality of food items propels market expansion. The manufacturers develop different types and shapes of rigid packaging per consumers' demand.

The increasing advanced technology and sustainable packaging solution are increasing the adoption of rigid packaging during the forecast period. The adoption of rigid packaging by the end user as it easily transferred from one place to another without any harm and hassle. Customized and long last packaging for food items is increasing the demand for rigid packaging. Historically, rigid packaging captured a CAGR of 11% between 2017 to 2022.

Which Food Type Remains Preferable?

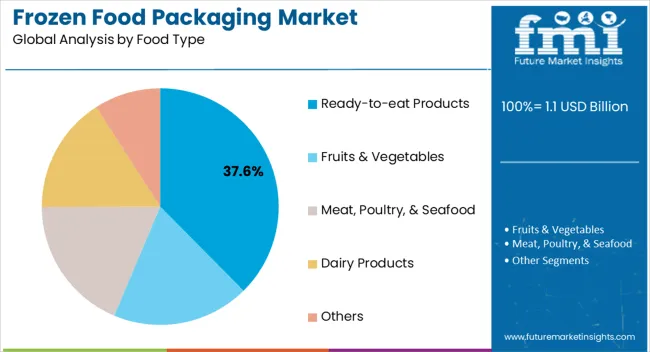
Modern-day advancements across the food industry have resulted in the introduction of ready-to-eat foods. The trends of on-the-go consumption patterns increase consumers' demand for food & beverages to be consumed at their convenience. The increasing market popularity of fast foods and pre-cooked foods across the globe fuels the demand for frozen food packaging. Thus, the ready-to-eat foods segment secured 1/3rd of the total sales of frozen food packaging globally in 2022.

Top Countries Data Table Mentioned Below

Country United States
CAGR (2017 to 2022) 11.8%
CAGR (2023 to 2023) 8.1%
Valuation (2023 to 2033) US$ 708.6 million
Country United Kingdom
CAGR (2017 to 2022) 10.8%
CAGR (2023 to 2023) 7.4%
Valuation (2023 to 2033) US$ 84.2 million
Country China
CAGR (2017 to 2022) 11.4%
CAGR (2023 to 2023) 7.7%
Valuation (2023 to 2033) US$ 143.5 million
Country Japan
CAGR (2017 to 2022) 10.3%
CAGR (2023 to 2023) 6.8%
Valuation (2023 to 2033) US$ 117.3 million
Country South Korea
CAGR (2017 to 2022) 8.9%
CAGR (2023 to 2023) 6.1%
Valuation (2023 to 2033) US$ 69 million

Why is the United States Estimated to be a Key Market across North America?

The United States is estimated to capture a CAGR of 8.1% with a valuation of US$ 708.6 million during the forecast period. According to The Centers for Disease Control and Prevention (CDC), there are more than 48 million cases of food-related illness annually. In addition, the alarming range of food wastage across the United States is creating huge awareness to increase the adoption of frozen food packaging. The food waste estimates in the country reach around US$ 165 billion each year.

The presence of frozen food manufacturers with increased consumption of frozen foods among all age groups of consumers raises United States market opportunities, accounting for over 4/5th of the total frozen food packaging sold in North America in 2022. The United States frozen food packaging market historically captured a CAGR of 11.8% between 2017 and 2022.

What Factors Influence the United Kingdom Market Growth?

The United Kingdom is estimated to secure a CAGR of 7.4% with a valuation of US$ 84.2 million during the forecast period. The latest data from the Centre for the Promotion of Imports shows that the United Kingdom is the leading importer of frozen vegetables in Europe. Moreover, The United Kingdom's import of frozen vegetables in substantial quantities across the globe is expanding the market share.

The popularity of easy-to-prepare foods with replacement of food of animal origin with vegetable alternatives increases the market growth. The growing number of vegetarian and vegan food across Europe drives the United Kingdom's frozen food packaging market size.

The major, small, and medium-sized players are engaged in offering sustainable packaging products for frozen food products. Due to rising environmental concerns, the United Kingdom market manufacturers are adopting rigid packaging solutions for better shelf-life for food items. Historically, the United Kingdom captured a CAGR of 10.8% between 2017 and 2022.

How are Manufacturers Adding Value to the China Market?

China is estimated to capture a CAGR of 7.7% with a valuation of US$ 143.5 million during the forecast period. The rising population, quality products, awareness of food wastage, and increased adoption of frozen food packaging in China. The increasing foodborne and spoilage is influencing the China market opportunities.

The consumers of China prefer the consumption of frozen food packaging due to its premium quality and easy-to-cook trends. Moreover, the rising demand for frozen meat and other items is expanding China's frozen food packaging market size. According to the National Bureau of Statistics of China, frozen food packaging raised around 30% in the historic period in 2018.

The rising numbers of present marketers and new entrances drive market expansion. These players continue to start freezing different food items with their latest innovative skills and expanding market size. Historically, China captured a CAGR of 11.4% between 2017 and 2022.

Get the data you need at a Fraction of the cost

Personalize your report by choosing insights you need
and save 40%!

Competitive Landscape

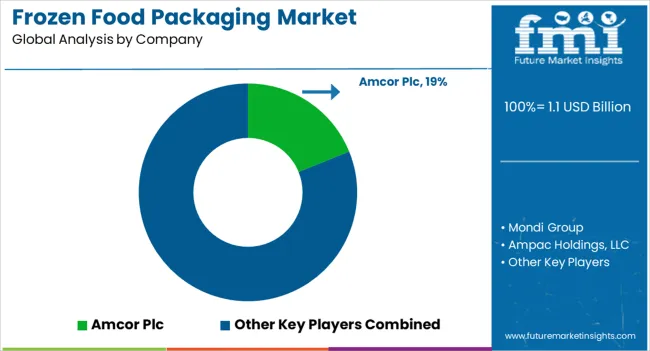
Key frozen food packaging manufacturers focus on offering recyclable packaging products and entering into collaborations. These players are adopting innovative technology to maintain food quality for a long time. The prominent vendors are using several marketing tactics to increase the market.

Prominent players in the market are:

  • Mondi Group
  • Ampac Holdings, LLC
  • Amcor Plc
  • International Paper Company
  • KOROZO Ambalaj San.ve Tic A.S.
  • Sealstrip Corporation
  • Sonoco Products Company
  • Alto Packaging
  • Sealed Air Corporation
  • Huhtamaki Group
  • MOD-PAC Corp
  • WestRock Company
  • Tray-Pak Corporation
  • Uflex Limited.
  • Amerplast Ltd.

Recent Developments in the Frozen Food Packaging Market

  • In December 2021, Mondi Group launched renewable and recyclable frozen food packaging, produced using 80% less plastic, and designed for United Kingdom’s top frozen food retailer in Iceland.
  • In May 2021, Amcor Plc launched its first recycled packaging for powdered chocolate in Latin America, with the goal of providing a sustainable packaging solution.
  • In May 2019, Cascades Sonoco, a paper packaging company, inaugurated a packaging facility with its innovative production & eco-friendly solution in Birmingham, England. The company invested US$ 17 million in a water-based coating solution to create compostable and recyclable packaging.
  • In 2022, WestRock, a manufacturing company, received an Innovator Award for improving food service packaging and recycling from the paperboard packaging council.

Scope of Report

Attribute Details
Forecast Period 2023 to 2033
Historical Data Available for 2017 to 2022
Market Analysis US$ billion for Value
Key Countries Covered United States, Canada, Germany, United Kingdom, France, Italy, Spain, Russia, China, Japan, South Korea, India, Thailand, Malaysia, Indonesia, Australia, New Zealand, GCC Countries, Turkey, Northern Africa, and South Africa
Key Segments Covered Material Type, Packaging Type, Food Type, Region
Key Companies Profiled Mondi Group; Ampac Holdings, LLC; Amcor Plc; International Paper Company; KOROZO Ambalaj San.ve Tic A.S.; Sealstrip Corporation; Sonoco Products Company; Alto Packaging; Sealed Air Corporation; Huhtamaki Group; MOD-PAC Corp; WestRock Company; Tray-Pak Corporation; Uflex Limited.; Amerplast Ltd.
Report Coverage Market Forecast, Company Share Analysis, Competition Intelligence, DROT Analysis, Market Dynamics and Challenges, and Strategic Growth Initiatives
Customization & Pricing Available upon Request

Frozen Food Packaging Market by Category

By Material Type:

  • Plastic
    • Polyethylene
    • Polypropylene
    • Ethyl Vinyl Acetate
    • Polyvinyl Chloride
    • Polyvinylidene Chloride
    • Polystyrene
    • Polyethylene Terephthalate
  • Aluminium
  • Paper & Paperboard
  • Tempered Glass

By Packaging Type:

  • Rigid
    • Boxes
    • Tubs & Cups
    • Cans
    • Trays
  • Flexible
    • Pouches
    • Bags
    • Films
  • Others

By Food Type:

  • Ready-to-eat Products
  • Fruits & Vegetables
  • Meat, Poultry, & Seafood
  • Dairy Products
  • Others

By Region:

  • North America
  • Latin America
  • Europe
  • South Asia & Pacific
  • East Asia
  • Middle East & Africa (MEA)

Frequently Asked Questions

What is the Growth Outlook for the Frozen Food Packaging Market?

The overall market might follow a y-o-y growth rate of 8.3% through 2033.

What is the Current Valuation of the Global Frozen Food Packaging Market?

The global market size is estimated to be around US$ 900 million in 2023.

What are the Emerging Trends in the Frozen Food Packaging Market?

Growing preference for quick meal cooking is driving the overall market.

Which is the Leading type of Frozen Food Packaging?

The rigid packaging segment is expected to progress at 7.4% CAGR through 2033.

Which Country has Higher Growth Potential for Frozen Food Packaging?

The United States market is forecasted to expand at an impressive 8.1% CAGR through 2033.

Table of Content
1. Executive Summary | Frozen Food Packaging Market
    1.1. Global Market Outlook
    1.2. Demand-side Trends
    1.3. Supply-side Trends
    1.4. Technology Roadmap Analysis
    1.5. Analysis and Recommendations
2. Market Overview
    2.1. Market Coverage / Taxonomy
    2.2. Market Definition / Scope / Limitations
3. Market Background
    3.1. Market Dynamics
        3.1.1. Drivers
        3.1.2. Restraints
        3.1.3. Opportunity
        3.1.4. Trends
    3.2. Scenario Forecast
        3.2.1. Demand in Optimistic Scenario
        3.2.2. Demand in Likely Scenario
        3.2.3. Demand in Conservative Scenario
    3.3. Opportunity Map Analysis
    3.4. Product Life Cycle Analysis
    3.5. Supply Chain Analysis
        3.5.1. Supply Side Participants and their Roles
            3.5.1.1. Producers
            3.5.1.2. Mid-Level Participants (Traders / Agents / Brokers)
            3.5.1.3. Wholesalers and Distributors
        3.5.2. Value Added and Value Created at Node in the Supply Chain
        3.5.3. List of Raw Material Suppliers
        3.5.4. List of Existing and Potential Buyers
    3.6. Investment Feasibility Matrix
    3.7. Value Chain Analysis
        3.7.1. Profit Margin Analysis
        3.7.2. Wholesalers and Distributors
        3.7.3. Retailers
    3.8. PESTLE and Porter’s Analysis
    3.9. Regulatory Landscape
        3.9.1. By Key Regions
        3.9.2. By Key Countries
    3.10. Regional Parent Market Outlook
    3.11. Production and Consumption Statistics
    3.12. Import and Export Statistics
4. Global Market Analysis 2017 to 2022 and Forecast, 2023 to 2033
    4.1. Historical Market Size Value (US$ Million) & Volume (Tonnes) Analysis, 2017 to 2022
    4.2. Current and Future Market Size Value (US$ Million) & Volume (Tonnes) Projections, 2023 to 2033
        4.2.1. Y-o-Y Growth Trend Analysis
        4.2.2. Absolute $ Opportunity Analysis
5. Global Market Analysis 2017 to 2022 and Forecast 2023 to 2033, By Material Type
    5.1. Introduction / Key Findings
    5.2. Historical Market Size Value (US$ Million) & Volume (Tonnes) Analysis By Material Type, 2017 to 2022
    5.3. Current and Future Market Size Value (US$ Million) & Volume (Tonnes) Analysis and Forecast By Material Type, 2023 to 2033
        5.3.1. Plastic
            5.3.1.1. Polyethylene
            5.3.1.2. Polypropylene
            5.3.1.3. Ethyl Vinyl Acetate
            5.3.1.4. Polyvinyl Chloride
            5.3.1.5. Polyvinylidene Chloride
            5.3.1.6. Polystyrene
            5.3.1.7. Polyethylene Terephthalate
        5.3.2. Aluminum
        5.3.3. Paper and Paperboard
        5.3.4. Tempered Glass
    5.4. Y-o-Y Growth Trend Analysis By Material Type, 2017 to 2022
    5.5. Absolute $ Opportunity Analysis By Material Type, 2023 to 2033
6. Global Market Analysis 2017 to 2022 and Forecast 2023 to 2033, By Packaging Type
    6.1. Introduction / Key Findings
    6.2. Historical Market Size Value (US$ Million) & Volume (Tonnes) Analysis By Packaging Type, 2017 to 2022
    6.3. Current and Future Market Size Value (US$ Million) & Volume (Tonnes) Analysis and Forecast By Packaging Type, 2023 to 2033
        6.3.1. Rigid
            6.3.1.1. Boxes
            6.3.1.2. Tubs & Cups
            6.3.1.3. Cans
            6.3.1.4. Trays
        6.3.2. Flexible
            6.3.2.1. Pouches
            6.3.2.2. Bags
            6.3.2.3. Films
            6.3.2.4. Others
    6.4. Y-o-Y Growth Trend Analysis By Packaging Type, 2017 to 2022
    6.5. Absolute $ Opportunity Analysis By Packaging Type, 2023 to 2033
7. Global Market Analysis 2017 to 2022 and Forecast 2023 to 2033, By Food Type
    7.1. Introduction / Key Findings
    7.2. Historical Market Size Value (US$ Million) & Volume (Tonnes) Analysis By Food Type, 2017 to 2022
    7.3. Current and Future Market Size Value (US$ Million) & Volume (Tonnes) Analysis and Forecast By Food Type, 2023 to 2033
        7.3.1. Ready-to-Eat Products
        7.3.2. Fruits and Vegetables
        7.3.3. Meat, Poultry, & Seafood
        7.3.4. Dairy Products
        7.3.5. Others
    7.4. Y-o-Y Growth Trend Analysis By Food Type, 2017 to 2022
    7.5. Absolute $ Opportunity Analysis By Food Type, 2023 to 2033
8. Global Market Analysis 2017 to 2022 and Forecast 2023 to 2033, By Region
    8.1. Introduction
    8.2. Historical Market Size Value (US$ Million) & Volume (Tonnes) Analysis By Region, 2017 to 2022
    8.3. Current Market Size Value (US$ Million) & Volume (Tonnes) Analysis and Forecast By Region, 2023 to 2033
        8.3.1. North America
        8.3.2. Latin America
        8.3.3. Europe
        8.3.4. East Asia
        8.3.5. South Asia
        8.3.6. Oceania
        8.3.7. Middle East & Africa (MEA)
    8.4. Market Attractiveness Analysis By Region
9. North America Market Analysis 2017 to 2022 and Forecast 2023 to 2033, By Country
    9.1. Historical Market Size Value (US$ Million) & Volume (Tonnes) Trend Analysis By Market Taxonomy, 2017 to 2022
    9.2. Market Size Value (US$ Million) & Volume (Tonnes) Forecast By Market Taxonomy, 2023 to 2033
        9.2.1. By Country
            9.2.1.1. USA
            9.2.1.2. Canada
        9.2.2. By Material Type
        9.2.3. By Packaging Type
        9.2.4. By Food Type
    9.3. Market Attractiveness Analysis
        9.3.1. By Country
        9.3.2. By Material Type
        9.3.3. By Packaging Type
        9.3.4. By Food Type
    9.4. Key Takeaways
10. Latin America Market Analysis 2017 to 2022 and Forecast 2023 to 2033, By Country
    10.1. Historical Market Size Value (US$ Million) & Volume (Tonnes) Trend Analysis By Market Taxonomy, 2017 to 2022
    10.2. Market Size Value (US$ Million) & Volume (Tonnes) Forecast By Market Taxonomy, 2023 to 2033
        10.2.1. By Country
            10.2.1.1. Brazil
            10.2.1.2. Mexico
            10.2.1.3. Argentina
            10.2.1.4. Rest of Latin America
        10.2.2. By Material Type
        10.2.3. By Packaging Type
        10.2.4. By Food Type
    10.3. Market Attractiveness Analysis
        10.3.1. By Country
        10.3.2. By Material Type
        10.3.3. By Packaging Type
        10.3.4. By Food Type
    10.4. Key Takeaways
11. Europe Market Analysis 2017 to 2022 and Forecast 2023 to 2033, By Country
    11.1. Historical Market Size Value (US$ Million) & Volume (Tonnes) Trend Analysis By Market Taxonomy, 2017 to 2022
    11.2. Market Size Value (US$ Million) & Volume (Tonnes) Forecast By Market Taxonomy, 2023 to 2033
        11.2.1. By Country
            11.2.1.1. France
            11.2.1.2. Germany
            11.2.1.3. Italy
            11.2.1.4. Spain
            11.2.1.5. UK
            11.2.1.6. Rest of Europe
        11.2.2. By Material Type
        11.2.3. By Packaging Type
        11.2.4. By Food Type
    11.3. Market Attractiveness Analysis
        11.3.1. By Country
        11.3.2. By Material Type
        11.3.3. By Packaging Type
        11.3.4. By Food Type
    11.4. Key Takeaways
12. East Asia Market Analysis 2017 to 2022 and Forecast 2023 to 2033, By Country
    12.1. Historical Market Size Value (US$ Million) & Volume (Tonnes) Trend Analysis By Market Taxonomy, 2017 to 2022
    12.2. Market Size Value (US$ Million) & Volume (Tonnes) Forecast By Market Taxonomy, 2023 to 2033
        12.2.1. By Country
            12.2.1.1. China
            12.2.1.2. Japan
            12.2.1.3. South Korea
        12.2.2. By Material Type
        12.2.3. By Packaging Type
        12.2.4. By Food Type
    12.3. Market Attractiveness Analysis
        12.3.1. By Country
        12.3.2. By Material Type
        12.3.3. By Packaging Type
        12.3.4. By Food Type
    12.4. Key Takeaways
13. South Asia Market Analysis 2017 to 2022 and Forecast 2023 to 2033, By Country
    13.1. Historical Market Size Value (US$ Million) & Volume (Tonnes) Trend Analysis By Market Taxonomy, 2017 to 2022
    13.2. Market Size Value (US$ Million) & Volume (Tonnes) Forecast By Market Taxonomy, 2023 to 2033
        13.2.1. By Country
            13.2.1.1. Malaysia
            13.2.1.2. Indonesia
            13.2.1.3. India
            13.2.1.4. Rest of South Asia
        13.2.2. By Material Type
        13.2.3. By Packaging Type
        13.2.4. By Food Type
    13.3. Market Attractiveness Analysis
        13.3.1. By Country
        13.3.2. By Material Type
        13.3.3. By Packaging Type
        13.3.4. By Food Type
    13.4. Key Takeaways
14. Oceania Market Analysis 2017 to 2022 and Forecast 2023 to 2033, By Country
    14.1. Historical Market Size Value (US$ Million) & Volume (Tonnes) Trend Analysis By Market Taxonomy, 2017 to 2022
    14.2. Market Size Value (US$ Million) & Volume (Tonnes) Forecast By Market Taxonomy, 2023 to 2033
        14.2.1. By Country
            14.2.1.1. Australia
            14.2.1.2. New Zealand
        14.2.2. By Material Type
        14.2.3. By Packaging Type
        14.2.4. By Food Type
    14.3. Market Attractiveness Analysis
        14.3.1. By Country
        14.3.2. By Material Type
        14.3.3. By Packaging Type
        14.3.4. By Food Type
    14.4. Key Takeaways
15. Middle East and Africa Market Analysis 2017 to 2022 and Forecast 2023 to 2033, By Country
    15.1. Historical Market Size Value (US$ Million) & Volume (Tonnes) Trend Analysis By Market Taxonomy, 2017 to 2022
    15.2. Market Size Value (US$ Million) & Volume (Tonnes) Forecast By Market Taxonomy, 2023 to 2033
        15.2.1. By Country
            15.2.1.1. GCC Countries
            15.2.1.2. Israel
            15.2.1.3. South Africa
            15.2.1.4. Rest of Middle East and Africa
        15.2.2. By Material Type
        15.2.3. By Packaging Type
        15.2.4. By Food Type
    15.3. Market Attractiveness Analysis
        15.3.1. By Country
        15.3.2. By Material Type
        15.3.3. By Packaging Type
        15.3.4. By Food Type
    15.4. Key Takeaways
16. Key Countries Market Analysis
    16.1. USA
        16.1.1. Pricing Analysis
        16.1.2. Market Share Analysis, 2022
            16.1.2.1. By Material Type
            16.1.2.2. By Packaging Type
            16.1.2.3. By Food Type
    16.2. Canada
        16.2.1. Pricing Analysis
        16.2.2. Market Share Analysis, 2022
            16.2.2.1. By Material Type
            16.2.2.2. By Packaging Type
            16.2.2.3. By Food Type
    16.3. Brazil
        16.3.1. Pricing Analysis
        16.3.2. Market Share Analysis, 2022
            16.3.2.1. By Material Type
            16.3.2.2. By Packaging Type
            16.3.2.3. By Food Type
    16.4. Mexico
        16.4.1. Pricing Analysis
        16.4.2. Market Share Analysis, 2022
            16.4.2.1. By Material Type
            16.4.2.2. By Packaging Type
            16.4.2.3. By Food Type
    16.5. Argentina
        16.5.1. Pricing Analysis
        16.5.2. Market Share Analysis, 2022
            16.5.2.1. By Material Type
            16.5.2.2. By Packaging Type
            16.5.2.3. By Food Type
    16.6. France
        16.6.1. Pricing Analysis
        16.6.2. Market Share Analysis, 2022
            16.6.2.1. By Material Type
            16.6.2.2. By Packaging Type
            16.6.2.3. By Food Type
    16.7. Germany
        16.7.1. Pricing Analysis
        16.7.2. Market Share Analysis, 2022
            16.7.2.1. By Material Type
            16.7.2.2. By Packaging Type
            16.7.2.3. By Food Type
    16.8. Italy
        16.8.1. Pricing Analysis
        16.8.2. Market Share Analysis, 2022
            16.8.2.1. By Material Type
            16.8.2.2. By Packaging Type
            16.8.2.3. By Food Type
    16.9. Spain
        16.9.1. Pricing Analysis
        16.9.2. Market Share Analysis, 2022
            16.9.2.1. By Material Type
            16.9.2.2. By Packaging Type
            16.9.2.3. By Food Type
    16.10. UK
        16.10.1. Pricing Analysis
        16.10.2. Market Share Analysis, 2022
            16.10.2.1. By Material Type
            16.10.2.2. By Packaging Type
            16.10.2.3. By Food Type
    16.11. China
        16.11.1. Pricing Analysis
        16.11.2. Market Share Analysis, 2022
            16.11.2.1. By Material Type
            16.11.2.2. By Packaging Type
            16.11.2.3. By Food Type
    16.12. Japan
        16.12.1. Pricing Analysis
        16.12.2. Market Share Analysis, 2022
            16.12.2.1. By Material Type
            16.12.2.2. By Packaging Type
            16.12.2.3. By Food Type
    16.13. South Korea
        16.13.1. Pricing Analysis
        16.13.2. Market Share Analysis, 2022
            16.13.2.1. By Material Type
            16.13.2.2. By Packaging Type
            16.13.2.3. By Food Type
    16.14. Malaysia
        16.14.1. Pricing Analysis
        16.14.2. Market Share Analysis, 2022
            16.14.2.1. By Material Type
            16.14.2.2. By Packaging Type
            16.14.2.3. By Food Type
    16.15. Indonesia
        16.15.1. Pricing Analysis
        16.15.2. Market Share Analysis, 2022
            16.15.2.1. By Material Type
            16.15.2.2. By Packaging Type
            16.15.2.3. By Food Type
    16.16. India
        16.16.1. Pricing Analysis
        16.16.2. Market Share Analysis, 2022
            16.16.2.1. By Material Type
            16.16.2.2. By Packaging Type
            16.16.2.3. By Food Type
    16.17. Rest of South Asia
        16.17.1. Pricing Analysis
        16.17.2. Market Share Analysis, 2022
            16.17.2.1. By Material Type
            16.17.2.2. By Packaging Type
            16.17.2.3. By Food Type
    16.18. Australia
        16.18.1. Pricing Analysis
        16.18.2. Market Share Analysis, 2022
            16.18.2.1. By Material Type
            16.18.2.2. By Packaging Type
            16.18.2.3. By Food Type
    16.19. New Zealand
        16.19.1. Pricing Analysis
        16.19.2. Market Share Analysis, 2022
            16.19.2.1. By Material Type
            16.19.2.2. By Packaging Type
            16.19.2.3. By Food Type
    16.20. GCC Countries
        16.20.1. Pricing Analysis
        16.20.2. Market Share Analysis, 2022
            16.20.2.1. By Material Type
            16.20.2.2. By Packaging Type
            16.20.2.3. By Food Type
    16.21. Israel
        16.21.1. Pricing Analysis
        16.21.2. Market Share Analysis, 2022
            16.21.2.1. By Material Type
            16.21.2.2. By Packaging Type
            16.21.2.3. By Food Type
    16.22. South Africa
        16.22.1. Pricing Analysis
        16.22.2. Market Share Analysis, 2022
            16.22.2.1. By Material Type
            16.22.2.2. By Packaging Type
            16.22.2.3. By Food Type
17. Market Structure Analysis
    17.1. Competition Dashboard
    17.2. Competition Benchmarking
    17.3. Market Share Analysis of Top Players
        17.3.1. By Regional
        17.3.2. By Material Type
        17.3.3. By Packaging Type
        17.3.4. By Food Type
18. Competition Analysis
    18.1. Competition Deep Dive
        18.1.1. Mondi Group
            18.1.1.1. Overview
            18.1.1.2. Product Portfolio
            18.1.1.3. Profitability by Market Segments
            18.1.1.4. Sales Footprint
            18.1.1.5. Strategy Overview
                18.1.1.5.1. Marketing Strategy
                18.1.1.5.2. Product Strategy
                18.1.1.5.3. Channel Strategy
        18.1.2. Ampac Holdings, LLC
            18.1.2.1. Overview
            18.1.2.2. Product Portfolio
            18.1.2.3. Profitability by Market Segments
            18.1.2.4. Sales Footprint
            18.1.2.5. Strategy Overview
                18.1.2.5.1. Marketing Strategy
                18.1.2.5.2. Product Strategy
                18.1.2.5.3. Channel Strategy
        18.1.3. Amcor Plc
            18.1.3.1. Overview
            18.1.3.2. Product Portfolio
            18.1.3.3. Profitability by Market Segments
            18.1.3.4. Sales Footprint
            18.1.3.5. Strategy Overview
                18.1.3.5.1. Marketing Strategy
                18.1.3.5.2. Product Strategy
                18.1.3.5.3. Channel Strategy
        18.1.4. International Paper Company
            18.1.4.1. Overview
            18.1.4.2. Product Portfolio
            18.1.4.3. Profitability by Market Segments
            18.1.4.4. Sales Footprint
            18.1.4.5. Strategy Overview
                18.1.4.5.1. Marketing Strategy
                18.1.4.5.2. Product Strategy
                18.1.4.5.3. Channel Strategy
        18.1.5. Sealstrip Corporation
            18.1.5.1. Overview
            18.1.5.2. Product Portfolio
            18.1.5.3. Profitability by Market Segments
            18.1.5.4. Sales Footprint
            18.1.5.5. Strategy Overview
                18.1.5.5.1. Marketing Strategy
                18.1.5.5.2. Product Strategy
                18.1.5.5.3. Channel Strategy
        18.1.6. Sonoco Products Company
            18.1.6.1. Overview
            18.1.6.2. Product Portfolio
            18.1.6.3. Profitability by Market Segments
            18.1.6.4. Sales Footprint
            18.1.6.5. Strategy Overview
                18.1.6.5.1. Marketing Strategy
                18.1.6.5.2. Product Strategy
                18.1.6.5.3. Channel Strategy
        18.1.7. Alto Packaging
            18.1.7.1. Overview
            18.1.7.2. Product Portfolio
            18.1.7.3. Profitability by Market Segments
            18.1.7.4. Sales Footprint
            18.1.7.5. Strategy Overview
                18.1.7.5.1. Marketing Strategy
                18.1.7.5.2. Product Strategy
                18.1.7.5.3. Channel Strategy
        18.1.8. Sealed Air Corporation
            18.1.8.1. Overview
            18.1.8.2. Product Portfolio
            18.1.8.3. Profitability by Market Segments
            18.1.8.4. Sales Footprint
            18.1.8.5. Strategy Overview
                18.1.8.5.1. Marketing Strategy
                18.1.8.5.2. Product Strategy
                18.1.8.5.3. Channel Strategy
        18.1.9. Huhtamaki Group
            18.1.9.1. Overview
            18.1.9.2. Product Portfolio
            18.1.9.3. Profitability by Market Segments
            18.1.9.4. Sales Footprint
            18.1.9.5. Strategy Overview
                18.1.9.5.1. Marketing Strategy
                18.1.9.5.2. Product Strategy
                18.1.9.5.3. Channel Strategy
        18.1.10. MOD-PAC Corp
            18.1.10.1. Overview
            18.1.10.2. Product Portfolio
            18.1.10.3. Profitability by Market Segments
            18.1.10.4. Sales Footprint
            18.1.10.5. Strategy Overview
                18.1.10.5.1. Marketing Strategy
                18.1.10.5.2. Product Strategy
                18.1.10.5.3. Channel Strategy
        18.1.11. WestRock Company
            18.1.11.1. Overview
            18.1.11.2. Product Portfolio
            18.1.11.3. Profitability by Market Segments
            18.1.11.4. Sales Footprint
            18.1.11.5. Strategy Overview
                18.1.11.5.1. Marketing Strategy
                18.1.11.5.2. Product Strategy
                18.1.11.5.3. Channel Strategy
        18.1.12. Tray-Pak Corporation
            18.1.12.1. Overview
            18.1.12.2. Product Portfolio
            18.1.12.3. Profitability by Market Segments
            18.1.12.4. Sales Footprint
            18.1.12.5. Strategy Overview
                18.1.12.5.1. Marketing Strategy
                18.1.12.5.2. Product Strategy
                18.1.12.5.3. Channel Strategy
        18.1.13. Uflex Limited.
            18.1.13.1. Overview
            18.1.13.2. Product Portfolio
            18.1.13.3. Profitability by Market Segments
            18.1.13.4. Sales Footprint
            18.1.13.5. Strategy Overview
                18.1.13.5.1. Marketing Strategy
                18.1.13.5.2. Product Strategy
                18.1.13.5.3. Channel Strategy
        18.1.14. Amerplast Ltd.
            18.1.14.1. Overview
            18.1.14.2. Product Portfolio
            18.1.14.3. Profitability by Market Segments
            18.1.14.4. Sales Footprint
            18.1.14.5. Strategy Overview
                18.1.14.5.1. Marketing Strategy
                18.1.14.5.2. Product Strategy
                18.1.14.5.3. Channel Strategy
19. Assumptions & Acronyms Used
20. Research Methodology
Recommendations

Food and Beverage

Middle East and North Africa Frozen Food Market

September 2023

REP-NF-243

315 pages

Food and Beverage

Frozen Pizza Market

June 2023

REP-GB-13329

342 pages

Explore Packaging Insights

View Reports
Future Market Insights

Frozen Food Packaging Market

Schedule a Call