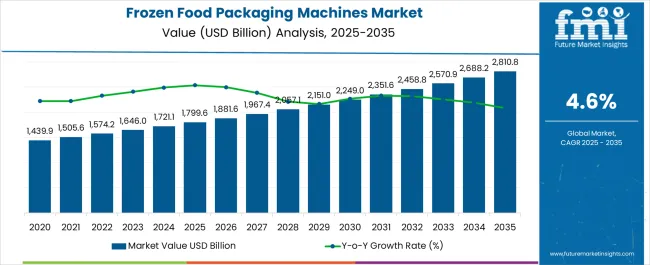
The Frozen Food Packaging Machines Market is estimated to be valued at USD 1799.6 billion in 2025 and is projected to reach USD 2810.8 billion by 2035, registering a compound annual growth rate (CAGR) of 4.6% over the forecast period.
| Metric | Value |
|---|---|
| Frozen Food Packaging Machines Market Estimated Value in (2025 E) | USD 1799.6 billion |
| Frozen Food Packaging Machines Market Forecast Value in (2035 F) | USD 2810.8 billion |
| Forecast CAGR (2025 to 2035) | 4.6% |
The frozen food packaging machines market is expanding steadily due to the growing consumption of convenience foods, rising global demand for longer shelf life products, and increasing reliance on efficient cold chain logistics. Manufacturers are focusing on packaging solutions that ensure product integrity, reduce contamination risks, and enhance visual appeal in retail environments.
Advancements in automation, smart sensors, and energy efficient technologies are driving machine adoption across diverse food categories. Regulatory requirements for food safety and traceability are further strengthening the role of advanced packaging machinery.
The market outlook remains positive as consumer lifestyles shift toward ready to eat and frozen meals, prompting sustained investment in machines that deliver both operational efficiency and compliance with evolving safety standards.
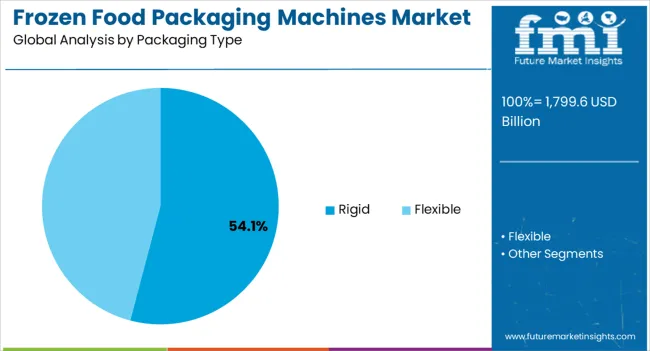
The rigid packaging type segment is expected to account for 54.10% of total market revenue by 2025 within the packaging type category, positioning it as the most prominent format. This growth is being driven by the need for robust and durable packaging that preserves product shape, protects against freezer burn, and withstands long storage periods.
Rigid packaging enhances shelf presentation and offers superior stackability during distribution and retail display. Additionally, consumer preference for tamper evident and resealable formats has contributed to increased adoption.
The ability to integrate rigid packaging with branding and labeling solutions has further reinforced its dominance within the packaging type segment.
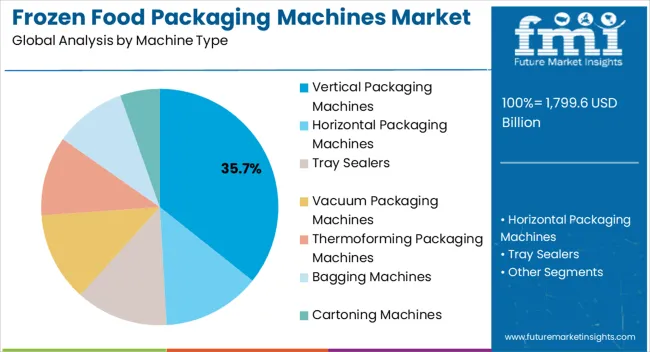
The vertical packaging machines segment is projected to hold 35.70% of total revenue by 2025 within the machine type category, making it the leading segment. This leadership is attributed to their space saving design, high speed performance, and versatility in handling multiple frozen food formats.
Vertical machines allow for efficient sealing and portioning, ensuring minimal product waste while maintaining packaging integrity. Their ability to integrate with automated filling systems has enhanced throughput and consistency, which are critical in frozen food operations.
As demand for efficiency, accuracy, and reduced downtime increases across food manufacturers, vertical packaging machines continue to strengthen their position in the market.
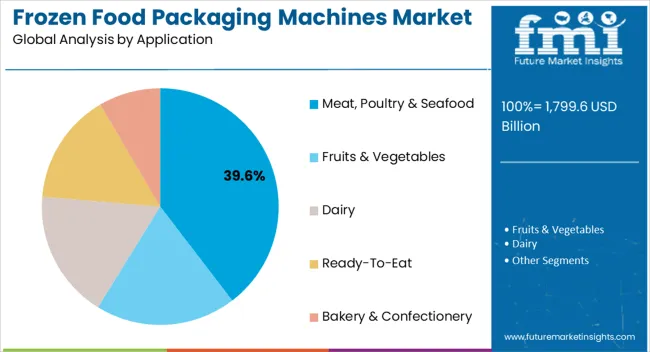
The meat poultry and seafood application segment is projected to generate 39.60% of total market revenue by 2025, making it the leading application area. This is largely influenced by the perishable nature of these products, which requires advanced packaging technologies to maintain freshness, prevent contamination, and extend shelf life.
Growing global consumption of animal protein and the expansion of international trade in frozen meat and seafood have intensified the demand for reliable packaging machinery. Investments in advanced sealing, modified atmosphere packaging, and vacuum technologies are also supporting adoption within this segment.
As food safety and quality standards become increasingly stringent, meat poultry and seafood applications continue to drive the largest share of the frozen food packaging machines market.
From 2020 to 2025, the global Frozen Food Packaging Machines market experienced a CAGR of 2.9%, reaching a market size of USD 1,563.5 million in 2025.
From 2020 to 2025, with the rise in the e-commerce sector and online grocery stores, the demand for frozen food has increased which drives the market growth. In addition, with the ability to store and preserve frozen foods with enhanced packaging the growth of the frozen food packaging machine can be seen. Substantial demand is witnessed for packaged food, as it is convenient and quick.
Looking ahead, the global frozen food packaging machines industry is expected to rise at a CAGR of 4.8% from 2025 to 2035. During the forecast period, the market size is expected to reach USD 2,618.6 million.
With the advancement in technology and the rise of e-commerce, the adoption rate of the frozen food is increasing. With the rise in the disposable income of consumers in emerging economies, there is a boost in the growth in the market. The convenience and the availability of ready-to-eat products is uplifting the market. Easy availability of frozen food at various retail outlets is likely to augment the demand frozen food packaging machines market.
East Asia & South Asia region holds the largest market share and dominates the growth of the market with the maximum number of key players in the market. The significant growth of the online grocery is further boosting the growth of the frozen food packaging machines market.
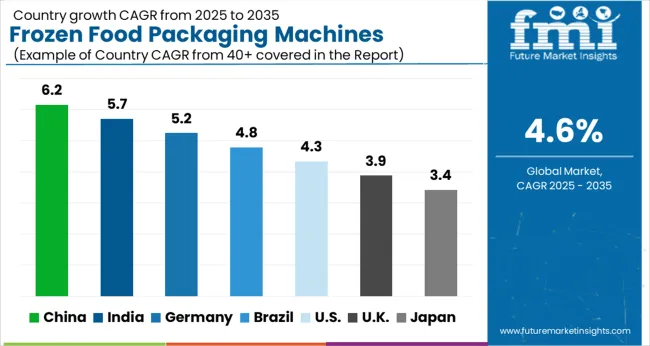
| Country | China |
|---|---|
| Market Size (USD million) by End of Forecast Period (2035) | USD 2810.8 million |
| CAGR % 2025 to End of Forecast (2035) | 6.5% |
The frozen food packaging machines industry in the China is expected to reach a market share of USD 2810.8 million by 2035, expanding at a CAGR of 6.5%. According to Mitsui & Co. Global Strategic Studies Institute (MGSSI), in recent years, with the expansion of supermarket operations, cold chain logistics networks are being developed.
Additionally, the Chinese government turned its attention to the development of cold chain logistics in December 2024 when it unveiled its first strategy (14th Five-Year strategy (2024-2025)).
The plan estimates that China's refrigerated and frozen warehouse capacity and refrigerated vehicle fleet size will be 1721.1 million m3 and 287,000 units, respectively, in 2024, two and two and a half times bigger than in 2020.
The government also plans to build a nationwide cold chain distribution network and increase the cold chain distribution rates for meat, fruits and vegetables, and marine products to 85%, 30%, and 85%, respectively, by 2025.
The prepared food market such as frozen food will continue to grow because of policy encouragement for the development of the cold chain logistics, which are essential to the distribution of prepared foods. Thus, this will have a positive impact on frozen food packaging machines market.
| Country | India |
|---|---|
| Market Size (USD million) by End of Forecast Period (2035) | USD 189.4 million |
| CAGR % 2025 to End of Forecast (2035) | 5.8% |
The frozen food packaging machines industry in India is anticipated to reach a market share of USD 189.4 million, moving at a CAGR of 5.8 % during the forecast period.
The rising trend of online grocery shopping is the main factor boosting the growth in the Indian market. In addition, with the rise in consumption of packaged food, the frozen food packaging market is growing in India.
The pouches segment is expected to dominate the frozen food packaging machines industry with a CAGR of 5.4% from 2025 to 2035. This segment captures a significant market share in 2025 due to the high demand ready to eat meals and takeaways.
Furthermore, pouches are lighter and take up less space, due to this; the manufacturers can save the transport cost and ship more products. Reusable pouches give consumers the choice to serve only a portion of the contents in the bag at once and store the rest for later, extending the shelf life of the products.
The vacuum packaging machine segment is expected to dominate the frozen food packaging machines industry with a CAGR of 4.8% from 2025 to 2035, due to its high efficiency, and helps to increase the shelf life of the products without having to add preservatives.
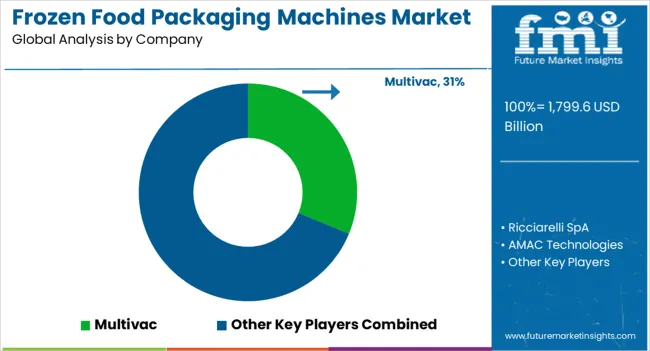
The major key players are focusing on research and development, which can increase the efficiency of the machine. The frozen food packaging machines industry is highly competitive, with many new players entering the market. In such a scenario, key players must adopt effective strategies to stay ahead of the competition.
Key Strategies Adopted by the Players
Strategic Partnerships and Collaborations
The major key players are collaborating with each other to gain competitive advantage, and also gain access to advanced technologies.
Increasing Product Efficiency and Accuracy
The major key players are focusing reducing the cost of the production and increase the efficiency and accuracy, which can be affordable for small and medium scale. This can eventually increase the adoption rate of the frozen food packaging machines.
Expansion into Emerging Markets
The major key players are investing and expanding their channels into the emerging economies which can help them gain market position. And will help them to increase their customer base.
The global frozen food packaging machines market is estimated to be valued at USD 1,799.6 billion in 2025.
The market size for the frozen food packaging machines market is projected to reach USD 2,810.8 billion by 2035.
The frozen food packaging machines market is expected to grow at a 4.6% CAGR between 2025 and 2035.
The key product types in frozen food packaging machines market are vertical packaging machines, horizontal packaging machines, tray sealers, vacuum packaging machines, thermoforming packaging machines, bagging machines and cartoning machines.
In terms of packaging type, rigid segment to command 54.1% share in the frozen food packaging machines market in 2025.


Our Research Products

The "Full Research Suite" delivers actionable market intel, deep dives on markets or technologies, so clients act faster, cut risk, and unlock growth.

The Leaderboard benchmarks and ranks top vendors, classifying them as Established Leaders, Leading Challengers, or Disruptors & Challengers.

Locates where complements amplify value and substitutes erode it, forecasting net impact by horizon

We deliver granular, decision-grade intel: market sizing, 5-year forecasts, pricing, adoption, usage, revenue, and operational KPIs—plus competitor tracking, regulation, and value chains—across 60 countries broadly.

Spot the shifts before they hit your P&L. We track inflection points, adoption curves, pricing moves, and ecosystem plays to show where demand is heading, why it is changing, and what to do next across high-growth markets and disruptive tech

Real-time reads of user behavior. We track shifting priorities, perceptions of today’s and next-gen services, and provider experience, then pace how fast tech moves from trial to adoption, blending buyer, consumer, and channel inputs with social signals (#WhySwitch, #UX).

Partner with our analyst team to build a custom report designed around your business priorities. From analysing market trends to assessing competitors or crafting bespoke datasets, we tailor insights to your needs.
Supplier Intelligence
Discovery & Profiling
Capacity & Footprint
Performance & Risk
Compliance & Governance
Commercial Readiness
Who Supplies Whom
Scorecards & Shortlists
Playbooks & Docs
Category Intelligence
Definition & Scope
Demand & Use Cases
Cost Drivers
Market Structure
Supply Chain Map
Trade & Policy
Operating Norms
Deliverables
Buyer Intelligence
Account Basics
Spend & Scope
Procurement Model
Vendor Requirements
Terms & Policies
Entry Strategy
Pain Points & Triggers
Outputs
Pricing Analysis
Benchmarks
Trends
Should-Cost
Indexation
Landed Cost
Commercial Terms
Deliverables
Brand Analysis
Positioning & Value Prop
Share & Presence
Customer Evidence
Go-to-Market
Digital & Reputation
Compliance & Trust
KPIs & Gaps
Outputs
Full Research Suite comprises of:
Market outlook & trends analysis
Interviews & case studies
Strategic recommendations
Vendor profiles & capabilities analysis
5-year forecasts
8 regions and 60+ country-level data splits
Market segment data splits
12 months of continuous data updates
DELIVERED AS:
PDF EXCEL ONLINE
Frozen Food Packaging Market Size and Share Forecast Outlook 2025 to 2035
Market Share Breakdown of Frozen Food Packaging Manufacturers
Food Packaging Machines Market Size and Share Forecast Outlook 2025 to 2035
Flexible Frozen Food Packaging Market Growth - Forecast 2025 to 2035
Food Packaging Film Market Size and Share Forecast Outlook 2025 to 2035
Food Packaging Films Market Size and Share Forecast Outlook 2025 to 2035
Food Packaging Tester Market Size and Share Forecast Outlook 2025 to 2035
Food Packaging Market Size, Share & Forecast 2025 to 2035
Market Share Breakdown of Food Packaging Film Providers
Food Packaging Equipment Market
Frozen Food Market Analysis - Size, Share, and Forecast Outlook 2025 to 2035
Market Share Insights in the Frozen Food Industry
Food Tub packaging Market Size and Share Forecast Outlook 2025 to 2035
Frozen Seafood Market Analysis by Nature, Form, End Use, Distribution Channel and Other Products Type Through 2035
Frozen Pet Food Market Size and Share Forecast Outlook 2025 to 2035
Seafood Packaging Market Size and Share Forecast Outlook 2025 to 2035
Seafood Packaging Market Size, Share & Forecast 2025 to 2035
Food Grade Packaging Market Insights – Demand, Size & Industry Trends 2025-2035
Evaluating Seafood Packaging Market Share & Provider Insights
Food Powder Packaging Machine Market Size and Share Forecast Outlook 2025 to 2035

Thank you!
You will receive an email from our Business Development Manager. Please be sure to check your SPAM/JUNK folder too.
Chat With
MaRIA