Reports

- Global Locations -

Headquarters

Future Market Insights, Inc.

Christiana Corporate, 200
Continental Drive, Suite 401,
Newark, Delaware - 19713,
United States

T: +1-845-579-5705

Americas

Future Market Insights, Inc.

616 Corporate Way, Suite 2-9018,
Valley Cottage, NY 10989, United States

T: +1-347-918-3531

MEA

Future Market Insights

1602-6 Jumeirah Bay X2 Tower, Plot No: JLT-PH2-X2A,
Jumeirah Lakes Towers, Dubai,
United Arab Emirates

Europe

Future Market Insights

3rd Floor, 207 Regent Street,
W1B 3HH London
United Kingdom

T: + 44 (0) 20 8123 9659
D: +44 (0) 20 3287 4268

Asia Pacific

Future Market Insights

IndiaLand Global Tech Park, Unit UG-1, Behind Grand HighStreet, Phase 1, Hinjawadi, MH, Pune – 411057, India

Frozen Fruits and Vegetables Market Outlook

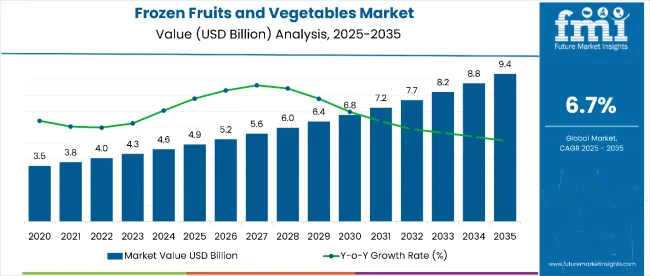
The frozen fruits and vegetables market is predicted to reach US$ 4.31 billion in 2023 and record a CAGR of 6.7% over the forecast period. The frozen fruit and vegetable market is projected to reach US$ 8.24 billion in value by 2033.

The frozen fruits and vegetables market is expected to rise due to rising demand from the food service and hospitality sectors. In the upcoming years, it is anticipated that the ongoing technological improvements and rising efficiency in the transportation and logistics sectors may strengthen the dynamics of demand in the global market.

The growing amount of investments made by public and private players to improve the cold chain infrastructure in several developing economies may have a positive effect on the sales of frozen fruits and vegetables, even though the demand for fresh, organically grown, and farm-to-table natural fruits and vegetables may restrain the frozen fruits and vegetables market growth.

The adoption of different products in the global frozen fruits and veggies market in the urban population is also being driven by the rising awareness among the global population regarding the importance of consuming fruits and vegetables to give the body the necessary nourishment and food components.

Don't pay for what you don't need

Customize your report by selecting specific countries or regions and save 30%!

Experimenting with New and Healthy Food

The main factors driving the frozen fruits and vegetables market growth are consumers' rising preferences for frozen goods, together with their curiosity about new knowledge and enthusiasm to sample foods with various nutritional benefits. Since some fruits and vegetables are only available during their specific seasons, freezing them makes off-season goods available all year long.

Extensive Need for E-commerce Platforms

The frozen fruits and vegetables market is becoming well-liked among consumers, especially young professionals, because of the product's simplicity of application and time savings. This scenario is anticipated to present prospective chances for the global market by offering new product variations. The mining industry's steady economic expansion over the past few years has improved job opportunities, raising average consumer income.

Restaurants and eateries all over the world are relying on frozen fruits and vegetables to meet the demand for unusual cuisine as a result of the increased penetration of e-commerce and online delivery services pushed by an accelerated lifestyle. According to this scenario, the global market may strengthen in the next years.

Attributes Details
Frozen Fruits and Vegetables Market CAGR (2023 to 2033) 6.7%
Frozen Fruits and Vegetables Market Size (2023) US$ 4.31 billion
Frozen Fruits and Vegetables Market Size (2033) US$ 8.24 billion
Nandini Roy Choudhury

Principal Consultant

Talk to Analyst

Find your sweet spots for generating winning opportunities in this market.

Consumption Analysis of Frozen Fruits and Vegetables (2018 to 2022) Compared to Market Estimates (2023 to 2033)

The frozen fruits and vegetables market has grown significantly over the past several years, with a CAGR of 6.7%, and was estimated to be worth US$ 4.31 billion in 2023. The market is anticipated to expand steadily as consumers become more aware of the advantages and uses of frozen fruits.

Fruits that are kept at a temperature where all the moisture is in a solid state are referred to as frozen fruits. To stop the growth of germs, these fruits are kept at a temperature of fewer than -9.5 degrees Celsius. As a result, the fruits stay fresh for a longer period and the process of decomposition is slowed down.

Fruits that have been frozen have higher levels of important vitamins and potentially beneficial antioxidants than fruit that have been freshly picked.

To Frozen Fruits, there are Essentially Two Techniques:

  • Individual Quick Freeze (IQF): It is a method for quickly freezing fruits and vegetables in which each piece is frozen separately utilizing a process called fluidization, which prevents the fruit from freezing as a single mass.
  • Freeze Drying: This process entails freezing the substance in question, followed by a reduction in pressure to allow frozen water to go directly from the solid to a liquid phase.

Rising consumption of frozen fruits is predicted to boost the market in the next years as the health and nutrition aspect of consumer food choices continues to dominate.

Market Potential

The Emergence of the Retail Industry

Frozen fruit and vegetable producers are going to have a lot of opportunities as a result of the food retail industry's digital revolution to upgrade their facilities and customer service to keep up with trends and meet consumer demand.

The significant potential is being created for the frozen fruit and vegetable market by the rise in customer preference for online grocery shopping due to its convenience and the availability of a large selection of frozen fruits and vegetables on online platforms.

The primary trend that is anticipated to drive the frozen fruits and vegetables market growth is grocery shopping online. Additionally, the manufacturers can sell their food goods and display a wide choice of products in many categories thanks to the online shopping platform.

Retail grocery shopping is becoming one of the platforms for frozen food makers to thrive in the market, in addition to rising smartphone and internet usage. Manufacturers of frozen fruits and vegetables should benefit greatly from changes in customer shopping habits and rising demand for fast supermarket shopping.

The industry is anticipated to grow at a faster rate because of characteristics like the convenience and a wide range of alternatives, which is anticipated to present a significant potential for the frozen fruits and vegetables market in North America.

Get the data you need at a Fraction of the cost

Personalize your report by choosing insights you need
and save 40%!

Constraints to Market Growth

A significant market restraint may come from the growing consumer preference for eating fresh and organic foods. Even though the market is witnessing an increase in demand for easy frozen fruit and vegetables, there are some restraints, like health consciousness toward the consumption of organic foods that can limit market expansion.

For a company to gain frozen fruits and vegetable market share, cold chain logistics are crucial. It is sure to prevent them from selling frozen food goods safely because building a cold chain infrastructure can be one of the hurdles. Due to a lack of investment in the cold chain logistics industry, several nations with growing economies are currently experiencing a financial crisis. This has an immediate effect on the market's import and export companies.

Comparative View of Adjacent Frozen Fruits and Vegetables Market

Frozen Fruits and Vegetables Market:

Attributes Frozen Fruits and Vegetables Market
CAGR (2023 to 2033) 6.7%
Market Value (2023) US$ 4.31 billion
Growth Factor An increase in interest in trying new foods.
Opportunity Frozen food is increasingly in demand on the market since it is very practical for customers who lead hectic lives.
Key Trends The use of e-commerce websites is widespread.

Frozen Food Market:

Attributes Frozen Food Market
CAGR (2023 to 2033) 5.2%
Market Value (2023) US$ 195.96 billion
Growth Factor The industry size is expected to rise due to customers' growing preference for shelf-stable goods on a global scale.
Opportunity Healthy eating is becoming more popular among consumers, which is anticipated to help business grow.
Key Trends The adoption of frozen food by a variety of end users, including full-service restaurants, hotels & resorts, and quick-service restaurants, is anticipated to further drive market expansion.

Processed & Frozen Vegetable Market:

Attributes Processed & Frozen Vegetable Market
CAGR (2023 to 2033) 3.9%
Market Value (2023) US$ 84.17 billion
Growth Factor The market expansion is being supported by the quickly growing processed food business, rising food product spending, and specifically packaged veggies.
Opportunity Urbanization, rising disposable income, and a growing middle-class population are all expected to fuel market expansion.
Key Trends The market for processed vegetables is rising in emerging nations due to the constant development of novel products and appealing packaging.

Segmentation Outlook

Which Distribution Channel is Exhibiting High Demand?

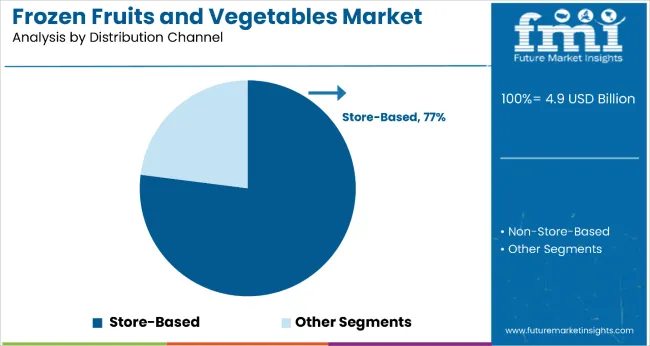
Through 2033, the offline sector held a frozen fruits and vegetables market share of more than 80% for frozen fruit and vegetables. The demand for frozen fruits can be met by brick-and-mortar stores with deep freezers and chest freezers. These include convenience stores, warehouse clubs, supercenters, and supermarkets.

Through 2033, the online distribution channel is anticipated to record a strong CAGR of 7.7%. The development of a sophisticated supply chain management system, which encompasses cross-contamination, cold-chain, and hygiene management, is a result of the online distribution of frozen fruits. The development of transportation, combined with shortened delivery times and product quality control, has been extremely important to the expansion of the market.

Regional Outlook

How is the North America Market Faring?

The demand for frozen fruits and vegetables in North America is rising as urbanization and the adoption of a healthy lifestyle expand. Additionally, rising canned and frozen food consumption contributes to the market's expansion. The frozen fruits and vegetables market participants' sales and profits are expanding as a result of the growing vegan population.

Individuals' busy schedules and changing lifestyles have accelerated the market's consumption trend for canned and frozen foods. Manufacturers have created numerous healthier alternatives and fresh, inventive launches as a result of the rise in consumption. Out of all the advancements, only fruits and vegetables are employed as ingredients in different canned and frozen foods.

The market may expand globally with so many new products being introduced and manufacturers shifting their focus to innovative frozen and canned fruits and vegetables. The sector is anticipated to experience more new product launches and developments as the frozen fruits and vegetables market expands, propelling the market toward a favorable escalation.

Why is Asia Pacific A Leading Market?

Consumer demand for shelf-stable food is expanding as a result of busy lifestyles. The demand for convenience foods has increased due to the growing number of working women and economic growth. Frozen desserts, ready-to-cook meals, and uncooked foods were once sold on the market.

Due to the shorter preparation time required for ready-to-cook frozen foods, convenience is the main factor affecting consumer preference. Frozen food products are now easily accessible thanks to growing technological developments, such as freezing technologies and a cold chain supply chain, which in turn supports the frozen fruits and vegetables market expansion.

Food that has been frozen is now more affordable as a result of new technology. The growth of the industry is impacted by elements such as how the flavors, particularly sweetness, fat content, and texture, alter fresh meals.

Why is Europe Dominating the Global Frozen Fruits and Vegetables Market?

The European market is expanding as a result of rising urbanization and rising acceptance of a healthy lifestyle. Food consumption is rising, which further fuels market expansion. The market participants' sales and profits are rising as a result of the growing vegan population.

The market demand is increasing as more people become aware of the health advantages of fruits and vegetables. The customer choice for healthy food alternatives is changing as a result of rising urbanization and high disposable income.

Due to its health advantages, vegetarian food like fruits and vegetables is preferable. The demand for fruits and vegetables is rising as a result of people's growing concerns about the nutritional value of food.

Numerous health advantages linked to the eating of fruits and vegetables are consequently luring many health-conscious consumers toward it, spurring the frozen fruits and vegetables market expansion.

How Competition Influences the Global Market? 

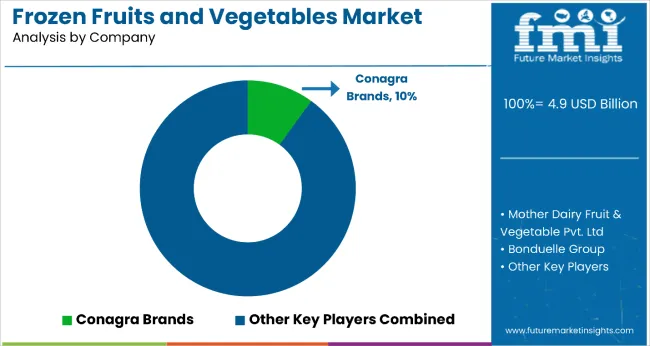
The key producers in the area are concentrating on supply chain optimization while stepping up production to meet the escalating frozen fruits and vegetables market demand. Producers use strategic alliances like acquisitions, joint ventures, and mergers to expand into new markets and maintain a sizable market share.

Recent Development:

  • Showcase
Date March 2016
Company Kendall Frozen Fruits
Details At the Southern California Institute of Food Technologists (SCIFT) Suppliers' Night held in Anaheim, United States, in March 2016, Kendall Frozen Fruits displayed their selection of frozen fruit.
Date July 2015
Company Welch Foods
Details Welch Foods displayed its product options, which included frozen fruit, at the Institute of Food Technologists (IFT) Annual Expo in Chicago, United States, in July 2015 to develop sales leads and attract media and customer interest.
Date February 2016
Company Ravifruit
Details To promote its product choices, Ravifruit, the frozen fruit division of Kerry Group, displayed its frozen fruit selections at the Gulfood 2016 international food and beverage expo in Dubai in February 2016. This event draws over 90,000 industry professionals.
  • Agreement
Date November 2018
Company Russia and Chinas
Details Russia is anticipated to start exporting frozen fruits and vegetables to China as a result of a trade agreement that the two countries struck in November 2018. This is anticipated to aid both nations in forging a relationship that benefits both. Products that can be frozen are exported to satisfy the hygienic and veterinary standards of China and Russia.
  • Acquisition
Date January 2016
Company Pinnacle Foods
Details In January 2016, Pinnacle Foods completed the acquisition of Boulder Brands Inc. to broaden its presence in the health & wellness category of products and refrigerated foods.
  • Opening
Date October 2018
Company Suguna Poultry Farm Ltd.
Details The opening of a cold storage facility in Tiruchi was announced by Suguna Poultry Farm Ltd. in October 2018. It has a 25-ton fruit and vegetable capacity. This is anticipated to provide you with juices and salads that are ready to eat.

Key Players

  • Dole Packaged Foods, LLC
  • Chiquita group
  • AGRANA Beteiligungs-AG (Dirafrost)
  • Ravifruit (Kerry Group)
  • SunOpta Grains and Foods, Inc.
  • Milne Fruit Products Inc.
  • SAS SICA SICODIS
  • Shimla Hills Offerings Pvt. Ltd.
  • Welch Foods, Inc.
  • ALDI Inc.
  • Meel Corporation
  • Kendall Frozen Fruits, Inc.
  • Small Planet Foods, Inc.
  • Nature’s Touch Frozen Foods Inc.
  • Capricorn Food Products India Ltd.
  • Inventure Foods, Inc.
  • Mitsui Foods Inc.

Key Segments

By Product Type:

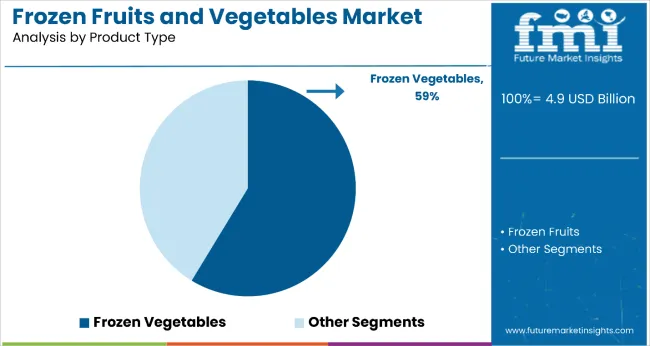
  • Frozen Vegetables
  • Frozen Fruits

By Distribution Channel:

  • Online
  • Offline

By Region:

  • North America
  • Asia Pacific
  • Europe
  • Latin America
  • Middle East Asia

Frequently Asked Questions

How Big is the Frozen Fruits and Vegetables Market?

The market is valued at US$ 4.31 billion in 2023.

Who are the Key Frozen Fruits and Vegetables Market Players?

Dole Food Company, Ardo NV, and HJ Heinzare are key market players.

Which Industry is the Key Consumer of the Frozen Fruits and Vegetables Market?

The primary consumer for the frozen fruits and vegetables market is the fast-moving consumer goods industry.

How Big Will the Frozen Fruits and Vegetables Market by 2033?

The market is estimated to reach US$ 8.24 billion by 2033.

What is the Growth Forecast for the Frozen Fruits and Vegetables Market?

The market is forecast to register a CAGR of 6.7% through 2033.

Table of Content

1. Executive Summary | Frozen Fruits and Vegetables Market 

    1.1. Global Market Outlook

    1.2. Demand-side Trends

    1.3. Supply-side Trends

    1.4. Technology Roadmap Analysis

    1.5. Analysis and Recommendations

2. Market Overview

    2.1. Market Coverage / Taxonomy

    2.2. Market Definition / Scope / Limitations

3. Market Background

    3.1. Market Dynamics

        3.1.1. Drivers

        3.1.2. Restraints

        3.1.3. Opportunity

        3.1.4. Trends

    3.2. Scenario Forecast

        3.2.1. Demand in Optimistic Scenario

        3.2.2. Demand in Likely Scenario

        3.2.3. Demand in Conservative Scenario

    3.3. Opportunity Map Analysis

    3.4. Product Life Cycle Analysis

    3.5. Supply Chain Analysis

        3.5.1. Supply Side Participants and their Roles

            3.5.1.1. Producers

            3.5.1.2. Mid-Level Participants (Traders/ Agents/ Brokers)

            3.5.1.3. Wholesalers and Distributors

        3.5.2. Value Added and Value Created at Node in the Supply Chain

        3.5.3. List of Raw Material Suppliers

        3.5.4. List of Existing and Potential Buyer’s

    3.6. Investment Feasibility Matrix

    3.7. Value Chain Analysis

        3.7.1. Profit Margin Analysis

        3.7.2. Wholesalers and Distributors

        3.7.3. Retailers

    3.8. PESTLE and Porter’s Analysis

    3.9. Regulatory Landscape

        3.9.1. By Key Regions

        3.9.2. By Key Countries

    3.10. Regional Parent Market Outlook

    3.11. Production and Consumption Statistics

    3.12. Import and Export Statistics

4. Global Market Analysis 2018 to 2022 and Forecast, 2023 to 2033

    4.1. Historical Market Size Value (US$ Million) & Volume (Tons) Analysis, 2018 to 2022

    4.2. Current and Future Market Size Value (US$ Million) & Volume (Tons) Projections, 2023 to 2033

        4.2.1. Y-o-Y Growth Trend Analysis

        4.2.2. Absolute $ Opportunity Analysis

5. Global Market Analysis 2018 to 2022 and Forecast 2023 to 2033, By Product Type

    5.1. Introduction / Key Findings

    5.2. Historical Market Size Value (US$ Million) & Volume (Tons) Analysis By Product Type, 2018 to 2022

    5.3. Current and Future Market Size Value (US$ Million) & Volume (Tons) Analysis and Forecast By Product Type, 2023 to 2033

        5.3.1. Frozen Fruits

            5.3.1.1. Melons

            5.3.1.2. Citrus Fruits

            5.3.1.3. Berries

            5.3.1.4. Mango

            5.3.1.5. Kiwi

            5.3.1.6. Berries

            5.3.1.7. Others

        5.3.2. Frozen Vegetables

            5.3.2.1. Peas

            5.3.2.2. Mushrooms

            5.3.2.3. Carrots

            5.3.2.4. Beans

            5.3.2.5. Others

    5.4. Y-o-Y Growth Trend Analysis By Product Type, 2018 to 2022

    5.5. Absolute $ Opportunity Analysis By Product Type, 2023 to 2033

6. Global Market Analysis 2018 to 2022 and Forecast 2023 to 2033, By Category

    6.1. Introduction / Key Findings

    6.2. Historical Market Size Value (US$ Million) & Volume (Tons) Analysis By Category, 2018 to 2022

    6.3. Current and Future Market Size Value (US$ Million) & Volume (Tons) Analysis and Forecast By Category, 2023 to 2033

        6.3.1. Organic

        6.3.2. Conventional

    6.4. Y-o-Y Growth Trend Analysis By Category, 2018 to 2022

    6.5. Absolute $ Opportunity Analysis By Category, 2023 to 2033

7. Global Market Analysis 2018 to 2022 and Forecast 2023 to 2033, By Distribution Channel

    7.1. Introduction / Key Findings

    7.2. Historical Market Size Value (US$ Million) & Volume (Tons) Analysis By Distribution Channel, 2018 to 2022

    7.3. Current and Future Market Size Value (US$ Million) & Volume (Tons) Analysis and Forecast By Distribution Channel, 2023 to 2033

        7.3.1. Store-Based

            7.3.1.1. Supermarkets & Hypermarkets

            7.3.1.2. Convenience Stores

            7.3.1.3. Online Retailers

        7.3.2. Non-Store-Based

    7.4. Y-o-Y Growth Trend Analysis By Distribution Channel, 2018 to 2022

    7.5. Absolute $ Opportunity Analysis By Distribution Channel, 2023 to 2033

8. Global Market Analysis 2018 to 2022 and Forecast 2023 to 2033, By Region

    8.1. Introduction

    8.2. Historical Market Size Value (US$ Million) & Volume (Tons) Analysis By Region, 2018 to 2022

    8.3. Current Market Size Value (US$ Million) & Volume (Tons) Analysis and Forecast By Region, 2023 to 2033

        8.3.1. North America

        8.3.2. Latin America

        8.3.3. Europe

        8.3.4. Asia Pacific

        8.3.5. MEA

    8.4. Market Attractiveness Analysis By Region

9. North America Market Analysis 2018 to 2022 and Forecast 2023 to 2033, By Country

    9.1. Historical Market Size Value (US$ Million) & Volume (Tons) Trend Analysis By Market Taxonomy, 2018 to 2022

    9.2. Market Size Value (US$ Million) & Volume (Tons) Forecast By Market Taxonomy, 2023 to 2033

        9.2.1. By Country

            9.2.1.1. USA

            9.2.1.2. Canada

        9.2.2. By Product Type

        9.2.3. By Category

        9.2.4. By Distribution Channel

    9.3. Market Attractiveness Analysis

        9.3.1. By Country

        9.3.2. By Product Type

        9.3.3. By Category

        9.3.4. By Distribution Channel

    9.4. Key Takeaways

10. Latin America Market Analysis 2018 to 2022 and Forecast 2023 to 2033, By Country

    10.1. Historical Market Size Value (US$ Million) & Volume (Tons) Trend Analysis By Market Taxonomy, 2018 to 2022

    10.2. Market Size Value (US$ Million) & Volume (Tons) Forecast By Market Taxonomy, 2023 to 2033

        10.2.1. By Country

            10.2.1.1. Brazil

            10.2.1.2. Mexico

            10.2.1.3. Rest of Latin America

        10.2.2. By Product Type

        10.2.3. By Category

        10.2.4. By Distribution Channel

    10.3. Market Attractiveness Analysis

        10.3.1. By Country

        10.3.2. By Product Type

        10.3.3. By Category

        10.3.4. By Distribution Channel

    10.4. Key Takeaways

11. Europe Market Analysis 2018 to 2022 and Forecast 2023 to 2033, By Country

    11.1. Historical Market Size Value (US$ Million) & Volume (Tons) Trend Analysis By Market Taxonomy, 2018 to 2022

    11.2. Market Size Value (US$ Million) & Volume (Tons) Forecast By Market Taxonomy, 2023 to 2033

        11.2.1. By Country

            11.2.1.1. Germany

            11.2.1.2. United Kingdom

            11.2.1.3. France

            11.2.1.4. Spain

            11.2.1.5. Italy

            11.2.1.6. Rest of Europe

        11.2.2. By Product Type

        11.2.3. By Category

        11.2.4. By Distribution Channel

    11.3. Market Attractiveness Analysis

        11.3.1. By Country

        11.3.2. By Product Type

        11.3.3. By Category

        11.3.4. By Distribution Channel

    11.4. Key Takeaways

12. Asia Pacific Market Analysis 2018 to 2022 and Forecast 2023 to 2033, By Country

    12.1. Historical Market Size Value (US$ Million) & Volume (Tons) Trend Analysis By Market Taxonomy, 2018 to 2022

    12.2. Market Size Value (US$ Million) & Volume (Tons) Forecast By Market Taxonomy, 2023 to 2033

        12.2.1. By Country

            12.2.1.1. China

            12.2.1.2. Japan

            12.2.1.3. South Korea

            12.2.1.4. Singapore

            12.2.1.5. Thailand

            12.2.1.6. Indonesia

            12.2.1.7. Australia

            12.2.1.8. New Zealand

            12.2.1.9. Rest of Asia Pacific

        12.2.2. By Product Type

        12.2.3. By Category

        12.2.4. By Distribution Channel

    12.3. Market Attractiveness Analysis

        12.3.1. By Country

        12.3.2. By Product Type

        12.3.3. By Category

        12.3.4. By Distribution Channel

    12.4. Key Takeaways

13. MEA Market Analysis 2018 to 2022 and Forecast 2023 to 2033, By Country

    13.1. Historical Market Size Value (US$ Million) & Volume (Tons) Trend Analysis By Market Taxonomy, 2018 to 2022

    13.2. Market Size Value (US$ Million) & Volume (Tons) Forecast By Market Taxonomy, 2023 to 2033

        13.2.1. By Country

            13.2.1.1. GCC Countries

            13.2.1.2. South Africa

            13.2.1.3. Israel

            13.2.1.4. Rest of MEA

        13.2.2. By Product Type

        13.2.3. By Category

        13.2.4. By Distribution Channel

    13.3. Market Attractiveness Analysis

        13.3.1. By Country

        13.3.2. By Product Type

        13.3.3. By Category

        13.3.4. By Distribution Channel

    13.4. Key Takeaways

14. Key Countries Market Analysis

    14.1. USA

        14.1.1. Pricing Analysis

        14.1.2. Market Share Analysis, 2022

            14.1.2.1. By Product Type

            14.1.2.2. By Category

            14.1.2.3. By Distribution Channel

    14.2. Canada

        14.2.1. Pricing Analysis

        14.2.2. Market Share Analysis, 2022

            14.2.2.1. By Product Type

            14.2.2.2. By Category

            14.2.2.3. By Distribution Channel

    14.3. Brazil

        14.3.1. Pricing Analysis

        14.3.2. Market Share Analysis, 2022

            14.3.2.1. By Product Type

            14.3.2.2. By Category

            14.3.2.3. By Distribution Channel

    14.4. Mexico

        14.4.1. Pricing Analysis

        14.4.2. Market Share Analysis, 2022

            14.4.2.1. By Product Type

            14.4.2.2. By Category

            14.4.2.3. By Distribution Channel

    14.5. Germany

        14.5.1. Pricing Analysis

        14.5.2. Market Share Analysis, 2022

            14.5.2.1. By Product Type

            14.5.2.2. By Category

            14.5.2.3. By Distribution Channel

    14.6. United Kingdom

        14.6.1. Pricing Analysis

        14.6.2. Market Share Analysis, 2022

            14.6.2.1. By Product Type

            14.6.2.2. By Category

            14.6.2.3. By Distribution Channel

    14.7. France

        14.7.1. Pricing Analysis

        14.7.2. Market Share Analysis, 2022

            14.7.2.1. By Product Type

            14.7.2.2. By Category

            14.7.2.3. By Distribution Channel

    14.8. Spain

        14.8.1. Pricing Analysis

        14.8.2. Market Share Analysis, 2022

            14.8.2.1. By Product Type

            14.8.2.2. By Category

            14.8.2.3. By Distribution Channel

    14.9. Italy

        14.9.1. Pricing Analysis

        14.9.2. Market Share Analysis, 2022

            14.9.2.1. By Product Type

            14.9.2.2. By Category

            14.9.2.3. By Distribution Channel

    14.10. China

        14.10.1. Pricing Analysis

        14.10.2. Market Share Analysis, 2022

            14.10.2.1. By Product Type

            14.10.2.2. By Category

            14.10.2.3. By Distribution Channel

    14.11. Japan

        14.11.1. Pricing Analysis

        14.11.2. Market Share Analysis, 2022

            14.11.2.1. By Product Type

            14.11.2.2. By Category

            14.11.2.3. By Distribution Channel

    14.12. South Korea

        14.12.1. Pricing Analysis

        14.12.2. Market Share Analysis, 2022

            14.12.2.1. By Product Type

            14.12.2.2. By Category

            14.12.2.3. By Distribution Channel

    14.13. Singapore

        14.13.1. Pricing Analysis

        14.13.2. Market Share Analysis, 2022

            14.13.2.1. By Product Type

            14.13.2.2. By Category

            14.13.2.3. By Distribution Channel

    14.14. Thailand

        14.14.1. Pricing Analysis

        14.14.2. Market Share Analysis, 2022

            14.14.2.1. By Product Type

            14.14.2.2. By Category

            14.14.2.3. By Distribution Channel

    14.15. Indonesia

        14.15.1. Pricing Analysis

        14.15.2. Market Share Analysis, 2022

            14.15.2.1. By Product Type

            14.15.2.2. By Category

            14.15.2.3. By Distribution Channel

    14.16. Australia

        14.16.1. Pricing Analysis

        14.16.2. Market Share Analysis, 2022

            14.16.2.1. By Product Type

            14.16.2.2. By Category

            14.16.2.3. By Distribution Channel

    14.17. New Zealand

        14.17.1. Pricing Analysis

        14.17.2. Market Share Analysis, 2022

            14.17.2.1. By Product Type

            14.17.2.2. By Category

            14.17.2.3. By Distribution Channel

    14.18. GCC Countries

        14.18.1. Pricing Analysis

        14.18.2. Market Share Analysis, 2022

            14.18.2.1. By Product Type

            14.18.2.2. By Category

            14.18.2.3. By Distribution Channel

    14.19. South Africa

        14.19.1. Pricing Analysis

        14.19.2. Market Share Analysis, 2022

            14.19.2.1. By Product Type

            14.19.2.2. By Category

            14.19.2.3. By Distribution Channel

    14.20. Israel

        14.20.1. Pricing Analysis

        14.20.2. Market Share Analysis, 2022

            14.20.2.1. By Product Type

            14.20.2.2. By Category

            14.20.2.3. By Distribution Channel

15. Market Structure Analysis

    15.1. Competition Dashboard

    15.2. Competition Benchmarking

    15.3. Market Share Analysis of Top Players

        15.3.1. By Regional

        15.3.2. By Product Type

        15.3.3. By Category

        15.3.4. By Distribution Channel

16. Competition Analysis

    16.1. Competition Deep Dive

        16.1.1. HJ Heinz

            16.1.1.1. Overview

            16.1.1.2. Product Portfolio

            16.1.1.3. Profitability by Market Segments

            16.1.1.4. Sales Footprint

            16.1.1.5. Strategy Overview

                16.1.1.5.1. Marketing Strategy

                16.1.1.5.2. Product Strategy

                16.1.1.5.3. Channel Strategy

        16.1.2. Findus Sverige AB

            16.1.2.1. Overview

            16.1.2.2. Product Portfolio

            16.1.2.3. Profitability by Market Segments

            16.1.2.4. Sales Footprint

            16.1.2.5. Strategy Overview

                16.1.2.5.1. Marketing Strategy

                16.1.2.5.2. Product Strategy

                16.1.2.5.3. Channel Strategy

        16.1.3. Simplot Australia PTY Ltd.

            16.1.3.1. Overview

            16.1.3.2. Product Portfolio

            16.1.3.3. Profitability by Market Segments

            16.1.3.4. Sales Footprint

            16.1.3.5. Strategy Overview

                16.1.3.5.1. Marketing Strategy

                16.1.3.5.2. Product Strategy

                16.1.3.5.3. Channel Strategy

        16.1.4. Pinnacle Foods Corp.

            16.1.4.1. Overview

            16.1.4.2. Product Portfolio

            16.1.4.3. Profitability by Market Segments

            16.1.4.4. Sales Footprint

            16.1.4.5. Strategy Overview

                16.1.4.5.1. Marketing Strategy

                16.1.4.5.2. Product Strategy

                16.1.4.5.3. Channel Strategy

        16.1.5. Bondeulle Group

            16.1.5.1. Overview

            16.1.5.2. Product Portfolio

            16.1.5.3. Profitability by Market Segments

            16.1.5.4. Sales Footprint

            16.1.5.5. Strategy Overview

                16.1.5.5.1. Marketing Strategy

                16.1.5.5.2. Product Strategy

                16.1.5.5.3. Channel Strategy

        16.1.6. SunOpta, Inc.

            16.1.6.1. Overview

            16.1.6.2. Product Portfolio

            16.1.6.3. Profitability by Market Segments

            16.1.6.4. Sales Footprint

            16.1.6.5. Strategy Overview

                16.1.6.5.1. Marketing Strategy

                16.1.6.5.2. Product Strategy

                16.1.6.5.3. Channel Strategy

        16.1.7. Fruktana Ltd.

            16.1.7.1. Overview

            16.1.7.2. Product Portfolio

            16.1.7.3. Profitability by Market Segments

            16.1.7.4. Sales Footprint

            16.1.7.5. Strategy Overview

                16.1.7.5.1. Marketing Strategy

                16.1.7.5.2. Product Strategy

                16.1.7.5.3. Channel Strategy

        16.1.8. Breukers Schamp Foods

            16.1.8.1. Overview

            16.1.8.2. Product Portfolio

            16.1.8.3. Profitability by Market Segments

            16.1.8.4. Sales Footprint

            16.1.8.5. Strategy Overview

                16.1.8.5.1. Marketing Strategy

                16.1.8.5.2. Product Strategy

                16.1.8.5.3. Channel Strategy

        16.1.9. Ardo N. V.

            16.1.9.1. Overview

            16.1.9.2. Product Portfolio

            16.1.9.3. Profitability by Market Segments

            16.1.9.4. Sales Footprint

            16.1.9.5. Strategy Overview

                16.1.9.5.1. Marketing Strategy

                16.1.9.5.2. Product Strategy

                16.1.9.5.3. Channel Strategy

        16.1.10. Dole

            16.1.10.1. Overview

            16.1.10.2. Product Portfolio

            16.1.10.3. Profitability by Market Segments

            16.1.10.4. Sales Footprint

            16.1.10.5. Strategy Overview

                16.1.10.5.1. Marketing Strategy

                16.1.10.5.2. Product Strategy

                16.1.10.5.3. Channel Strategy

        16.1.11. Capricorn Food Products India, Ltd.

            16.1.11.1. Overview

            16.1.11.2. Product Portfolio

            16.1.11.3. Profitability by Market Segments

            16.1.11.4. Sales Footprint

            16.1.11.5. Strategy Overview

                16.1.11.5.1. Marketing Strategy

                16.1.11.5.2. Product Strategy

                16.1.11.5.3. Channel Strategy

        16.1.12. Alasko Foods Inc.

            16.1.12.1. Overview

            16.1.12.2. Product Portfolio

            16.1.12.3. Profitability by Market Segments

            16.1.12.4. Sales Footprint

            16.1.12.5. Strategy Overview

                16.1.12.5.1. Marketing Strategy

                16.1.12.5.2. Product Strategy

                16.1.12.5.3. Channel Strategy

17. Assumptions & Acronyms Used

18. Research Methodology

List of Tables

Table 1: Global Market Value (US$ Million) Forecast by Region, 2018 to 2033

Table 2: Global Market Volume (Tons) Forecast by Region, 2018 to 2033

Table 3: Global Market Value (US$ Million) Forecast by Product Type, 2018 to 2033

Table 4: Global Market Volume (Tons) Forecast by Product Type, 2018 to 2033

Table 5: Global Market Value (US$ Million) Forecast by Category, 2018 to 2033

Table 6: Global Market Volume (Tons) Forecast by Category, 2018 to 2033

Table 7: Global Market Value (US$ Million) Forecast by Distribution Channel, 2018 to 2033

Table 8: Global Market Volume (Tons) Forecast by Distribution Channel, 2018 to 2033

Table 9: North America Market Value (US$ Million) Forecast by Country, 2018 to 2033

Table 10: North America Market Volume (Tons) Forecast by Country, 2018 to 2033

Table 11: North America Market Value (US$ Million) Forecast by Product Type, 2018 to 2033

Table 12: North America Market Volume (Tons) Forecast by Product Type, 2018 to 2033

Table 13: North America Market Value (US$ Million) Forecast by Category, 2018 to 2033

Table 14: North America Market Volume (Tons) Forecast by Category, 2018 to 2033

Table 15: North America Market Value (US$ Million) Forecast by Distribution Channel, 2018 to 2033

Table 16: North America Market Volume (Tons) Forecast by Distribution Channel, 2018 to 2033

Table 17: Latin America Market Value (US$ Million) Forecast by Country, 2018 to 2033

Table 18: Latin America Market Volume (Tons) Forecast by Country, 2018 to 2033

Table 19: Latin America Market Value (US$ Million) Forecast by Product Type, 2018 to 2033

Table 20: Latin America Market Volume (Tons) Forecast by Product Type, 2018 to 2033

Table 21: Latin America Market Value (US$ Million) Forecast by Category, 2018 to 2033

Table 22: Latin America Market Volume (Tons) Forecast by Category, 2018 to 2033

Table 23: Latin America Market Value (US$ Million) Forecast by Distribution Channel, 2018 to 2033

Table 24: Latin America Market Volume (Tons) Forecast by Distribution Channel, 2018 to 2033

Table 25: Europe Market Value (US$ Million) Forecast by Country, 2018 to 2033

Table 26: Europe Market Volume (Tons) Forecast by Country, 2018 to 2033

Table 27: Europe Market Value (US$ Million) Forecast by Product Type, 2018 to 2033

Table 28: Europe Market Volume (Tons) Forecast by Product Type, 2018 to 2033

Table 29: Europe Market Value (US$ Million) Forecast by Category, 2018 to 2033

Table 30: Europe Market Volume (Tons) Forecast by Category, 2018 to 2033

Table 31: Europe Market Value (US$ Million) Forecast by Distribution Channel, 2018 to 2033

Table 32: Europe Market Volume (Tons) Forecast by Distribution Channel, 2018 to 2033

Table 33: Asia Pacific Market Value (US$ Million) Forecast by Country, 2018 to 2033

Table 34: Asia Pacific Market Volume (Tons) Forecast by Country, 2018 to 2033

Table 35: Asia Pacific Market Value (US$ Million) Forecast by Product Type, 2018 to 2033

Table 36: Asia Pacific Market Volume (Tons) Forecast by Product Type, 2018 to 2033

Table 37: Asia Pacific Market Value (US$ Million) Forecast by Category, 2018 to 2033

Table 38: Asia Pacific Market Volume (Tons) Forecast by Category, 2018 to 2033

Table 39: Asia Pacific Market Value (US$ Million) Forecast by Distribution Channel, 2018 to 2033

Table 40: Asia Pacific Market Volume (Tons) Forecast by Distribution Channel, 2018 to 2033

Table 41: MEA Market Value (US$ Million) Forecast by Country, 2018 to 2033

Table 42: MEA Market Volume (Tons) Forecast by Country, 2018 to 2033

Table 43: MEA Market Value (US$ Million) Forecast by Product Type, 2018 to 2033

Table 44: MEA Market Volume (Tons) Forecast by Product Type, 2018 to 2033

Table 45: MEA Market Value (US$ Million) Forecast by Category, 2018 to 2033

Table 46: MEA Market Volume (Tons) Forecast by Category, 2018 to 2033

Table 47: MEA Market Value (US$ Million) Forecast by Distribution Channel, 2018 to 2033

Table 48: MEA Market Volume (Tons) Forecast by Distribution Channel, 2018 to 2033

List of Charts

Figure 1: Global Market Value (US$ Million) by Product Type, 2023 to 2033

Figure 2: Global Market Value (US$ Million) by Category, 2023 to 2033

Figure 3: Global Market Value (US$ Million) by Distribution Channel, 2023 to 2033

Figure 4: Global Market Value (US$ Million) by Region, 2023 to 2033

Figure 5: Global Market Value (US$ Million) Analysis by Region, 2018 to 2033

Figure 6: Global Market Volume (Tons) Analysis by Region, 2018 to 2033

Figure 7: Global Market Value Share (%) and BPS Analysis by Region, 2023 to 2033

Figure 8: Global Market Y-o-Y Growth (%) Projections by Region, 2023 to 2033

Figure 9: Global Market Value (US$ Million) Analysis by Product Type, 2018 to 2033

Figure 10: Global Market Volume (Tons) Analysis by Product Type, 2018 to 2033

Figure 11: Global Market Value Share (%) and BPS Analysis by Product Type, 2023 to 2033

Figure 12: Global Market Y-o-Y Growth (%) Projections by Product Type, 2023 to 2033

Figure 13: Global Market Value (US$ Million) Analysis by Category, 2018 to 2033

Figure 14: Global Market Volume (Tons) Analysis by Category, 2018 to 2033

Figure 15: Global Market Value Share (%) and BPS Analysis by Category, 2023 to 2033

Figure 16: Global Market Y-o-Y Growth (%) Projections by Category, 2023 to 2033

Figure 17: Global Market Value (US$ Million) Analysis by Distribution Channel, 2018 to 2033

Figure 18: Global Market Volume (Tons) Analysis by Distribution Channel, 2018 to 2033

Figure 19: Global Market Value Share (%) and BPS Analysis by Distribution Channel, 2023 to 2033

Figure 20: Global Market Y-o-Y Growth (%) Projections by Distribution Channel, 2023 to 2033

Figure 21: Global Market Attractiveness by Product Type, 2023 to 2033

Figure 22: Global Market Attractiveness by Category, 2023 to 2033

Figure 23: Global Market Attractiveness by Distribution Channel, 2023 to 2033

Figure 24: Global Market Attractiveness by Region, 2023 to 2033

Figure 25: North America Market Value (US$ Million) by Product Type, 2023 to 2033

Figure 26: North America Market Value (US$ Million) by Category, 2023 to 2033

Figure 27: North America Market Value (US$ Million) by Distribution Channel, 2023 to 2033

Figure 28: North America Market Value (US$ Million) by Country, 2023 to 2033

Figure 29: North America Market Value (US$ Million) Analysis by Country, 2018 to 2033

Figure 30: North America Market Volume (Tons) Analysis by Country, 2018 to 2033

Figure 31: North America Market Value Share (%) and BPS Analysis by Country, 2023 to 2033

Figure 32: North America Market Y-o-Y Growth (%) Projections by Country, 2023 to 2033

Figure 33: North America Market Value (US$ Million) Analysis by Product Type, 2018 to 2033

Figure 34: North America Market Volume (Tons) Analysis by Product Type, 2018 to 2033

Figure 35: North America Market Value Share (%) and BPS Analysis by Product Type, 2023 to 2033

Figure 36: North America Market Y-o-Y Growth (%) Projections by Product Type, 2023 to 2033

Figure 37: North America Market Value (US$ Million) Analysis by Category, 2018 to 2033

Figure 38: North America Market Volume (Tons) Analysis by Category, 2018 to 2033

Figure 39: North America Market Value Share (%) and BPS Analysis by Category, 2023 to 2033

Figure 40: North America Market Y-o-Y Growth (%) Projections by Category, 2023 to 2033

Figure 41: North America Market Value (US$ Million) Analysis by Distribution Channel, 2018 to 2033

Figure 42: North America Market Volume (Tons) Analysis by Distribution Channel, 2018 to 2033

Figure 43: North America Market Value Share (%) and BPS Analysis by Distribution Channel, 2023 to 2033

Figure 44: North America Market Y-o-Y Growth (%) Projections by Distribution Channel, 2023 to 2033

Figure 45: North America Market Attractiveness by Product Type, 2023 to 2033

Figure 46: North America Market Attractiveness by Category, 2023 to 2033

Figure 47: North America Market Attractiveness by Distribution Channel, 2023 to 2033

Figure 48: North America Market Attractiveness by Country, 2023 to 2033

Figure 49: Latin America Market Value (US$ Million) by Product Type, 2023 to 2033

Figure 50: Latin America Market Value (US$ Million) by Category, 2023 to 2033

Figure 51: Latin America Market Value (US$ Million) by Distribution Channel, 2023 to 2033

Figure 52: Latin America Market Value (US$ Million) by Country, 2023 to 2033

Figure 53: Latin America Market Value (US$ Million) Analysis by Country, 2018 to 2033

Figure 54: Latin America Market Volume (Tons) Analysis by Country, 2018 to 2033

Figure 55: Latin America Market Value Share (%) and BPS Analysis by Country, 2023 to 2033

Figure 56: Latin America Market Y-o-Y Growth (%) Projections by Country, 2023 to 2033

Figure 57: Latin America Market Value (US$ Million) Analysis by Product Type, 2018 to 2033

Figure 58: Latin America Market Volume (Tons) Analysis by Product Type, 2018 to 2033

Figure 59: Latin America Market Value Share (%) and BPS Analysis by Product Type, 2023 to 2033

Figure 60: Latin America Market Y-o-Y Growth (%) Projections by Product Type, 2023 to 2033

Figure 61: Latin America Market Value (US$ Million) Analysis by Category, 2018 to 2033

Figure 62: Latin America Market Volume (Tons) Analysis by Category, 2018 to 2033

Figure 63: Latin America Market Value Share (%) and BPS Analysis by Category, 2023 to 2033

Figure 64: Latin America Market Y-o-Y Growth (%) Projections by Category, 2023 to 2033

Figure 65: Latin America Market Value (US$ Million) Analysis by Distribution Channel, 2018 to 2033

Figure 66: Latin America Market Volume (Tons) Analysis by Distribution Channel, 2018 to 2033

Figure 67: Latin America Market Value Share (%) and BPS Analysis by Distribution Channel, 2023 to 2033

Figure 68: Latin America Market Y-o-Y Growth (%) Projections by Distribution Channel, 2023 to 2033

Figure 69: Latin America Market Attractiveness by Product Type, 2023 to 2033

Figure 70: Latin America Market Attractiveness by Category, 2023 to 2033

Figure 71: Latin America Market Attractiveness by Distribution Channel, 2023 to 2033

Figure 72: Latin America Market Attractiveness by Country, 2023 to 2033

Figure 73: Europe Market Value (US$ Million) by Product Type, 2023 to 2033

Figure 74: Europe Market Value (US$ Million) by Category, 2023 to 2033

Figure 75: Europe Market Value (US$ Million) by Distribution Channel, 2023 to 2033

Figure 76: Europe Market Value (US$ Million) by Country, 2023 to 2033

Figure 77: Europe Market Value (US$ Million) Analysis by Country, 2018 to 2033

Figure 78: Europe Market Volume (Tons) Analysis by Country, 2018 to 2033

Figure 79: Europe Market Value Share (%) and BPS Analysis by Country, 2023 to 2033

Figure 80: Europe Market Y-o-Y Growth (%) Projections by Country, 2023 to 2033

Figure 81: Europe Market Value (US$ Million) Analysis by Product Type, 2018 to 2033

Figure 82: Europe Market Volume (Tons) Analysis by Product Type, 2018 to 2033

Figure 83: Europe Market Value Share (%) and BPS Analysis by Product Type, 2023 to 2033

Figure 84: Europe Market Y-o-Y Growth (%) Projections by Product Type, 2023 to 2033

Figure 85: Europe Market Value (US$ Million) Analysis by Category, 2018 to 2033

Figure 86: Europe Market Volume (Tons) Analysis by Category, 2018 to 2033

Figure 87: Europe Market Value Share (%) and BPS Analysis by Category, 2023 to 2033

Figure 88: Europe Market Y-o-Y Growth (%) Projections by Category, 2023 to 2033

Figure 89: Europe Market Value (US$ Million) Analysis by Distribution Channel, 2018 to 2033

Figure 90: Europe Market Volume (Tons) Analysis by Distribution Channel, 2018 to 2033

Figure 91: Europe Market Value Share (%) and BPS Analysis by Distribution Channel, 2023 to 2033

Figure 92: Europe Market Y-o-Y Growth (%) Projections by Distribution Channel, 2023 to 2033

Figure 93: Europe Market Attractiveness by Product Type, 2023 to 2033

Figure 94: Europe Market Attractiveness by Category, 2023 to 2033

Figure 95: Europe Market Attractiveness by Distribution Channel, 2023 to 2033

Figure 96: Europe Market Attractiveness by Country, 2023 to 2033

Figure 97: Asia Pacific Market Value (US$ Million) by Product Type, 2023 to 2033

Figure 98: Asia Pacific Market Value (US$ Million) by Category, 2023 to 2033

Figure 99: Asia Pacific Market Value (US$ Million) by Distribution Channel, 2023 to 2033

Figure 100: Asia Pacific Market Value (US$ Million) by Country, 2023 to 2033

Figure 101: Asia Pacific Market Value (US$ Million) Analysis by Country, 2018 to 2033

Figure 102: Asia Pacific Market Volume (Tons) Analysis by Country, 2018 to 2033

Figure 103: Asia Pacific Market Value Share (%) and BPS Analysis by Country, 2023 to 2033

Figure 104: Asia Pacific Market Y-o-Y Growth (%) Projections by Country, 2023 to 2033

Figure 105: Asia Pacific Market Value (US$ Million) Analysis by Product Type, 2018 to 2033

Figure 106: Asia Pacific Market Volume (Tons) Analysis by Product Type, 2018 to 2033

Figure 107: Asia Pacific Market Value Share (%) and BPS Analysis by Product Type, 2023 to 2033

Figure 108: Asia Pacific Market Y-o-Y Growth (%) Projections by Product Type, 2023 to 2033

Figure 109: Asia Pacific Market Value (US$ Million) Analysis by Category, 2018 to 2033

Figure 110: Asia Pacific Market Volume (Tons) Analysis by Category, 2018 to 2033

Figure 111: Asia Pacific Market Value Share (%) and BPS Analysis by Category, 2023 to 2033

Figure 112: Asia Pacific Market Y-o-Y Growth (%) Projections by Category, 2023 to 2033

Figure 113: Asia Pacific Market Value (US$ Million) Analysis by Distribution Channel, 2018 to 2033

Figure 114: Asia Pacific Market Volume (Tons) Analysis by Distribution Channel, 2018 to 2033

Figure 115: Asia Pacific Market Value Share (%) and BPS Analysis by Distribution Channel, 2023 to 2033

Figure 116: Asia Pacific Market Y-o-Y Growth (%) Projections by Distribution Channel, 2023 to 2033

Figure 117: Asia Pacific Market Attractiveness by Product Type, 2023 to 2033

Figure 118: Asia Pacific Market Attractiveness by Category, 2023 to 2033

Figure 119: Asia Pacific Market Attractiveness by Distribution Channel, 2023 to 2033

Figure 120: Asia Pacific Market Attractiveness by Country, 2023 to 2033

Figure 121: MEA Market Value (US$ Million) by Product Type, 2023 to 2033

Figure 122: MEA Market Value (US$ Million) by Category, 2023 to 2033

Figure 123: MEA Market Value (US$ Million) by Distribution Channel, 2023 to 2033

Figure 124: MEA Market Value (US$ Million) by Country, 2023 to 2033

Figure 125: MEA Market Value (US$ Million) Analysis by Country, 2018 to 2033

Figure 126: MEA Market Volume (Tons) Analysis by Country, 2018 to 2033

Figure 127: MEA Market Value Share (%) and BPS Analysis by Country, 2023 to 2033

Figure 128: MEA Market Y-o-Y Growth (%) Projections by Country, 2023 to 2033

Figure 129: MEA Market Value (US$ Million) Analysis by Product Type, 2018 to 2033

Figure 130: MEA Market Volume (Tons) Analysis by Product Type, 2018 to 2033

Figure 131: MEA Market Value Share (%) and BPS Analysis by Product Type, 2023 to 2033

Figure 132: MEA Market Y-o-Y Growth (%) Projections by Product Type, 2023 to 2033

Figure 133: MEA Market Value (US$ Million) Analysis by Category, 2018 to 2033

Figure 134: MEA Market Volume (Tons) Analysis by Category, 2018 to 2033

Figure 135: MEA Market Value Share (%) and BPS Analysis by Category, 2023 to 2033

Figure 136: MEA Market Y-o-Y Growth (%) Projections by Category, 2023 to 2033

Figure 137: MEA Market Value (US$ Million) Analysis by Distribution Channel, 2018 to 2033

Figure 138: MEA Market Volume (Tons) Analysis by Distribution Channel, 2018 to 2033

Figure 139: MEA Market Value Share (%) and BPS Analysis by Distribution Channel, 2023 to 2033

Figure 140: MEA Market Y-o-Y Growth (%) Projections by Distribution Channel, 2023 to 2033

Figure 141: MEA Market Attractiveness by Product Type, 2023 to 2033

Figure 142: MEA Market Attractiveness by Category, 2023 to 2033

Figure 143: MEA Market Attractiveness by Distribution Channel, 2023 to 2033

Figure 144: MEA Market Attractiveness by Country, 2023 to 2033

Recommendations

Food and Beverage

Middle East and North Africa Frozen Food Market

Published : September 2023

Packaging

Frozen Food Packaging Market

Published : January 2023

Explore Food and Beverage Insights

View Reports

Frozen Fruits and Vegetables Market