Cheese Powder Market Size and Share Forecast Outlook 2025 to 2035

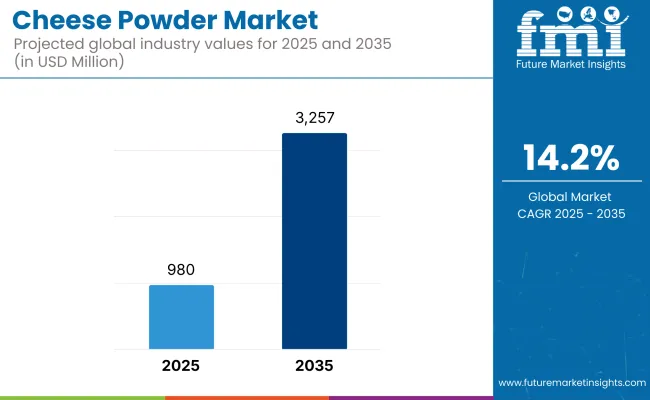
The cheese powder market is set to demonstrate exponential expansion, growing from a baseline valuation of USD 980 million in 2025 to reach an impressive USD 3,257 million by 2035.
Cheese Powder Market

This growth trajectory reflects a compelling CAGR of 14.2% over the assessment period. Among various geographies, North America is positioned as the most lucrative market in 2025, owing to the entrenched consumption of cheese-infused snacks and sauces. Meanwhile, the Asia Pacific region is forecasted to be the fastest-growing market during the same period, propelled by rising westernization of diets, increased snacking behaviors, and growing demand for dairy-based convenience foods.

Strong momentum in the cheese powder market has been catalyzed by a shift toward shelf-stable dairy alternatives, particularly for applications in ready-to-eat meals, bakery, dry snacks, and sauces. Increasing urbanization and fast-paced consumer lifestyles have encouraged demand for powdered ingredients that deliver authentic cheese flavor without requiring refrigeration. However, market expansion is somewhat restrained by formulation challenges, such as flavor volatility during spray drying and textural concerns in processed foods.

Additionally, the rising preference for clean-label and allergen-free products has added pressure on manufacturers to reformulate without compromising taste. Key trends influencing the landscape include the use of novel cheese blends (e.g., smoked, truffle, blue cheese powders), organic and non-GMO claims, and application-specific innovation targeting plant-based snacks and gluten-free baking mixes.

Market participants are seen investing in functional formulation technologies, improving solubility and emulsification properties of cheese powders, and exploring lactose-free or vegan alternatives for niche segments.

Looking ahead from 2025 to 2035, cheese powder demand is expected to be significantly shaped by the convergence of functional food trends and convenience. The market will likely witness increased cross-category adoption-from baby food and meal kits to gourmet seasoning blends. Sustainable sourcing of cheese inputs, alongside innovations in drying technologies to improve nutrient retention, will become critical differentiators.

Product development aligned with consumer expectations for intense taste, low sodium, and fortified nutrition is projected to influence both premium and mainstream segments. With digital retail and D2C formats gaining traction, the market is anticipated to expand beyond industrial foodservice into high-end culinary and at-home preparation formats, offering long-term value creation opportunities.
Analyzing Cheese Powder Market by Top Investment Segments

Cheddar Cheese Powder Remains a Flavor Foundation in Mainstream and Premium Innovation

Cheese Powder Market By Product

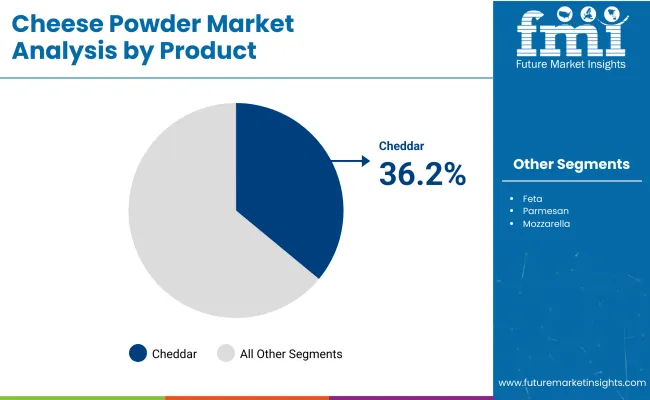
Cheddar cheese powder holds the largest share of the global cheese powder market at 36.2% in 2025. This dominant position reflects its deep integration across both industrial and consumer-facing food categories, amid a broader market growing at a 14.2% CAGR through 2035.

Cheddar’s appeal has been consistently reinforced by its sharp yet adaptable flavor profile and cost-efficient processing advantages. It has been favored by food technologists for delivering consistent sensory impact across dry and wet matrices-critical in snack seasonings, sauces, and dehydrated meals. In the coming decade, the segment is expected to maintain its leadership not only through volume but also through formulation versatility, particularly as the line between indulgent and better-for-you snacking continues to blur.

The segment is also poised to benefit from rising clean-label adaptations, such as non-GMO and organic cheddar powder formats, as well as regional innovations like aged or smoked cheddar profiles tailored to gourmet consumer preferences.

Strategically, cheddar cheese powder will continue serving as the baseline for hybrid cheese blends and functional seasoning systems. As application formats diversify and demand for high-impact yet shelf-stable dairy solutions grows globally, cheddar powder’s technical reliability and broad consumer familiarity will position it as the most scalable vector of cheese flavor delivery in the decade ahead.

Asia Pacific Positioned as the New Frontier for Cheese Powder Expansion

The Asia Pacific region is forecasted to register the fastest CAGR of 16.5% between 2025 and 2035 in the global cheese powder market. While North America leads in absolute market value, Asia Pacific’s growth trajectory reflects transformative shifts in dietary patterns, foodservice formats, and processed food consumption across emerging economies.

This growth has been driven by the accelerating westernization of diets in countries such as China, India, Indonesia, and Vietnam, where cheese-once a niche or unfamiliar ingredient-is now increasingly embedded in everyday meals, QSR menus, and fusion cuisines.

The rapid expansion of middle-income populations, urban living, and dual-income households has fueled consumer demand for indulgent yet convenient foods, making cheese powder an attractive format for snack, instant meal, and ready-to-cook categories. Moreover, low ambient storage requirements and cost-effective reconstitution give cheese powder a logistical edge in regions with limited cold chain infrastructure.

Looking ahead, Asia Pacific is likely to evolve from a consumption-driven region to one of production and innovation. Local manufacturers are already seen investing in dairy processing infrastructure, regional flavor profiling, and clean-label adaptations to suit local palates and regulatory frameworks. As multinational and regional players intensify competition, the region will define the next wave of application-driven growth in cheese powders.

Challenges and Opportunities in the Cheese Powder Market

Challenges

Regulatory Compliance and Health Concerns

Entrenched among the dominant imperfections in the cheese powder market is the stringent regulatory standards and health concerns surrounding processed as well as powdered dairy products. Regulatory agencies around the world are working to create tighter guidelines around food additives, preservatives and labelling practices, making manufacturers more transparent and focused on natural ingredient lists.

Moreover, consumers have become health-conscious which is anticipated to spur the demand for low-sodium, reduced-fat, and clean-label cheese powders. Retooling products to meet these changing expectations without sacrificing taste and texture is no small challenge.

To overcome this, companies need to invest in R&D to explore alternative processing techniques such as spray-drying that retains flavor without the negative nutritional implications. In addition, in order to meet regulatory approval and maintain consumer trust, complying with food safety standards in the supply chain is ensured by further quality control investments and compliance management across global supply chain networks.

Opportunities

Rising Demand for Convenience Foods and Plant-Based Alternatives

Cheese powder market is witnessing a huge opportunity from the growing demand for convenience foods and plant-based cheese alternatives. Cheese powders are taking off in snack foods, ready-to-eat meals and seasoning applications as consumers look for convenient and shelf-stable cheese products.

Furthermore, the rising population of vegan and lactose-intolerant consumers is fuelling the demand for plant-based cheese powders produced from nuts, soy, and other dairy alternatives. Instead of cash, companies are using cutting-edge food tech including microbial fermentation and enzyme modification, to develop dairy-free cheese powders that closely match conventional cheese flavours.

As e-commerce and foodservice industries continue to grow, opportunities for creative cheese powder applications like gourmet popcorn toppings, flavored pasta seasonings, and savory meal kit enhancers also expand. This unique spin on breakfast informs recipes and products, allowing factory producers to capitalize on consumer desires for ease of access and dietary involvement, all while leveraging new revenue opportunities and market expansion.
Country-wise Outlook - Cheese Powder Market

Cheese Powder Market By Country

United States

Increasing consumer demand for convenient long shelf-life dairy and dairy products catalyses the growth of the cheese powder market in the United States. Growing use of cheese-containing snacks, ready-to-eat foods, and seasoning in food service and retail sectors greatly supports the growth of the market.

Moreover, the demand for natural cheese powders with reduced-fat products is instigating manufacturers to offer clean-label and organic cheese powder, Induced by health aware consumers. Innovations in drying and flavor-enhancing technologies enhance cheese powder, which is used in a variety of processed food applications, supporting market growth.

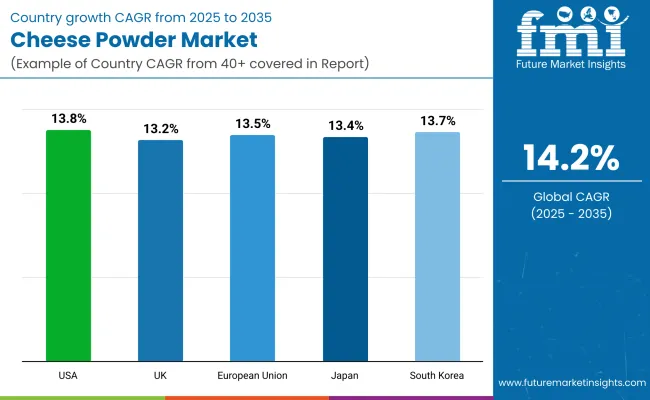
Country CAGR (2025 to 2035)
United States 13.8%

United Kingdom

In the UK, the cheese powder market is growing due to the changing consumer behaviour preferences towards convenience products and gourmet snack products. The use of cheese powder in a variety of ready-to-eat meals, bakery products, and savory snacks has steadily increased. Looking further, the rising demand for plant-based cheese powders with the growing category of the vegan and vegetarian population is also changing the game for the cheese powder industry.

In addition, stringent food safety standards and a growing preference for natural and clean-label cheese powders catalyse manufacturers to innovate and improve product quality, thereby sustaining steady market growth.

Country CAGR (2025 to 2035)
United Kingdom 13.2%

European Union

The cheese powder in the European Union accounts for a significant fraction, led by France, Germany, and Italy. Growth is primarily driven by the strong dairy production industry, along with the wide use of cheese powder in processed foods, sauces, and seasonings.

The popularity of premium, organic, and plant-based cheese powders is another driving force for the market, as consumer preferences shift prompted by climate change and evolving diets. Furthermore, cheese-flavored snacks and convenience food products are gaining a lot of popularity, which is encouraging manufacturers to expand their product portfolios thus driving the ever-advancing growth of the market.

Country CAGR (2025 to 2035)
European Union 13.5%

Japan

The cheese powder market is booming in Japan as cheese flavors are being incorporated into instant ramen, chips, and bakery products as it adds flavors to food.

Western-style fast foods, and cheese-flavored snacks have helped the expansion of that market. Japanese consumers favour mild, umami rich cheese powders, drawing the necessity for new and local formulations. Moreover, technology improvements in food processing allow manufacturers to improve the taste, texture and application versatility of cheese powders, which propel the market growth.

Country CAGR (2025 to 2035)
Japan 13.4%

South Korea

Instant foods, snacks and ready-made seasonings while drive the cheese powder mystery in South Korea as well. Rising trends towards Western diet and the growing fast food sector have propelled the demand for cheese powders and their applications across food. The influence of social media and K-food trends is also behind the cheese-flavored phenomena.

Moreover, with the increasing health-conscious consumer segment, there is a demand for natural, and organic, and low-fat cheese powder options that will continue to fuel market growth.

Country CAGR (2025 to 2035)
South Korea 13.7%

Key Company Insights

Cheese Powder Market By Company

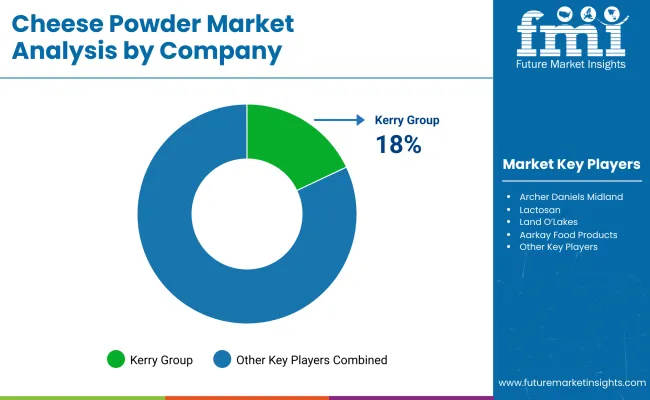
Kerry Group (18-22%)

Kerry Group is a major player in cheese powder solutions for snacks, soups, and bakery, with competencies in customized applications. The company's emphasis on clean-label and plant-based cheese powder formulations serves the needs of health-conscious consumer trends.

Archer Daniels Midland (ADM) (15-20%)

ADM's extensive portfolio of both dairy-based and plant-based cheese powders is meeting evolving consumer preferences. The firm places resources into sustainable bounce sourcing and flavor advancement to reinforce its economic position.

Lactosan (10-15%)

Lactosan specializes in enzyme-modified cheese powders, which provide excellent opportunities of gaining authentic cheese flavor in your food application, while maximizing the utilization of the cheese. The business's focus is that of extending its collection along with natural and natural cheese powder offerings.

Land O’Lakes (8-12%)

Land O’Lakes, a producer of high-end dairy-based cheese powders, and other products that find their way into snack foods, seasonings and sauces. In pursuit of superior product quality, the company utilizes advanced drying and flavor enhancing technologies.

Aarkay Food Products (5-10%)

Aarkay Food Products focuses on natural cheese powders, which suit different regional taste profiles. To keep pace with the increasing demand for vegan-friendly food, the plant-based cheese powder company has decided to expand its range of products.

Other Key Players (30-40% Combined)

Market growth is driven by new entrants as well as established players, each of whom has their own lenses on innovation and sustainability. Notable companies include:

  • Sensient Technologies - Develops high-intensity cheese powders with extended shelf life.
  • Takasago International - Specializes in regional cheese powder flavors for global applications.
  • Firmenich - Offers premium cheese powder extracts for gourmet and processed foods.
  • Bell Flavors & Fragrances - Focuses on customized cheese powder blends for seasoning applications.

Key Segments

By Type:

  • Natural
  • Processed

By Product:

  • Cheddar
  • Feta
  • Parmesan
  • Mozzarella
  • Roquefort
  • Others

By Source:

  • Cow Milk
  • Buffalo Milk
  • Sheep Milk
  • Goat Milk

By Distribution Channel:

  • Supermarkets
  • Food Specialty Stores
  • Hypermarkets
  • Convenience Stores
  • Others

By Application:

  • Savoury Snacks
  • Extruded Snacks
  • Wafer
  • Chips dusting
  • Instant Soup Premixes
  • Others

By Region:

  • North America
  • Latin America
  • Europe
  • Asia Pacific
  • Middle East and Africa (MEA)

Table of Content

  1. Executive Summary
  2. Industry Introduction, including Taxonomy and Market Definition
  3. Market Trends and Success Factors, including Macro-economic Factors, Market Dynamics, and Recent Industry Developments
  4. Global Market Demand Analysis 2020 to 2024 and Forecast 2025 to 2035, including Historical Analysis and Future Projections
  5. Pricing Analysis
  6. Global Market Analysis 2020 to 2024 and Forecast 2025 to 2035
    • Type
    • Product
    • Source
  7. Global Market Analysis 2020 to 2024 and Forecast 2025 to 2035, By Type
    • Natural
    • Processed
  8. Global Market Analysis 2020 to 2024 and Forecast 2025 to 2035, By Product
    • Cheddar
    • Feta
    • Parmesan
    • Mozzarella
    • Roquefort
    • Others
  9. Global Market Analysis 2020 to 2024 and Forecast 2025 to 2035, By Source
    • Cow Milk
    • Buffalo Milk
    • Sheep Milk
    • Goat Milk
  10. Global Market Analysis 2020 to 2024 and Forecast 2025 to 2035, By Region
    • North America
    • Latin America
    • Western Europe
    • Eastern Europe
    • East Asia
    • South Asia Pacific
    • Middle East and Africa
  11. North America Sales Analysis 2020 to 2024 and Forecast 2025 to 2035, by Key Segments and Countries
  12. Latin America Sales Analysis 2020 to 2024 and Forecast 2025 to 2035, by Key Segments and Countries
  13. Western Europe Sales Analysis 2020 to 2024 and Forecast 2025 to 2035, by Key Segments and Countries
  14. Eastern Europe Sales Analysis 2020 to 2024 and Forecast 2025 to 2035, by Key Segments and Countries
  15. East Asia Sales Analysis 2020 to 2024 and Forecast 2025 to 2035, by Key Segments and Countries
  16. South Asia Pacific Sales Analysis 2020 to 2024 and Forecast 2025 to 2035, by Key Segments and Countries
  17. Middle East and Africa Sales Analysis 2020 to 2024 and Forecast 2025 to 2035, by Key Segments and Countries
  18. Sales Forecast 2025 to 2035 by Type, Product, and Source for 30 Countries
  19. Competition Outlook, including Market Structure Analysis, Company Share Analysis by Key Players, and Competition Dashboard
  20. Company Profile
    • The Kraft Heinz Company
    • Almarai
    • Kerry Group PLC
    • Archer Daniels Midland
    • Kanegrade Limited
    • Land O'Lakes, Inc.
    • Commercial Creamery Company / Associated Milk Producers Inc.
    • Arla Foods
    • GCMMF (Amul)
    • Lactosan A/S

List of Tables

  • Table 1: Global Market Value (USD Million) Forecast by Region, 2020 to 2035
  • Table 2: Global Market Volume (MT) Forecast by Region, 2020 to 2035
  • Table 3: Global Market Value (USD Million) Forecast by Type, 2020 to 2035
  • Table 4: Global Market Volume (MT) Forecast by Type, 2020 to 2035
  • Table 5: Global Market Value (USD Million) Forecast by Product, 2020 to 2035
  • Table 6: Global Market Volume (MT) Forecast by Product, 2020 to 2035
  • Table 7: Global Market Value (USD Million) Forecast by Source, 2020 to 2035
  • Table 8: Global Market Volume (MT) Forecast by Source, 2020 to 2035
  • Table 9: Global Market Value (USD Million) Forecast by Distribution Channel, 2020 to 2035
  • Table 10: Global Market Volume (MT) Forecast by Distribution Channel, 2020 to 2035
  • Table 11: Global Market Value (USD Million) Forecast by Application, 2020 to 2035
  • Table 12: Global Market Volume (MT) Forecast by Application, 2020 to 2035
  • Table 13: North America Market Value (USD Million) Forecast by Country, 2020 to 2035
  • Table 14: North America Market Volume (MT) Forecast by Country, 2020 to 2035
  • Table 15: North America Market Value (USD Million) Forecast by Type, 2020 to 2035
  • Table 16: North America Market Volume (MT) Forecast by Type, 2020 to 2035
  • Table 17: North America Market Value (USD Million) Forecast by Product, 2020 to 2035
  • Table 18: North America Market Volume (MT) Forecast by Product, 2020 to 2035
  • Table 19: North America Market Value (USD Million) Forecast by Source, 2020 to 2035
  • Table 20: North America Market Volume (MT) Forecast by Source, 2020 to 2035
  • Table 21: North America Market Value (USD Million) Forecast by Distribution Channel, 2020 to 2035
  • Table 22: North America Market Volume (MT) Forecast by Distribution Channel, 2020 to 2035
  • Table 23: North America Market Value (USD Million) Forecast by Application, 2020 to 2035
  • Table 24: North America Market Volume (MT) Forecast by Application, 2020 to 2035
  • Table 25: Latin America Market Value (USD Million) Forecast by Country, 2020 to 2035
  • Table 26: Latin America Market Volume (MT) Forecast by Country, 2020 to 2035
  • Table 27: Latin America Market Value (USD Million) Forecast by Type, 2020 to 2035
  • Table 28: Latin America Market Volume (MT) Forecast by Type, 2020 to 2035
  • Table 29: Latin America Market Value (USD Million) Forecast by Product, 2020 to 2035
  • Table 30: Latin America Market Volume (MT) Forecast by Product, 2020 to 2035
  • Table 31: Latin America Market Value (USD Million) Forecast by Source, 2020 to 2035
  • Table 32: Latin America Market Volume (MT) Forecast by Source, 2020 to 2035
  • Table 33: Latin America Market Value (USD Million) Forecast by Distribution Channel, 2020 to 2035
  • Table 34: Latin America Market Volume (MT) Forecast by Distribution Channel, 2020 to 2035
  • Table 35: Latin America Market Value (USD Million) Forecast by Application, 2020 to 2035
  • Table 36: Latin America Market Volume (MT) Forecast by Application, 2020 to 2035
  • Table 37: Western Europe Market Value (USD Million) Forecast by Country, 2020 to 2035
  • Table 38: Western Europe Market Volume (MT) Forecast by Country, 2020 to 2035
  • Table 39: Western Europe Market Value (USD Million) Forecast by Type, 2020 to 2035
  • Table 40: Western Europe Market Volume (MT) Forecast by Type, 2020 to 2035
  • Table 41: Western Europe Market Value (USD Million) Forecast by Product, 2020 to 2035
  • Table 42: Western Europe Market Volume (MT) Forecast by Product, 2020 to 2035
  • Table 43: Western Europe Market Value (USD Million) Forecast by Source, 2020 to 2035
  • Table 44: Western Europe Market Volume (MT) Forecast by Source, 2020 to 2035
  • Table 45: Western Europe Market Value (USD Million) Forecast by Distribution Channel, 2020 to 2035
  • Table 46: Western Europe Market Volume (MT) Forecast by Distribution Channel, 2020 to 2035
  • Table 47: Western Europe Market Value (USD Million) Forecast by Application, 2020 to 2035
  • Table 48: Western Europe Market Volume (MT) Forecast by Application, 2020 to 2035
  • Table 49: Eastern Europe Market Value (USD Million) Forecast by Country, 2020 to 2035
  • Table 50: Eastern Europe Market Volume (MT) Forecast by Country, 2020 to 2035
  • Table 51: Eastern Europe Market Value (USD Million) Forecast by Type, 2020 to 2035
  • Table 52: Eastern Europe Market Volume (MT) Forecast by Type, 2020 to 2035
  • Table 53: Eastern Europe Market Value (USD Million) Forecast by Product, 2020 to 2035
  • Table 54: Eastern Europe Market Volume (MT) Forecast by Product, 2020 to 2035
  • Table 55: Eastern Europe Market Value (USD Million) Forecast by Source, 2020 to 2035
  • Table 56: Eastern Europe Market Volume (MT) Forecast by Source, 2020 to 2035
  • Table 57: Eastern Europe Market Value (USD Million) Forecast by Distribution Channel, 2020 to 2035
  • Table 58: Eastern Europe Market Volume (MT) Forecast by Distribution Channel, 2020 to 2035
  • Table 59: Eastern Europe Market Value (USD Million) Forecast by Application, 2020 to 2035
  • Table 60: Eastern Europe Market Volume (MT) Forecast by Application, 2020 to 2035
  • Table 61: South Asia and Pacific Market Value (USD Million) Forecast by Country, 2020 to 2035
  • Table 62: South Asia and Pacific Market Volume (MT) Forecast by Country, 2020 to 2035
  • Table 63: South Asia and Pacific Market Value (USD Million) Forecast by Type, 2020 to 2035
  • Table 64: South Asia and Pacific Market Volume (MT) Forecast by Type, 2020 to 2035
  • Table 65: South Asia and Pacific Market Value (USD Million) Forecast by Product, 2020 to 2035
  • Table 66: South Asia and Pacific Market Volume (MT) Forecast by Product, 2020 to 2035
  • Table 67: South Asia and Pacific Market Value (USD Million) Forecast by Source, 2020 to 2035
  • Table 68: South Asia and Pacific Market Volume (MT) Forecast by Source, 2020 to 2035
  • Table 69: South Asia and Pacific Market Value (USD Million) Forecast by Distribution Channel, 2020 to 2035
  • Table 70: South Asia and Pacific Market Volume (MT) Forecast by Distribution Channel, 2020 to 2035
  • Table 71: South Asia and Pacific Market Value (USD Million) Forecast by Application, 2020 to 2035
  • Table 72: South Asia and Pacific Market Volume (MT) Forecast by Application, 2020 to 2035
  • Table 73: East Asia Market Value (USD Million) Forecast by Country, 2020 to 2035
  • Table 74: East Asia Market Volume (MT) Forecast by Country, 2020 to 2035
  • Table 75: East Asia Market Value (USD Million) Forecast by Type, 2020 to 2035
  • Table 76: East Asia Market Volume (MT) Forecast by Type, 2020 to 2035
  • Table 77: East Asia Market Value (USD Million) Forecast by Product, 2020 to 2035
  • Table 78: East Asia Market Volume (MT) Forecast by Product, 2020 to 2035
  • Table 79: East Asia Market Value (USD Million) Forecast by Source, 2020 to 2035
  • Table 80: East Asia Market Volume (MT) Forecast by Source, 2020 to 2035
  • Table 81: East Asia Market Value (USD Million) Forecast by Distribution Channel, 2020 to 2035
  • Table 82: East Asia Market Volume (MT) Forecast by Distribution Channel, 2020 to 2035
  • Table 83: East Asia Market Value (USD Million) Forecast by Application, 2020 to 2035
  • Table 84: East Asia Market Volume (MT) Forecast by Application, 2020 to 2035
  • Table 85: Middle East and Africa Market Value (USD Million) Forecast by Country, 2020 to 2035
  • Table 86: Middle East and Africa Market Volume (MT) Forecast by Country, 2020 to 2035
  • Table 87: Middle East and Africa Market Value (USD Million) Forecast by Type, 2020 to 2035
  • Table 88: Middle East and Africa Market Volume (MT) Forecast by Type, 2020 to 2035
  • Table 89: Middle East and Africa Market Value (USD Million) Forecast by Product, 2020 to 2035
  • Table 90: Middle East and Africa Market Volume (MT) Forecast by Product, 2020 to 2035
  • Table 91: Middle East and Africa Market Value (USD Million) Forecast by Source, 2020 to 2035
  • Table 92: Middle East and Africa Market Volume (MT) Forecast by Source, 2020 to 2035
  • Table 93: Middle East and Africa Market Value (USD Million) Forecast by Distribution Channel, 2020 to 2035
  • Table 94: Middle East and Africa Market Volume (MT) Forecast by Distribution Channel, 2020 to 2035
  • Table 95: Middle East and Africa Market Value (USD Million) Forecast by Application, 2020 to 2035
  • Table 96: Middle East and Africa Market Volume (MT) Forecast by Application, 2020 to 2035

List of Figures

  • Figure 1: Global Market Value (USD Million) by Type, 2025 to 2035
  • Figure 2: Global Market Value (USD Million) by Product, 2025 to 2035
  • Figure 3: Global Market Value (USD Million) by Source, 2025 to 2035
  • Figure 4: Global Market Value (USD Million) by Distribution Channel, 2025 to 2035
  • Figure 5: Global Market Value (USD Million) by Application, 2025 to 2035
  • Figure 6: Global Market Value (USD Million) by Region, 2025 to 2035
  • Figure 7: Global Market Value (USD Million) Analysis by Region, 2020 to 2035
  • Figure 8: Global Market Volume (MT) Analysis by Region, 2020 to 2035
  • Figure 9: Global Market Value Share (%) and BPS Analysis by Region, 2025 to 2035
  • Figure 10: Global Market Y-o-Y Growth (%) Projections by Region, 2025 to 2035
  • Figure 11: Global Market Value (USD Million) Analysis by Type, 2020 to 2035
  • Figure 12: Global Market Volume (MT) Analysis by Type, 2020 to 2035
  • Figure 13: Global Market Value Share (%) and BPS Analysis by Type, 2025 to 2035
  • Figure 14: Global Market Y-o-Y Growth (%) Projections by Type, 2025 to 2035
  • Figure 15: Global Market Value (USD Million) Analysis by Product, 2020 to 2035
  • Figure 16: Global Market Volume (MT) Analysis by Product, 2020 to 2035
  • Figure 17: Global Market Value Share (%) and BPS Analysis by Product, 2025 to 2035
  • Figure 18: Global Market Y-o-Y Growth (%) Projections by Product, 2025 to 2035
  • Figure 19: Global Market Value (USD Million) Analysis by Source, 2020 to 2035
  • Figure 20: Global Market Volume (MT) Analysis by Source, 2020 to 2035
  • Figure 21: Global Market Value Share (%) and BPS Analysis by Source, 2025 to 2035
  • Figure 22: Global Market Y-o-Y Growth (%) Projections by Source, 2025 to 2035
  • Figure 23: Global Market Value (USD Million) Analysis by Distribution Channel, 2020 to 2035
  • Figure 24: Global Market Volume (MT) Analysis by Distribution Channel, 2020 to 2035
  • Figure 25: Global Market Value Share (%) and BPS Analysis by Distribution Channel, 2025 to 2035
  • Figure 26: Global Market Y-o-Y Growth (%) Projections by Distribution Channel, 2025 to 2035
  • Figure 27: Global Market Value (USD Million) Analysis by Application, 2020 to 2035
  • Figure 28: Global Market Volume (MT) Analysis by Application, 2020 to 2035
  • Figure 29: Global Market Value Share (%) and BPS Analysis by Application, 2025 to 2035
  • Figure 30: Global Market Y-o-Y Growth (%) Projections by Application, 2025 to 2035
  • Figure 31: Global Market Attractiveness by Type, 2025 to 2035
  • Figure 32: Global Market Attractiveness by Product, 2025 to 2035
  • Figure 33: Global Market Attractiveness by Source, 2025 to 2035
  • Figure 34: Global Market Attractiveness by Distribution Channel, 2025 to 2035
  • Figure 35: Global Market Attractiveness by Application, 2025 to 2035
  • Figure 36: Global Market Attractiveness by Region, 2025 to 2035
  • Figure 37: North America Market Value (USD Million) by Type, 2025 to 2035
  • Figure 38: North America Market Value (USD Million) by Product, 2025 to 2035
  • Figure 39: North America Market Value (USD Million) by Source, 2025 to 2035
  • Figure 40: North America Market Value (USD Million) by Distribution Channel, 2025 to 2035
  • Figure 41: North America Market Value (USD Million) by Application, 2025 to 2035
  • Figure 42: North America Market Value (USD Million) by Country, 2025 to 2035
  • Figure 43: North America Market Value (USD Million) Analysis by Country, 2020 to 2035
  • Figure 44: North America Market Volume (MT) Analysis by Country, 2020 to 2035
  • Figure 45: North America Market Value Share (%) and BPS Analysis by Country, 2025 to 2035
  • Figure 46: North America Market Y-o-Y Growth (%) Projections by Country, 2025 to 2035
  • Figure 47: North America Market Value (USD Million) Analysis by Type, 2020 to 2035
  • Figure 48: North America Market Volume (MT) Analysis by Type, 2020 to 2035
  • Figure 49: North America Market Value Share (%) and BPS Analysis by Type, 2025 to 2035
  • Figure 50: North America Market Y-o-Y Growth (%) Projections by Type, 2025 to 2035
  • Figure 51: North America Market Value (USD Million) Analysis by Product, 2020 to 2035
  • Figure 52: North America Market Volume (MT) Analysis by Product, 2020 to 2035
  • Figure 53: North America Market Value Share (%) and BPS Analysis by Product, 2025 to 2035
  • Figure 54: North America Market Y-o-Y Growth (%) Projections by Product, 2025 to 2035
  • Figure 55: North America Market Value (USD Million) Analysis by Source, 2020 to 2035
  • Figure 56: North America Market Volume (MT) Analysis by Source, 2020 to 2035
  • Figure 57: North America Market Value Share (%) and BPS Analysis by Source, 2025 to 2035
  • Figure 58: North America Market Y-o-Y Growth (%) Projections by Source, 2025 to 2035
  • Figure 59: North America Market Value (USD Million) Analysis by Distribution Channel, 2020 to 2035
  • Figure 60: North America Market Volume (MT) Analysis by Distribution Channel, 2020 to 2035
  • Figure 61: North America Market Value Share (%) and BPS Analysis by Distribution Channel, 2025 to 2035
  • Figure 62: North America Market Y-o-Y Growth (%) Projections by Distribution Channel, 2025 to 2035
  • Figure 63: North America Market Value (USD Million) Analysis by Application, 2020 to 2035
  • Figure 64: North America Market Volume (MT) Analysis by Application, 2020 to 2035
  • Figure 65: North America Market Value Share (%) and BPS Analysis by Application, 2025 to 2035
  • Figure 66: North America Market Y-o-Y Growth (%) Projections by Application, 2025 to 2035
  • Figure 67: North America Market Attractiveness by Type, 2025 to 2035
  • Figure 68: North America Market Attractiveness by Product, 2025 to 2035
  • Figure 69: North America Market Attractiveness by Source, 2025 to 2035
  • Figure 70: North America Market Attractiveness by Distribution Channel, 2025 to 2035
  • Figure 71: North America Market Attractiveness by Application, 2025 to 2035
  • Figure 72: North America Market Attractiveness by Country, 2025 to 2035
  • Figure 73: Latin America Market Value (USD Million) by Type, 2025 to 2035
  • Figure 74: Latin America Market Value (USD Million) by Product, 2025 to 2035
  • Figure 75: Latin America Market Value (USD Million) by Source, 2025 to 2035
  • Figure 76: Latin America Market Value (USD Million) by Distribution Channel, 2025 to 2035
  • Figure 77: Latin America Market Value (USD Million) by Application, 2025 to 2035
  • Figure 78: Latin America Market Value (USD Million) by Country, 2025 to 2035
  • Figure 79: Latin America Market Value (USD Million) Analysis by Country, 2020 to 2035
  • Figure 80: Latin America Market Volume (MT) Analysis by Country, 2020 to 2035
  • Figure 81: Latin America Market Value Share (%) and BPS Analysis by Country, 2025 to 2035
  • Figure 82: Latin America Market Y-o-Y Growth (%) Projections by Country, 2025 to 2035
  • Figure 83: Latin America Market Value (USD Million) Analysis by Type, 2020 to 2035
  • Figure 84: Latin America Market Volume (MT) Analysis by Type, 2020 to 2035
  • Figure 85: Latin America Market Value Share (%) and BPS Analysis by Type, 2025 to 2035
  • Figure 86: Latin America Market Y-o-Y Growth (%) Projections by Type, 2025 to 2035
  • Figure 87: Latin America Market Value (USD Million) Analysis by Product, 2020 to 2035
  • Figure 88: Latin America Market Volume (MT) Analysis by Product, 2020 to 2035
  • Figure 89: Latin America Market Value Share (%) and BPS Analysis by Product, 2025 to 2035
  • Figure 90: Latin America Market Y-o-Y Growth (%) Projections by Product, 2025 to 2035
  • Figure 91: Latin America Market Value (USD Million) Analysis by Source, 2020 to 2035
  • Figure 92: Latin America Market Volume (MT) Analysis by Source, 2020 to 2035
  • Figure 93: Latin America Market Value Share (%) and BPS Analysis by Source, 2025 to 2035
  • Figure 94: Latin America Market Y-o-Y Growth (%) Projections by Source, 2025 to 2035
  • Figure 95: Latin America Market Value (USD Million) Analysis by Distribution Channel, 2020 to 2035
  • Figure 96: Latin America Market Volume (MT) Analysis by Distribution Channel, 2020 to 2035
  • Figure 97: Latin America Market Value Share (%) and BPS Analysis by Distribution Channel, 2025 to 2035
  • Figure 98: Latin America Market Y-o-Y Growth (%) Projections by Distribution Channel, 2025 to 2035
  • Figure 99: Latin America Market Value (USD Million) Analysis by Application, 2020 to 2035
  • Figure 100: Latin America Market Volume (MT) Analysis by Application, 2020 to 2035
  • Figure 101: Latin America Market Value Share (%) and BPS Analysis by Application, 2025 to 2035
  • Figure 102: Latin America Market Y-o-Y Growth (%) Projections by Application, 2025 to 2035
  • Figure 103: Latin America Market Attractiveness by Type, 2025 to 2035
  • Figure 104: Latin America Market Attractiveness by Product, 2025 to 2035
  • Figure 105: Latin America Market Attractiveness by Source, 2025 to 2035
  • Figure 106: Latin America Market Attractiveness by Distribution Channel, 2025 to 2035
  • Figure 107: Latin America Market Attractiveness by Application, 2025 to 2035
  • Figure 108: Latin America Market Attractiveness by Country, 2025 to 2035
  • Figure 109: Western Europe Market Value (USD Million) by Type, 2025 to 2035
  • Figure 110: Western Europe Market Value (USD Million) by Product, 2025 to 2035
  • Figure 111: Western Europe Market Value (USD Million) by Source, 2025 to 2035
  • Figure 112: Western Europe Market Value (USD Million) by Distribution Channel, 2025 to 2035
  • Figure 113: Western Europe Market Value (USD Million) by Application, 2025 to 2035
  • Figure 114: Western Europe Market Value (USD Million) by Country, 2025 to 2035
  • Figure 115: Western Europe Market Value (USD Million) Analysis by Country, 2020 to 2035
  • Figure 116: Western Europe Market Volume (MT) Analysis by Country, 2020 to 2035
  • Figure 117: Western Europe Market Value Share (%) and BPS Analysis by Country, 2025 to 2035
  • Figure 118: Western Europe Market Y-o-Y Growth (%) Projections by Country, 2025 to 2035
  • Figure 119: Western Europe Market Value (USD Million) Analysis by Type, 2020 to 2035
  • Figure 120: Western Europe Market Volume (MT) Analysis by Type, 2020 to 2035
  • Figure 121: Western Europe Market Value Share (%) and BPS Analysis by Type, 2025 to 2035
  • Figure 122: Western Europe Market Y-o-Y Growth (%) Projections by Type, 2025 to 2035
  • Figure 123: Western Europe Market Value (USD Million) Analysis by Product, 2020 to 2035
  • Figure 124: Western Europe Market Volume (MT) Analysis by Product, 2020 to 2035
  • Figure 125: Western Europe Market Value Share (%) and BPS Analysis by Product, 2025 to 2035
  • Figure 126: Western Europe Market Y-o-Y Growth (%) Projections by Product, 2025 to 2035
  • Figure 127: Western Europe Market Value (USD Million) Analysis by Source, 2020 to 2035
  • Figure 128: Western Europe Market Volume (MT) Analysis by Source, 2020 to 2035
  • Figure 129: Western Europe Market Value Share (%) and BPS Analysis by Source, 2025 to 2035
  • Figure 130: Western Europe Market Y-o-Y Growth (%) Projections by Source, 2025 to 2035
  • Figure 131: Western Europe Market Value (USD Million) Analysis by Distribution Channel, 2020 to 2035
  • Figure 132: Western Europe Market Volume (MT) Analysis by Distribution Channel, 2020 to 2035
  • Figure 133: Western Europe Market Value Share (%) and BPS Analysis by Distribution Channel, 2025 to 2035
  • Figure 134: Western Europe Market Y-o-Y Growth (%) Projections by Distribution Channel, 2025 to 2035
  • Figure 135: Western Europe Market Value (USD Million) Analysis by Application, 2020 to 2035
  • Figure 136: Western Europe Market Volume (MT) Analysis by Application, 2020 to 2035
  • Figure 137: Western Europe Market Value Share (%) and BPS Analysis by Application, 2025 to 2035
  • Figure 138: Western Europe Market Y-o-Y Growth (%) Projections by Application, 2025 to 2035
  • Figure 139: Western Europe Market Attractiveness by Type, 2025 to 2035
  • Figure 140: Western Europe Market Attractiveness by Product, 2025 to 2035
  • Figure 141: Western Europe Market Attractiveness by Source, 2025 to 2035
  • Figure 142: Western Europe Market Attractiveness by Distribution Channel, 2025 to 2035
  • Figure 143: Western Europe Market Attractiveness by Application, 2025 to 2035
  • Figure 144: Western Europe Market Attractiveness by Country, 2025 to 2035
  • Figure 145: Eastern Europe Market Value (USD Million) by Type, 2025 to 2035
  • Figure 146: Eastern Europe Market Value (USD Million) by Product, 2025 to 2035
  • Figure 147: Eastern Europe Market Value (USD Million) by Source, 2025 to 2035
  • Figure 148: Eastern Europe Market Value (USD Million) by Distribution Channel, 2025 to 2035
  • Figure 149: Eastern Europe Market Value (USD Million) by Application, 2025 to 2035
  • Figure 150: Eastern Europe Market Value (USD Million) by Country, 2025 to 2035
  • Figure 151: Eastern Europe Market Value (USD Million) Analysis by Country, 2020 to 2035
  • Figure 152: Eastern Europe Market Volume (MT) Analysis by Country, 2020 to 2035
  • Figure 153: Eastern Europe Market Value Share (%) and BPS Analysis by Country, 2025 to 2035
  • Figure 154: Eastern Europe Market Y-o-Y Growth (%) Projections by Country, 2025 to 2035
  • Figure 155: Eastern Europe Market Value (USD Million) Analysis by Type, 2020 to 2035
  • Figure 156: Eastern Europe Market Volume (MT) Analysis by Type, 2020 to 2035
  • Figure 157: Eastern Europe Market Value Share (%) and BPS Analysis by Type, 2025 to 2035
  • Figure 158: Eastern Europe Market Y-o-Y Growth (%) Projections by Type, 2025 to 2035
  • Figure 159: Eastern Europe Market Value (USD Million) Analysis by Product, 2020 to 2035
  • Figure 160: Eastern Europe Market Volume (MT) Analysis by Product, 2020 to 2035
  • Figure 161: Eastern Europe Market Value Share (%) and BPS Analysis by Product, 2025 to 2035
  • Figure 162: Eastern Europe Market Y-o-Y Growth (%) Projections by Product, 2025 to 2035
  • Figure 163: Eastern Europe Market Value (USD Million) Analysis by Source, 2020 to 2035
  • Figure 164: Eastern Europe Market Volume (MT) Analysis by Source, 2020 to 2035
  • Figure 165: Eastern Europe Market Value Share (%) and BPS Analysis by Source, 2025 to 2035
  • Figure 166: Eastern Europe Market Y-o-Y Growth (%) Projections by Source, 2025 to 2035
  • Figure 167: Eastern Europe Market Value (USD Million) Analysis by Distribution Channel, 2020 to 2035
  • Figure 168: Eastern Europe Market Volume (MT) Analysis by Distribution Channel, 2020 to 2035
  • Figure 169: Eastern Europe Market Value Share (%) and BPS Analysis by Distribution Channel, 2025 to 2035
  • Figure 170: Eastern Europe Market Y-o-Y Growth (%) Projections by Distribution Channel, 2025 to 2035
  • Figure 171: Eastern Europe Market Value (USD Million) Analysis by Application, 2020 to 2035
  • Figure 172: Eastern Europe Market Volume (MT) Analysis by Application, 2020 to 2035
  • Figure 173: Eastern Europe Market Value Share (%) and BPS Analysis by Application, 2025 to 2035
  • Figure 174: Eastern Europe Market Y-o-Y Growth (%) Projections by Application, 2025 to 2035
  • Figure 175: Eastern Europe Market Attractiveness by Type, 2025 to 2035
  • Figure 176: Eastern Europe Market Attractiveness by Product, 2025 to 2035
  • Figure 177: Eastern Europe Market Attractiveness by Source, 2025 to 2035
  • Figure 178: Eastern Europe Market Attractiveness by Distribution Channel, 2025 to 2035
  • Figure 179: Eastern Europe Market Attractiveness by Application, 2025 to 2035
  • Figure 180: Eastern Europe Market Attractiveness by Country, 2025 to 2035
  • Figure 181: South Asia and Pacific Market Value (USD Million) by Type, 2025 to 2035
  • Figure 182: South Asia and Pacific Market Value (USD Million) by Product, 2025 to 2035
  • Figure 183: South Asia and Pacific Market Value (USD Million) by Source, 2025 to 2035
  • Figure 184: South Asia and Pacific Market Value (USD Million) by Distribution Channel, 2025 to 2035
  • Figure 185: South Asia and Pacific Market Value (USD Million) by Application, 2025 to 2035
  • Figure 186: South Asia and Pacific Market Value (USD Million) by Country, 2025 to 2035
  • Figure 187: South Asia and Pacific Market Value (USD Million) Analysis by Country, 2020 to 2035
  • Figure 188: South Asia and Pacific Market Volume (MT) Analysis by Country, 2020 to 2035
  • Figure 189: South Asia and Pacific Market Value Share (%) and BPS Analysis by Country, 2025 to 2035
  • Figure 190: South Asia and Pacific Market Y-o-Y Growth (%) Projections by Country, 2025 to 2035
  • Figure 191: South Asia and Pacific Market Value (USD Million) Analysis by Type, 2020 to 2035
  • Figure 192: South Asia and Pacific Market Volume (MT) Analysis by Type, 2020 to 2035
  • Figure 193: South Asia and Pacific Market Value Share (%) and BPS Analysis by Type, 2025 to 2035
  • Figure 194: South Asia and Pacific Market Y-o-Y Growth (%) Projections by Type, 2025 to 2035
  • Figure 195: South Asia and Pacific Market Value (USD Million) Analysis by Product, 2020 to 2035
  • Figure 196: South Asia and Pacific Market Volume (MT) Analysis by Product, 2020 to 2035
  • Figure 197: South Asia and Pacific Market Value Share (%) and BPS Analysis by Product, 2025 to 2035
  • Figure 198: South Asia and Pacific Market Y-o-Y Growth (%) Projections by Product, 2025 to 2035
  • Figure 199: South Asia and Pacific Market Value (USD Million) Analysis by Source, 2020 to 2035
  • Figure 200: South Asia and Pacific Market Volume (MT) Analysis by Source, 2020 to 2035
  • Figure 201: South Asia and Pacific Market Value Share (%) and BPS Analysis by Source, 2025 to 2035
  • Figure 202: South Asia and Pacific Market Y-o-Y Growth (%) Projections by Source, 2025 to 2035
  • Figure 203: South Asia and Pacific Market Value (USD Million) Analysis by Distribution Channel, 2020 to 2035
  • Figure 204: South Asia and Pacific Market Volume (MT) Analysis by Distribution Channel, 2020 to 2035
  • Figure 205: South Asia and Pacific Market Value Share (%) and BPS Analysis by Distribution Channel, 2025 to 2035
  • Figure 206: South Asia and Pacific Market Y-o-Y Growth (%) Projections by Distribution Channel, 2025 to 2035
  • Figure 207: South Asia and Pacific Market Value (USD Million) Analysis by Application, 2020 to 2035
  • Figure 208: South Asia and Pacific Market Volume (MT) Analysis by Application, 2020 to 2035
  • Figure 209: South Asia and Pacific Market Value Share (%) and BPS Analysis by Application, 2025 to 2035
  • Figure 210: South Asia and Pacific Market Y-o-Y Growth (%) Projections by Application, 2025 to 2035
  • Figure 211: South Asia and Pacific Market Attractiveness by Type, 2025 to 2035
  • Figure 212: South Asia and Pacific Market Attractiveness by Product, 2025 to 2035
  • Figure 213: South Asia and Pacific Market Attractiveness by Source, 2025 to 2035
  • Figure 214: South Asia and Pacific Market Attractiveness by Distribution Channel, 2025 to 2035
  • Figure 215: South Asia and Pacific Market Attractiveness by Application, 2025 to 2035
  • Figure 216: South Asia and Pacific Market Attractiveness by Country, 2025 to 2035
  • Figure 217: East Asia Market Value (USD Million) by Type, 2025 to 2035
  • Figure 218: East Asia Market Value (USD Million) by Product, 2025 to 2035
  • Figure 219: East Asia Market Value (USD Million) by Source, 2025 to 2035
  • Figure 220: East Asia Market Value (USD Million) by Distribution Channel, 2025 to 2035
  • Figure 221: East Asia Market Value (USD Million) by Application, 2025 to 2035
  • Figure 222: East Asia Market Value (USD Million) by Country, 2025 to 2035
  • Figure 223: East Asia Market Value (USD Million) Analysis by Country, 2020 to 2035
  • Figure 224: East Asia Market Volume (MT) Analysis by Country, 2020 to 2035
  • Figure 225: East Asia Market Value Share (%) and BPS Analysis by Country, 2025 to 2035
  • Figure 226: East Asia Market Y-o-Y Growth (%) Projections by Country, 2025 to 2035
  • Figure 227: East Asia Market Value (USD Million) Analysis by Type, 2020 to 2035
  • Figure 228: East Asia Market Volume (MT) Analysis by Type, 2020 to 2035
  • Figure 229: East Asia Market Value Share (%) and BPS Analysis by Type, 2025 to 2035
  • Figure 230: East Asia Market Y-o-Y Growth (%) Projections by Type, 2025 to 2035
  • Figure 231: East Asia Market Value (USD Million) Analysis by Product, 2020 to 2035
  • Figure 232: East Asia Market Volume (MT) Analysis by Product, 2020 to 2035
  • Figure 233: East Asia Market Value Share (%) and BPS Analysis by Product, 2025 to 2035
  • Figure 234: East Asia Market Y-o-Y Growth (%) Projections by Product, 2025 to 2035
  • Figure 235: East Asia Market Value (USD Million) Analysis by Source, 2020 to 2035
  • Figure 236: East Asia Market Volume (MT) Analysis by Source, 2020 to 2035
  • Figure 237: East Asia Market Value Share (%) and BPS Analysis by Source, 2025 to 2035
  • Figure 238: East Asia Market Y-o-Y Growth (%) Projections by Source, 2025 to 2035
  • Figure 239: East Asia Market Value (USD Million) Analysis by Distribution Channel, 2020 to 2035
  • Figure 240: East Asia Market Volume (MT) Analysis by Distribution Channel, 2020 to 2035
  • Figure 241: East Asia Market Value Share (%) and BPS Analysis by Distribution Channel, 2025 to 2035
  • Figure 242: East Asia Market Y-o-Y Growth (%) Projections by Distribution Channel, 2025 to 2035
  • Figure 243: East Asia Market Value (USD Million) Analysis by Application, 2020 to 2035
  • Figure 244: East Asia Market Volume (MT) Analysis by Application, 2020 to 2035
  • Figure 245: East Asia Market Value Share (%) and BPS Analysis by Application, 2025 to 2035
  • Figure 246: East Asia Market Y-o-Y Growth (%) Projections by Application, 2025 to 2035
  • Figure 247: East Asia Market Attractiveness by Type, 2025 to 2035
  • Figure 248: East Asia Market Attractiveness by Product, 2025 to 2035
  • Figure 249: East Asia Market Attractiveness by Source, 2025 to 2035
  • Figure 250: East Asia Market Attractiveness by Distribution Channel, 2025 to 2035
  • Figure 251: East Asia Market Attractiveness by Application, 2025 to 2035
  • Figure 252: East Asia Market Attractiveness by Country, 2025 to 2035
  • Figure 253: Middle East and Africa Market Value (USD Million) by Type, 2025 to 2035
  • Figure 254: Middle East and Africa Market Value (USD Million) by Product, 2025 to 2035
  • Figure 255: Middle East and Africa Market Value (USD Million) by Source, 2025 to 2035
  • Figure 256: Middle East and Africa Market Value (USD Million) by Distribution Channel, 2025 to 2035
  • Figure 257: Middle East and Africa Market Value (USD Million) by Application, 2025 to 2035
  • Figure 258: Middle East and Africa Market Value (USD Million) by Country, 2025 to 2035
  • Figure 259: Middle East and Africa Market Value (USD Million) Analysis by Country, 2020 to 2035
  • Figure 260: Middle East and Africa Market Volume (MT) Analysis by Country, 2020 to 2035
  • Figure 261: Middle East and Africa Market Value Share (%) and BPS Analysis by Country, 2025 to 2035
  • Figure 262: Middle East and Africa Market Y-o-Y Growth (%) Projections by Country, 2025 to 2035
  • Figure 263: Middle East and Africa Market Value (USD Million) Analysis by Type, 2020 to 2035
  • Figure 264: Middle East and Africa Market Volume (MT) Analysis by Type, 2020 to 2035
  • Figure 265: Middle East and Africa Market Value Share (%) and BPS Analysis by Type, 2025 to 2035
  • Figure 266: Middle East and Africa Market Y-o-Y Growth (%) Projections by Type, 2025 to 2035
  • Figure 267: Middle East and Africa Market Value (USD Million) Analysis by Product, 2020 to 2035
  • Figure 268: Middle East and Africa Market Volume (MT) Analysis by Product, 2020 to 2035
  • Figure 269: Middle East and Africa Market Value Share (%) and BPS Analysis by Product, 2025 to 2035
  • Figure 270: Middle East and Africa Market Y-o-Y Growth (%) Projections by Product, 2025 to 2035
  • Figure 271: Middle East and Africa Market Value (USD Million) Analysis by Source, 2020 to 2035
  • Figure 272: Middle East and Africa Market Volume (MT) Analysis by Source, 2020 to 2035
  • Figure 273: Middle East and Africa Market Value Share (%) and BPS Analysis by Source, 2025 to 2035
  • Figure 274: Middle East and Africa Market Y-o-Y Growth (%) Projections by Source, 2025 to 2035
  • Figure 275: Middle East and Africa Market Value (USD Million) Analysis by Distribution Channel, 2020 to 2035
  • Figure 276: Middle East and Africa Market Volume (MT) Analysis by Distribution Channel, 2020 to 2035
  • Figure 277: Middle East and Africa Market Value Share (%) and BPS Analysis by Distribution Channel, 2025 to 2035
  • Figure 278: Middle East and Africa Market Y-o-Y Growth (%) Projections by Distribution Channel, 2025 to 2035
  • Figure 279: Middle East and Africa Market Value (USD Million) Analysis by Application, 2020 to 2035
  • Figure 280: Middle East and Africa Market Volume (MT) Analysis by Application, 2020 to 2035
  • Figure 281: Middle East and Africa Market Value Share (%) and BPS Analysis by Application, 2025 to 2035
  • Figure 282: Middle East and Africa Market Y-o-Y Growth (%) Projections by Application, 2025 to 2035
  • Figure 283: Middle East and Africa Market Attractiveness by Type, 2025 to 2035
  • Figure 284: Middle East and Africa Market Attractiveness by Product, 2025 to 2035
  • Figure 285: Middle East and Africa Market Attractiveness by Source, 2025 to 2035
  • Figure 286: Middle East and Africa Market Attractiveness by Distribution Channel, 2025 to 2035
  • Figure 287: Middle East and Africa Market Attractiveness by Application, 2025 to 2035
  • Figure 288: Middle East and Africa Market Attractiveness by Country, 2025 to 2035

Frequently Asked Questions

What was the overall size of the cheese powder market in 2025?

The overall market size for the cheese powder market was USD 980 million in 2025.

How big is the cheese powder market expected to be in 2035?

The cheese powder market is expected to reach USD 3,257 million in 2035.

What is the expected CAGR for the cheese powder market from 2025 to 2035?

The cheese powder market is expected to grow at a CAGR of 14.2% during the forecast period.

What will drive the demand for the cheese powder market during the forecast period?

The demand for the cheese powder market will be driven by increasing consumer preference for convenience foods, rising demand for dairy-based flavoring ingredients, expanding applications in the snack and ready-to-eat meal industries, growing interest in natural and organic food products, and advancements in food processing technologies.

Which are the top five countries contributing to the cheese powder market?

The top five countries driving the development of the cheese powder market are the USA, Germany, France, China, and the UK.

Explore Similar Insights

Future Market Insights

Cheese Powder Market