Cheese Concentrates Market Forecast and Outlook 2025 to 2035

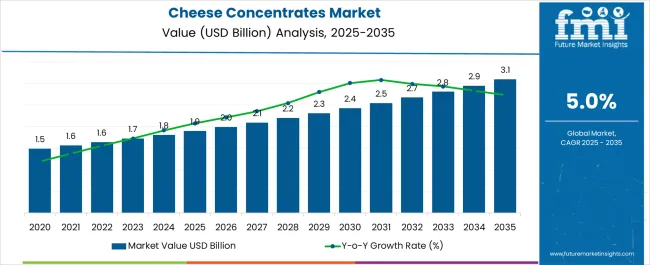
The global cheese concentrates market is valued at USD 1.9 billion in 2025 and is expected to reach USD 3.1 billion by 2035, reflecting a CAGR of 5.0%.
Quick Stats for Cheese Concentrates Market

  • Cheese Concentrates Market Value (2025): USD 1.9 billion
  • Cheese Concentrates Market Forecast Value (2035): USD 3.1 billion
  • Cheese Concentrates Market Forecast CAGR: 5.0%
  • Leading Segment in Cheese Concentrates Market in 2025: Cheddar (38% market share)
  • Key Growth Regions in Cheese Concentrates Market: Asia-Pacific, North America, and Europe
  • Top Key Players in Cheese Concentrates Market: Archer Daniels Midland Company, Land O’ Lakes Inc., Dairy Farmers of America Inc., First Choice Ingredients, Butter Buds Inc.

Cheese Concentrate Market

Metric Value
Estimated Size (2025E) USD 1.9 billion
Projected Value (2035F) USD 3.1 billion
CAGR (2025 to 2035) 5.0%

Factors driving this growth include rising demand for clean-label, low-fat cheese options, growing application of cheese concentrates in ready meals and snacks, and increasing interest in dairy-free cheese substitutes. Moreover, product versatility and strong flavor profiles up to 20x stronger than natural cheese are enhancing their adoption.

By 2030, the market is forecasted to reach around USD 2.5 billion, reflecting steady growth throughout the first half of the period. The absolute dollar growth between 2025 and 2035 is expected to be USD 1.2 billion, indicating steady and reliable market expansion. Growth is expected to accelerate in the latter half of the timeline, driven by increased adoption of cheese concentrates in convenience foods, processed snacks, sauces, and quick-service restaurant menus.

Key companies such as Kraft Heinz, Lactal is Ingredients, and Archer Daniels Midland are strengthening their positions by expanding production capacities and investing in advanced processing technologies like spray drying and microfiltration. Their innovation efforts focus on low-fat, lactose-free, and fortified cheese concentrate products to capture health-conscious and premium market segments. Market performance will continue to depend on quality control, dairy sourcing standards, and regulatory compliance, which will influence competitive dynamics and expansion opportunities across different regions within the cheese concentrates market.

The market accounts for nearly 39% of the global cheese ingredients market, driven by its ability to deliver authentic taste, longer shelf stability, and reduced storage costs. It represents about 27% of the dairy-based flavoring market, owing to rising use in snacks, sauces, soups, and ready meals. The market holds close to 21% share in functional dairy ingredients and around 18% of clean-label flavorings, supported by growing consumer preference for natural, nutrient-rich, and versatile ingredient solutions in packaged food processing.

The market is witnessing structural changes as technological advancements such as spray drying, enzymatic concentration, and fermentation enhance flavor intensity, stability, and adaptability. Rising demand for clean-label, authentic, and nutritionally transparent ingredients is driving adoption across sauces, dips, bakery fillings, frozen meals, and foodservice applications. Manufacturers are developing organic, vegan-compatible, and reduced-fat concentrates aligned with evolving dietary preferences. Strategic collaborations between concentrate producers, food manufacturers, and flavor houses are accelerating innovation, market penetration, and global reach.

Why is Cheese Concentrates Market Growing?

The market is expanding due to increasing demand for convenient and processed food products worldwide. Consumers are seeking ready-to-eat meals and snacks that offer rich cheese flavors, and cheese concentrates provide an efficient way to deliver this with enhanced shelf life and reduced storage requirements. The rise in fast food and quick-service restaurants fuels the need for concentrated cheese ingredients that are easy to use and cost-effective.

Additionally, technological advancements in processing methods like spray drying enhance product quality and consistency, attracting more manufacturers. The growing middle-class population in emerging economies, coupled with changing eating habits and increased dairy consumption, further drives market expansion. Innovations in cheese concentrates, including lactose-free and low-fat variants, cater to health-conscious consumers, widening the market appeal. These factors collectively contribute to a strong projected growth rate, making cheese concentrates a key ingredient in modern food processing and fast-growing packaged foods sectors. This market is expected to witness significant growth through the forecast period.

Cheese Concentrates Market Analysis by Top Investment Segments

The market is segmented by product, form, buyer, application, sales channel, and region. By product, the market is categorized into mozzarella, cheddar, parmesan, swiss, goat, blue, and others (cream cheese and vegan cheese). Based on form, the market is segmented into powder, paste/spread, chunk, grated, and others (liquid and sliced forms). By buyer, the market is divided into commercial bakers, artisan bakers, retail buyers, and food service providers. In terms of application, the market is segmented into bakery & confectionery, processed cheese, sauces/dressings/dips & condiments, dairy & desserts, snacks & savory items, ready meal production, and others (seasonings and instant mixes).

By sales channel, the market is bifurcated into B2B/HoReCa and B2C (hypermarkets/supermarkets, convenience stores, mom and pop stores, discount stores, food specialty stores, independent small groceries, online retail, and others such as direct-to-consumer).Regionally, the market is classified into North America, Latin America, Western Europe, Eastern Europe, South Asia & Pacific, East Asia, and Middle East & Africa.
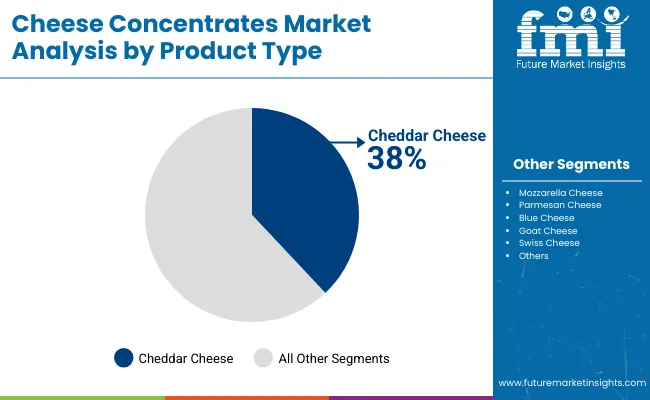
By Product Type, Cheddar Cheese Accounts for 38% of the Market Share

Cheese Concentrate Market By Product

Cheddar cheese concentrates are expected to dominate the product type segment, holding a significant 38% market share in 2025. This leadership is driven by Cheddar’s distinct sharp flavor, which appeals to a wide range of consumers and blends well with various cuisines. Its versatility is evident in its extensive use across multiple food applications, including sauces, snacks, and baked goods. Increasing consumer preference for rich, aged cheese flavors further boosts demand for Cheddar concentrates. Additionally, Cheddar concentrates are popular in low-fat food formulations as they maintain the bold taste without adding extra fat, attracting health-conscious buyers.

The sharp flavor of Cheddar makes it particularly suitable for quick-service restaurants (QSR) and processed snack foods, where strong taste profiles are valued. Its compatibility with powdered and paste formulations further enhances its usability in food manufacturing. Cheddar concentrates also benefit from a long shelf life, improving logistics and storage efficiency. Demand for these concentrates is notably high in North America and Europe, regions with mature processed food markets.
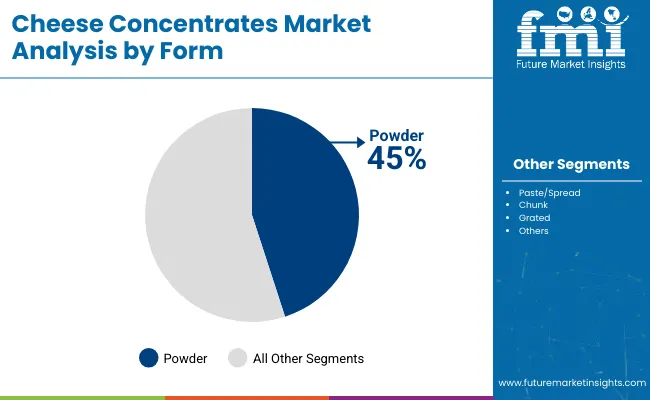
By Form, Powder Accounts for 45% of the Market Share

Cheese Concentrate Market By Form

Powder cheese concentrates are expected to dominate the market in 2025 with a 45% share due to their extended shelf life, easy storage, and flexible applications. These concentrates are widely used in sauces, seasonings, bakery products, and snacks because they can be easily incorporated and provide consistent flavor. Manufacturers favor the powder form for its stable flavor delivery and simplified packaging, which supports large-scale food production. The dry nature of powder concentrates also reduces shipping and handling costs, making them ideal for global trade and distribution.

Advancements in spray-drying technology have enhanced powder production, improving quality and scalability. This form is preferred for industrial use, particularly in bulk processing, where efficiency and consistency are crucial. The long shelf life of up to 24 months further boosts its appeal, especially in dry snacks and seasoning blends, where freshness and flavor stability are vital. Overall, powder cheese concentrates offer significant advantages that drive their strong market presence.

What are the Drivers, Restraints, and Key Trends of the Cheese Concentrates Market?

From 2025 to 2035, growing consumer demand for convenient, flavorful, and health-conscious food products is driving significant growth in the cheese concentrates market. Increasing preference for processed foods that offer rich cheese taste with extended shelf life has positioned manufacturers investing in advanced concentration and drying technologies as leaders in meeting evolving culinary needs and expanding applications across snacks, sauces, and ready-to-eat meals.

Health Awareness Boosts Demand for Innovative Cheese Concentrates

Rising health awareness among consumers is driving demand for low-fat, lactose-free, and clean-label cheese concentrates. This trend encourages manufacturers to innovate by developing enhanced formulations that offer better flavor, improved nutritional value, and greater compatibility with diverse cuisines. In response, producers are expected to adopt advanced processing techniques such as spray drying and microfiltration by 2025. These technologies help deliver higher quality, improved consistency, and longer shelf life to meet evolving consumer expectations. Overall, health-conscious choices and technological advancements are key factors shaping the future growth and product development in the cheese concentrates market.

Technological Advancements and Sustainability Expand Market Opportunities

Technological innovations and sustainable sourcing are expanding the cheese concentrates market, especially in North America and Europe. Companies prioritizing sustainability and quality certifications gain a competitive edge by appealing to environmentally conscious consumers. This trend drives long-term growth as consumers increasingly demand eco-friendly, ethically produced products. By adopting advanced processing technologies and focusing on sustainable practices, these companies improve product quality and reduce environmental impact. Aligning with regulatory standards and consumer values, they strengthen market presence and foster loyalty. Overall, sustainability and innovation are key drivers shaping the future expansion of the cheese concentrates market in developed regions.
Cheese Concentrates Market Analysis by Key Countries

Cheese Concentrate Market By Country

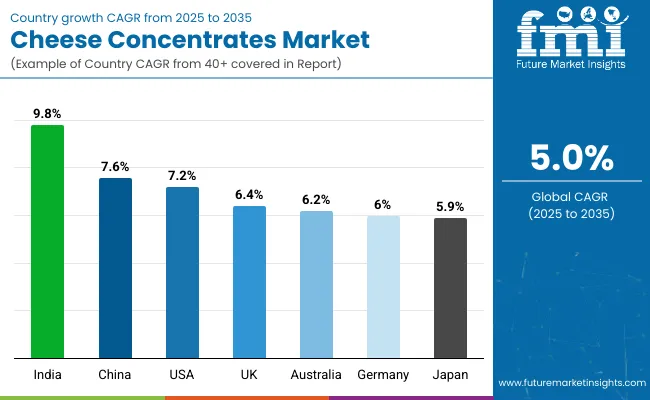
Countries CAGR (2025 to 2035)
India 9.8%
China 7.6%
USA 7.2%
UK 6.4%
Australia 6.2%
Germany 6.0%
Japan 5.9%

The market is set to experience varied growth rates across key countries from 2025 to 2035, reflecting differing market dynamics and consumer trends. India leads with the highest CAGR of 9.8%, driven by rapid urbanization, rising disposable incomes, and increasing demand for processed and lactose-free cheese products in both urban and rural areas. China follows at 7.6%, propelled by Western food adoption, technological advancements, and government support for modern dairy practices. The USA grows at 7.2%, fueled by innovation in low-fat and organic concentrates and strong foodservice demand. The UK and Australia report steady growth at 6.4% and 6.2%, respectively, focusing on premium, clean-label products and export-driven expansion. Germany progresses at 6.0%, benefiting from advanced processing and health-conscious trends, while Japan shows the slowest growth at 5.9%, emphasizing premium convenience products tailored to local tastes.

The report covers an in-depth analysis of 40+ countries; seven top-performing OECD countries are highlighted below.

Output Expansion in Cheese Concentrates Market in India

Demand for cheese concentrates in India is set to register an impressive 9.8% CAGR from 2025 to 2035. Rapid urbanization, a booming fast-food sector, and higher disposable incomes are fueling the growth for cheese concentrates nationally. Westernization of food habits, combined with health and protein awareness, boosts consumption in both urban and emerging rural areas. Organized foodservice, retail expansion into tier-2 and tier-3 cities, and government initiatives in dairy modernization are strengthening distribution networks. There is surging demand for lactose-free, fortified, and value-added cheese products, supporting market diversification. Manufacturers are introducing innovative flavors to cater to changing palates, while premium positioning stimulates consumer interest. The trend towards convenience and packaged foods, alongside growing youth demographics, further accelerates market momentum.

  • Rapid adoption of processed cheese in QSR menus and snacks
  • Organized retail and foodservice expansion
  • Investment in modern dairy infrastructure

Production Capacity Trends in Cheese Concentrates Market in China

Revenue from cheese concentrates in China is projected with a CAGR of 7.6%, China demonstrates robust expansion in production capacities for cheese concentrates from 2025 to 2035. Urbanization, increased disposable income, and the influence of Western cuisine have propelled consumption and domestic cheese production. Investments in advanced processing, technology upgrades, and cold chain logistics are improving quality and shelf-life. The market is further stimulated by government support for modern dairying, catering to both local and export demand. Major players are promoting processed and packaged cheese options to fit shifting consumer lifestyles. Chinese companies are strengthening partnerships with global dairy leaders, enriching offerings. Growing nutritional awareness and popularity of international food chains fuel continuous market uplift.

  • Expansion of domestic cheese processing facilities
  • Advances in spray-drying and packaging technology
  • Government investment in cold chain logistics

Innovation Dynamics in Cheese Concentrates Market in USA

Demand for cheese concentrates in the USA projected at a 7.2% CAGR, is marked by dynamic innovation and steady demand in processed, convenience, and specialty foods. Strong food tech infrastructure aids in launching low-fat, lactose-free, and organic concentrates. The robust food service sector, especially QSRs and snacks, shapes new product development. Continuous R&D enables consistent flavor and texture for bulk and retail markets. Export growth, fueled by consumer trust in US dairy quality, enhances global presence. Health-oriented product launches address rising wellness trends. The USA is a hub for flavor innovation, microfiltration, and distribution. Efficient supply and logistics networks drive product reach to all states and export destinations.

  • High investment in product R&D and food technology
  • Robust consumer market for flavor variety
  • Significant QSR and processed food sector demand

Premiumization Wave in Cheese Concentrates Market in the UK

Sales of cheese concentrates in the UK are projected with a 6.4% CAGR, the market is shaped by the premiumization trend and focus on clean-label, natural products. Strong demand for gourmet, artisan, and vegan cheese ranges defines market innovation. Retailers and producers are prioritizing traceability, sustainable sourcing, and eco-friendly packaging. Convenience, meal kits, and premium snacking options drive category expansion. Health-conscious consumers seek additives-free, organic, and specialty blends, while diversified product ranges appeal to foodservice operators. The UK market is marked by strategic collaborations for product launches and distribution. Consumers’ appetite for global flavors reflects in evolving cheese concentrate portfolios, fueling incremental value growth.

  • Focus on premium, traceable cheese ingredients
  • Surge in demand for organic and vegan options
  • Expansion of gourmet and specialty offerings

Export-Focused Growth in Cheese Concentrates Market in Australia

Demand for cheese concentrates in Australia is forecast to grow at 6.2% CAGR, leveraging its strong dairy export foundation and premium natural image. Demand is driven by Asia-Pacific and Middle East exports, backed by highly efficient production facilities and quality assurance. Local consumers prefer minimally processed, high-protein, and natural flavor ingredients. Sustainable practices and traceability are core to market expansion. Technological upgrades increase volume and consistency, supporting bulk supply to global and domestic brands. Government support and geographical advantages further bolster export logistics. Australia’s market is increasingly characterized by premium positioning in food processing and snack segments.
  • Expanding dairy export channels in Asia-Pacific
  • Investment in sustainable and premium production
  • Technological advances in flavor and shelf life

Structural Adoption in Cheese Concentrates Market in Germany

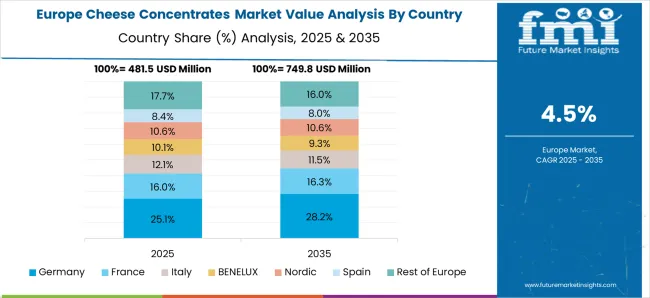
Revenue from cheese concentrates in Germany will advance at a 6.0% CAGR, benefiting from premier processing standards and strict food safety regulations. The country leads in technological adoption, exporting innovative solutions across Europe and globally. Health-forward consumer trends increase demand for reduced-fat, high-protein, and functional cheese ingredients. Partnerships between research institutions and industry drive ongoing R&D and product improvement. The foodservice sector leverages German cheese concentrates for quality and consistency, fueling applications in sauces, bakery, and processed snacks. Sustainability and eco-certification initiatives underpin market presence. Germany remains a benchmark for quality, with a well-diversified portfolio of cheese concentrates.
  • Advanced processing and automation technologies
  • Demand for functional, health-oriented cheese products
  • High export share in European processed foods

Premium Convenience in Cheese Concentrates Market in Japan

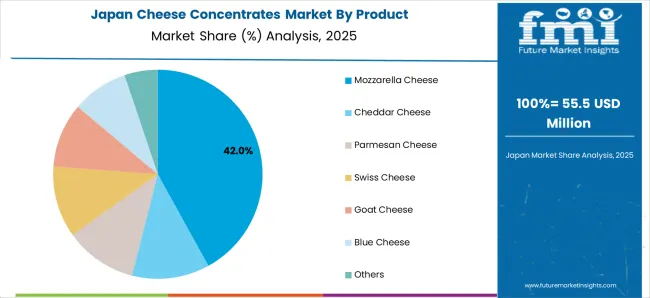
Demand for cheese concentrates in Japan, with a 5.9% CAGR, focuses on premium convenience and tailored formulations for local consumers. Interest in Western cuisine and unique dairy flavors is rising consumers prefer mild, functional, and easy-to-use cheese products. Innovations target the needs of bakery, snack, and ready-to-eat meal markets, with significant retail concentration. Packaging and shelf-life improvements cater to space and freshness concerns. Product launches often emphasize nutrition, flavor variety, and compact storage. Strong import presence complements domestic production. Collaborative efforts with international brands bring new trends to Japanese consumers.
  • Emphasis on convenience and long shelf life
  • Growth in processed bakery and snack segments
  • Customization for Japanese flavor preferences

Competitive Landscape of the Cheese Concentrates Market

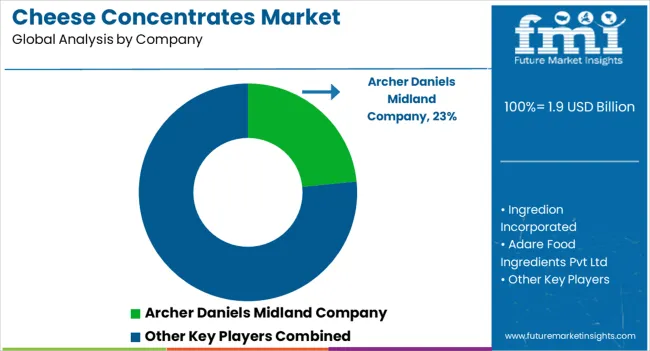
Cheese Concentrate Market By Company

The market is moderately consolidated, with several regional and global players contributing to competition. Companies such as Archer Daniels Midland Company, Land O’ Lakes Inc., Dairy Farmers of America, and Ingredion Incorporated are key leaders, leveraging innovation, price competitiveness, and robust distribution networks to sustain their market presence. These players focus heavily on clean-label solutions, flavor customization, and cost-effective dairy alternatives to meet evolving consumer preferences across the food processing industry.

Leading firms are prioritizing strategic partnerships, flavor research, and geographic expansion to cater to rising demand across the USA, Europe, and Asia. ADM and Ingredion have enhanced their plant-based portfolios to serve flexitarian markets, while companies like First Choice Ingredients and Butter Buds Inc. have strengthened their B2B networks, targeting bakery, snacks, and ready-to-eat sectors. Notably, the integration of enzymatic and natural cheese flavors has been a critical differentiator in retaining large-scale food service contracts. Meanwhile, M&A activity continues, especially among mid-tier suppliers aiming to expand their footprint in developing economies.

Scope of Report

Items Values
Quantitative Units (2025) USD 1.9 billion
Form Powder, Paste /Spread, Chunk, Grated, Others (Liquid and Sliced)
Application Bakery & Confectionery, Processed Cheese, Sauces, Dressings, Dips & Condiments, Dairy & Desserts, Snacks & Savory Items, Ready Meal Production, and Others (Seasoning and Instant Mixes)
Product Cheddar Cheese, Mozzarella Cheese, Parmesan Cheese, Blue Cheese, Goat Cheese, Swiss Cheese, Others (Cream Cheese and Vegan Cheese)
Buyer Commercial Bakers, Artisan Bakers, Retail Buyers, Food Service Providers
Sales Channel B2B/ HoReCa, B2C (Hypermarkets/Supermarkets, Convenience Stores, Mom and Pop Stores, Discount Stores, Food Specialty Stores, Independent Small Groceries, Online Retail, and Others)
Regions Covered North America, Latin America, Europe, the Middle East and Africa, East Asia, South Asia, and Oceania
Countries Covered United States, Canada, United Kingdom, Germany, France, China, Japan, South Korea, Brazil, Australia, and 40+ countries
Key Players Archer Daniels Midland Company, Ingredion Incorporated, Adare Food Ingredients Pvt Ltd, Dale Farm Ltd, C.P. Ingredients Ltd, Land O’ Lakes Inc., Dairy Farmers of America, Inc., First Choice Ingredients (DSM), Butter Buds Inc., GoBia Ltd, Puramio India Pvt Ltd, and Jeneil Bioproducts GmbH
Additional Attributes Dollar sales and growth by product, form, buyer, application, and sales channel; segment-wise market share analysis; country-wise market analysis; evolving consumer preferences for natural and clean-label cheese concentrates; innovations in formulation and flavor delivery; and focus on sustainability, traceability, and quality consistency

Key Segments

By Product:

  • Mozzarella Cheese
  • Cheddar Cheese
  • Parmesan Cheese
  • Swiss Cheese
  • Goat Cheese
  • Blue Cheese
  • Others

By Form:

  • Powder
  • Paste / Spread
  • Chunk
  • Grated
  • Others

By Buyer:

  • Commercial Bakers
  • Artisan Bakers
  • Retail Buyers
  • Food Service Providers

By Application:

  • Bakery & Confectionery
  • Processed Cheese
  • Sauces, Dressings, Dips & Condiments
  • Dairy & Desserts
  • Snacks & Savory Items
  • Ready Meal Production
  • Others

By Sales Channel:

  • B2B / HoReCa
  • B2C
    • Hypermarkets /Supermarkets
    • Convenience Stores
    • Mom and Pop Stores
    • Discount Stores
    • Food Specialty Stores
    • Independent Small Groceries
    • Online Retail
    • Others Retail Formats

By Region:

  • North America
  • Latin America
  • Asia Pacific
  • Middle East and Africa (MEA)
  • Europe

Table of Content

  1. Executive Summary
    • Global Market Outlook
    • Demand-side Trends
    • Supply-side Trends
    • Technology Roadmap Analysis
    • Analysis and Recommendations
  2. Market Overview
    • Market Coverage / Taxonomy
    • Market Definition / Scope / Limitations
  3. Market Background
    • Market Dynamics
      • Drivers
      • Restraints
      • Opportunity
      • Trends
    • Scenario Forecast
      • Demand in Optimistic Scenario
      • Demand in Likely Scenario
      • Demand in Conservative Scenario
    • Opportunity Map Analysis
    • Product Life Cycle Analysis
    • Supply Chain Analysis
      • Supply Side Participants and their Roles
        • Producers
        • Mid-Level Participants (Traders/ Agents/ Brokers)
        • Wholesalers and Distributors
      • Value Added and Value Created at Node in the Supply Chain
      • List of Raw Material Suppliers
      • List of Existing and Potential Buyer’s
    • Investment Feasibility Matrix
    • Value Chain Analysis
      • Profit Margin Analysis
      • Wholesalers and Distributors
      • Retailers
    • PESTLE and Porter’s Analysis
    • Regulatory Landscape
      • By Key Regions
      • By Key Countries
    • Regional Parent Market Outlook
    • Production and Consumption Statistics
    • Import and Export Statistics
  4. Global Market Analysis 2020 to 2024 and Forecast, 2025 to 2035
    • Historical Market Size Value (USD Billion) & Volume (Kilotons) Analysis, 2020 to 2024
    • Current and Future Market Size Value (USD Billion) & Volume (Kilotons) Projections, 2025 to 2035
      • Y-o-Y Growth Trend Analysis
      • Absolute $ Opportunity Analysis
  5. Global Market Pricing Analysis 2020 to 2024 and Forecast 2025 to 2035
  6. Global Market Analysis 2020 to 2024 and Forecast 2025 to 2035, By Product
    • Introduction / Key Findings
    • Historical Market Size Value (USD Billion) & Volume (Kilotons) Analysis By Product, 2020 to 2024
    • Current and Future Market Size Value (USD Billion) & Volume (Kilotons) Analysis and Forecast By Product, 2025 to 2035
      • Mozzarella Cheese
      • Cheddar Cheese
      • Parmesan Cheese
      • Swiss Cheese
      • Goat Cheese
      • Blue Cheese
      • Others
        • Cream Cheese
        • Vegan Cheese
    • Y-o-Y Growth Trend Analysis By Product, 2020 to 2024
    • Absolute $ Opportunity Analysis By Product, 2025 to 2035
  7. Global Market Analysis 2020 to 2024 and Forecast 2025 to 2035, By Form
    • Introduction / Key Findings
    • Historical Market Size Value (USD Billion) & Volume (Kilotons) Analysis By Form, 2020 to 2024
    • Current and Future Market Size Value (USD Billion) & Volume (Kilotons) Analysis and Forecast By Form, 2025 to 2035
      • Powder
      • Paste / Spread
      • Chunks
      • Grated
      • Others
        • Liquid
        • Sliced
    • Y-o-Y Growth Trend Analysis By Form, 2020 to 2024
    • Absolute $ Opportunity Analysis By Form, 2025 to 2035
  8. Global Market Analysis 2020 to 2024 and Forecast 2025 to 2035, By Buyer
    • Introduction / Key Findings
    • Historical Market Size Value (USD Billion) & Volume (Kilotons) Analysis By Buyer, 2020 to 2024
    • Current and Future Market Size Value (USD Billion) & Volume (Kilotons) Analysis and Forecast By Buyer, 2025 to 2035
      • Commercial Bakers
      • Artisan Bakers
      • Retail Buyers
      • Food Service Providers
    • Y-o-Y Growth Trend Analysis By Buyer, 2020 to 2024
    • Absolute $ Opportunity Analysis By Buyer, 2025 to 2035
  9. Global Market Analysis 2020 to 2024 and Forecast 2025 to 2035, By Application
    • Introduction / Key Findings
    • Historical Market Size Value (USD Billion) & Volume (Kilotons) Analysis By Application, 2020 to 2024
    • Current and Future Market Size Value (USD Billion) & Volume (Kilotons) Analysis and Forecast By Application, 2025 to 2035
      • Bakery & Confectionery
      • Processed Cheese
      • Sauces, Dressings, Dips & Condiments
      • Dairy & Desserts
      • Snacks & Savory Items
      • Ready Meal Production
      • Others
        • Seasoning
        • Instant Mixes
    • Y-o-Y Growth Trend Analysis By Application, 2020 to 2024
    • Absolute $ Opportunity Analysis By Application, 2025 to 2035
  10. Global Market Analysis 2020 to 2024 and Forecast 2025 to 2035, By Sales Channel
    • Introduction / Key Findings
    • Historical Market Size Value (USD Billion) & Volume (Kilotons) Analysis By Sales Channel, 2020 to 2024
    • Current and Future Market Size Value (USD Billion) & Volume (Kilotons) Analysis and Forecast By Sales Channel, 2025 to 2035
      • B2B/HoReCa
      • B2C
        • Hypermarkets /Supermarkets
        • Convenience Stores
        • Mom and Pop Stores
        • Discount Stores
        • Food Specialty Stores
        • Independent Small Groceries
        • Online Retail
        • Others
    • Y-o-Y Growth Trend Analysis By Sales Channel, 2020 to 2024
    • Absolute $ Opportunity Analysis By Sales Channel, 2025 to 2035
  11. Global Market Analysis 2020 to 2024 and Forecast 2025 to 2035, By Region
    • Introduction
    • Historical Market Size Value (USD Billion) & Volume (Kilotons) Analysis By Region, 2020 to 2024
    • Current Market Size Value (USD Billion) & Volume (Kilotons) Analysis and Forecast By Region, 2025 to 2035
      • North America
      • Latin America
      • Western Europe
      • Eastern Europe
      • East Asia
      • South Asia & Pacific
      • Middle East and Africa
    • Market Attractiveness Analysis By Region
  12. North America Market Analysis 2020 to 2024 and Forecast 2025 to 2035, By Country
    • Historical Market Size Value (USD Billion) & Volume (Kilotons) Trend Analysis By Market Taxonomy, 2020 to 2024
    • Market Size Value (USD Billion) & Volume (Kilotons) Forecast By Market Taxonomy, 2025 to 2035
      • By Country
        • USA
        • Canada
        • Mexico
      • By Product
      • By Form
      • By Buyer
      • By Application
      • By Sales Channel
    • Market Attractiveness Analysis
      • By Country
      • By Product
      • By Form
      • By Buyer
      • By Application
      • By Sales Channel
    • Key Takeaways
  13. Latin America Market Analysis 2020 to 2024 and Forecast 2025 to 2035, By Country
    • Historical Market Size Value (USD Billion) & Volume (Kilotons) Trend Analysis By Market Taxonomy, 2020 to 2024
    • Market Size Value (USD Billion) & Volume (Kilotons) Forecast By Market Taxonomy, 2025 to 2035
      • By Country
        • Brazil
        • Argentina
        • Rest of LATAM
      • By Product
      • By Form
      • By Buyer
      • By Application
      • By Sales Channel
    • Market Attractiveness Analysis
      • By Country
      • By Product
      • By Form
      • By Buyer
      • By Application
      • By Sales Channel
    • Key Takeaways
  14. Western Europe Market Analysis 2020 to 2024 and Forecast 2025 to 2035, By Country
    • Historical Market Size Value (USD Billion) & Volume (Kilotons) Trend Analysis By Market Taxonomy, 2020 to 2024
    • Market Size Value (USD Billion) & Volume (Kilotons) Forecast By Market Taxonomy, 2025 to 2035
      • By Country
        • Germany
        • Italy
        • France
        • UK
        • Spain
        • BENELUX
        • Nordic
        • Rest of W.Europe
      • By Product
      • By Form
      • By Buyer
      • By Application
      • By Sales Channel
    • Market Attractiveness Analysis
      • By Country
      • By Product
      • By Form
      • By Buyer
      • By Application
      • By Sales Channel
    • Key Takeaways
  15. Eastern Europe Market Analysis 2020 to 2024 and Forecast 2025 to 2035, By Country
    • Historical Market Size Value (USD Billion) & Volume (Kilotons) Trend Analysis By Market Taxonomy, 2020 to 2024
    • Market Size Value (USD Billion) & Volume (Kilotons) Forecast By Market Taxonomy, 2025 to 2035
      • By Country
        • Russia
        • Hungary
        • Poland
        • Balkan & Baltics
        • Rest of E. Europe
      • By Product
      • By Form
      • By Buyer
      • By Application
      • By Sales Channel
    • Market Attractiveness Analysis
      • By Country
      • By Product
      • By Form
      • By Buyer
      • By Application
      • By Sales Channel
    • Key Takeaways
  16. East Asia Market Analysis 2020 to 2024 and Forecast 2025 to 2035, By Country
    • Historical Market Size Value (USD Billion) & Volume (Kilotons) Trend Analysis By Market Taxonomy, 2020 to 2024
    • Market Size Value (USD Billion) & Volume (Kilotons) Forecast By Market Taxonomy, 2025 to 2035
      • By Country
        • China
        • Japan
        • South Korea
      • By Product
      • By Form
      • By Buyer
      • By Application
      • By Sales Channel
    • Market Attractiveness Analysis
      • By Country
      • By Product
      • By Form
      • By Buyer
      • By Application
      • By Sales Channel
    • Key Takeaways
  17. South Asia & Pacific Market Analysis 2020 to 2024 and Forecast 2025 to 2035, By Country
    • Historical Market Size Value (USD Billion) & Volume (Kilotons) Trend Analysis By Market Taxonomy, 2020 to 2024
    • Market Size Value (USD Billion) & Volume (Kilotons) Forecast By Market Taxonomy, 2025 to 2035
      • By Country
        • India
        • Australia & New Zealand
        • ASEAN
        • Rest of SAP
      • By Product
      • By Form
      • By Buyer
      • By Application
      • By Sales Channel
    • Market Attractiveness Analysis
      • By Country
      • By Product
      • By Form
      • By Buyer
      • By Application
      • By Sales Channel
    • Key Takeaways
  18. Middle East and Africa Market Analysis 2020 to 2024 and Forecast 2025 to 2035, By Country
    • Historical Market Size Value (USD Billion) & Volume (Kilotons) Trend Analysis By Market Taxonomy, 2020 to 2024
    • Market Size Value (USD Billion) & Volume (Kilotons) Forecast By Market Taxonomy, 2025 to 2035
      • By Country
        • GCC Countries
        • Northern Africa
        • South Africa
        • Turkiye
        • Rest of MEA
      • By Product
      • By Form
      • By Buyer
      • By Application
      • By Sales Channel
    • Market Attractiveness Analysis
      • By Country
      • By Product
      • By Form
      • By Buyer
      • By Application
      • By Sales Channel
    • Key Takeaways
  19. Key Countries Market Analysis
    • USA
      • Pricing Analysis
      • Market Share Analysis, 2024
        • By Product
        • By Form
        • By Buyer
        • By Application
        • By Sales Channel
    • Canada
      • Pricing Analysis
      • Market Share Analysis, 2024
        • By Product
        • By Form
        • By Buyer
        • By Application
        • By Sales Channel
    • Brazil
      • Pricing Analysis
      • Market Share Analysis, 2024
        • By Product
        • By Form
        • By Buyer
        • By Application
        • By Sales Channel
    • Mexico
      • Pricing Analysis
      • Market Share Analysis, 2024
        • By Product
        • By Form
        • By Buyer
        • By Application
        • By Sales Channel
    • Argentina
      • Pricing Analysis
      • Market Share Analysis, 2024
        • By Product
        • By Form
        • By Buyer
        • By Application
        • By Sales Channel
  20. Market Structure Analysis
    • Competition Dashboard
    • Competition Benchmarking
    • Market Share Analysis of Top Players
      • By Regional
      • By Product
      • By Form
      • By Buyer
      • By Application
      • By Sales Channel
  21. Competition Analysis
    • Competition Deep Dive
      • Archer Daniels Midland Company
        • Overview
        • Product Portfolio
        • Profitability by Market Segments (Product/Age /Sales Channel/Region)
        • Sales Footprint
        • Strategy Overview
          • Marketing Strategy
          • Product Strategy
          • Channel Strategy
      • Ingredion Incorporated
        • Overview
        • Product Portfolio
        • Profitability by Market Segments (Product/Age /Sales Channel/Region)
        • Sales Footprint
        • Strategy Overview
          • Marketing Strategy
          • Product Strategy
          • Channel Strategy
      • Adare Food Ingredients Pvt Ltd
        • Overview
        • Product Portfolio
        • Profitability by Market Segments (Product/Age /Sales Channel/Region)
        • Sales Footprint
        • Strategy Overview
          • Marketing Strategy
          • Product Strategy
          • Channel Strategy
      • Dale Farm Ltd
        • Overview
        • Product Portfolio
        • Profitability by Market Segments (Product/Age /Sales Channel/Region)
        • Sales Footprint
        • Strategy Overview
          • Marketing Strategy
          • Product Strategy
          • Channel Strategy
      • C.P. Ingredients Ltd
        • Overview
        • Product Portfolio
        • Profitability by Market Segments (Product/Age /Sales Channel/Region)
        • Sales Footprint
        • Strategy Overview
          • Marketing Strategy
          • Product Strategy
          • Channel Strategy
      • Land O’ Lakes Inc.
        • Overview
        • Product Portfolio
        • Profitability by Market Segments (Product/Age /Sales Channel/Region)
        • Sales Footprint
        • Strategy Overview
          • Marketing Strategy
          • Product Strategy
          • Channel Strategy
      • Dairy Farmers of America, Inc.
        • Overview
        • Product Portfolio
        • Profitability by Market Segments (Product/Age /Sales Channel/Region)
        • Sales Footprint
        • Strategy Overview
          • Marketing Strategy
          • Product Strategy
          • Channel Strategy
      • First Choice Ingredients (DSM)
        • Overview
        • Product Portfolio
        • Profitability by Market Segments (Product/Age /Sales Channel/Region)
        • Sales Footprint
        • Strategy Overview
          • Marketing Strategy
          • Product Strategy
          • Channel Strategy
      • Butter Buds Inc.
        • Overview
        • Product Portfolio
        • Profitability by Market Segments (Product/Age /Sales Channel/Region)
        • Sales Footprint
        • Strategy Overview
          • Marketing Strategy
          • Product Strategy
          • Channel Strategy
      • GoBia Ltd
        • Overview
        • Product Portfolio
        • Profitability by Market Segments (Product/Age /Sales Channel/Region)
        • Sales Footprint
        • Strategy Overview
          • Marketing Strategy
          • Product Strategy
          • Channel Strategy
      • Puramio India Pvt Ltd
        • Overview
        • Product Portfolio
        • Profitability by Market Segments (Product/Age /Sales Channel/Region)
        • Sales Footprint
        • Strategy Overview
          • Marketing Strategy
          • Product Strategy
          • Channel Strategy
      • Jeneil Bioproducts GmbH
        • Overview
        • Product Portfolio
        • Profitability by Market Segments (Product/Age /Sales Channel/Region)
        • Sales Footprint
        • Strategy Overview
          • Marketing Strategy
          • Product Strategy
          • Channel Strategy
  22. Assumptions & Acronyms Used
  23. Research Methodology

List of Tables

  • Table 1: Global Market Value (USD Billion) Forecast by Region, 2020-2035
  • Table 2: Global Market Volume (Kilotons) Forecast by Region, 2020-2035
  • Table 3: Global Market Value (USD Billion) Forecast by Product, 2020-2035
  • Table 4: Global Market Volume (Kilotons) Forecast by Product, 2020-2035
  • Table 5: Global Market Value (USD Billion) Forecast by Form, 2020-2035
  • Table 6: Global Market Volume (Kilotons) Forecast by Form, 2020-2035
  • Table 7: Global Market Value (USD Billion) Forecast by Buyer, 2020-2035
  • Table 8: Global Market Volume (Kilotons) Forecast by Buyer, 2020-2035
  • Table 9: Global Market Value (USD Billion) Forecast by Application, 2020-2035
  • Table 10: Global Market Volume (Kilotons) Forecast by Application, 2020-2035
  • Table 11: Global Market Value (USD Billion) Forecast by Sales Channel, 2020-2035
  • Table 12: Global Market Volume (Kilotons) Forecast by Sales Channel, 2020-2035
  • Table 13: North America Market Value (USD Billion) Forecast by Country, 2020-2035
  • Table 14: North America Market Volume (Kilotons) Forecast by Country, 2020-2035
  • Table 15: North America Market Value (USD Billion) Forecast by Product, 2020-2035
  • Table 16: North America Market Volume (Kilotons) Forecast by Product, 2020-2035
  • Table 17: North America Market Value (USD Billion) Forecast by Form, 2020-2035
  • Table 18: North America Market Volume (Kilotons) Forecast by Form, 2020-2035
  • Table 19: North America Market Value (USD Billion) Forecast by Buyer, 2020-2035
  • Table 20: North America Market Volume (Kilotons) Forecast by Buyer, 2020-2035
  • Table 21: North America Market Value (USD Billion) Forecast by Application, 2020-2035
  • Table 22: North America Market Volume (Kilotons) Forecast by Application, 2020-2035
  • Table 23: North America Market Value (USD Billion) Forecast by Sales Channel, 2020-2035
  • Table 24: North America Market Volume (Kilotons) Forecast by Sales Channel, 2020-2035
  • Table 25: Latin America Market Value (USD Billion) Forecast by Country, 2020-2035
  • Table 26: Latin America Market Volume (Kilotons) Forecast by Country, 2020-2035
  • Table 27: Latin America Market Value (USD Billion) Forecast by Product, 2020-2035
  • Table 28: Latin America Market Volume (Kilotons) Forecast by Product, 2020-2035
  • Table 29: Latin America Market Value (USD Billion) Forecast by Form, 2020-2035
  • Table 30: Latin America Market Volume (Kilotons) Forecast by Form, 2020-2035
  • Table 31: Latin America Market Value (USD Billion) Forecast by Buyer, 2020-2035
  • Table 32: Latin America Market Volume (Kilotons) Forecast by Buyer, 2020-2035
  • Table 33: Latin America Market Value (USD Billion) Forecast by Application, 2020-2035
  • Table 34: Latin America Market Volume (Kilotons) Forecast by Application, 2020-2035
  • Table 35: Latin America Market Value (USD Billion) Forecast by Sales Channel, 2020-2035
  • Table 36: Latin America Market Volume (Kilotons) Forecast by Sales Channel, 2020-2035
  • Table 37: Western Europe Market Value (USD Billion) Forecast by Country, 2020-2035
  • Table 38: Western Europe Market Volume (Kilotons) Forecast by Country, 2020-2035
  • Table 39: Western Europe Market Value (USD Billion) Forecast by Product, 2020-2035
  • Table 40: Western Europe Market Volume (Kilotons) Forecast by Product, 2020-2035
  • Table 41: Western Europe Market Value (USD Billion) Forecast by Form, 2020-2035
  • Table 42: Western Europe Market Volume (Kilotons) Forecast by Form, 2020-2035
  • Table 43: Western Europe Market Value (USD Billion) Forecast by Buyer, 2020-2035
  • Table 44: Western Europe Market Volume (Kilotons) Forecast by Buyer, 2020-2035
  • Table 45: Western Europe Market Value (USD Billion) Forecast by Application, 2020-2035
  • Table 46: Western Europe Market Volume (Kilotons) Forecast by Application, 2020-2035
  • Table 47: Western Europe Market Value (USD Billion) Forecast by Sales Channel, 2020-2035
  • Table 48: Western Europe Market Volume (Kilotons) Forecast by Sales Channel, 2020-2035
  • Table 49: Eastern Europe Market Value (USD Billion) Forecast by Country, 2020-2035
  • Table 50: Eastern Europe Market Volume (Kilotons) Forecast by Country, 2020-2035
  • Table 51: Eastern Europe Market Value (USD Billion) Forecast by Product, 2020-2035
  • Table 52: Eastern Europe Market Volume (Kilotons) Forecast by Product, 2020-2035
  • Table 53: Eastern Europe Market Value (USD Billion) Forecast by Form, 2020-2035
  • Table 54: Eastern Europe Market Volume (Kilotons) Forecast by Form, 2020-2035
  • Table 55: Eastern Europe Market Value (USD Billion) Forecast by Buyer, 2020-2035
  • Table 56: Eastern Europe Market Volume (Kilotons) Forecast by Buyer, 2020-2035
  • Table 57: Eastern Europe Market Value (USD Billion) Forecast by Application, 2020-2035
  • Table 58: Eastern Europe Market Volume (Kilotons) Forecast by Application, 2020-2035
  • Table 59: Eastern Europe Market Value (USD Billion) Forecast by Sales Channel, 2020-2035
  • Table 60: Eastern Europe Market Volume (Kilotons) Forecast by Sales Channel, 2020-2035
  • Table 61: East Asia Market Value (USD Billion) Forecast by Country, 2020-2035
  • Table 62: East Asia Market Volume (Kilotons) Forecast by Country, 2020-2035
  • Table 63: East Asia Market Value (USD Billion) Forecast by Product, 2020-2035
  • Table 64: East Asia Market Volume (Kilotons) Forecast by Product, 2020-2035
  • Table 65: East Asia Market Value (USD Billion) Forecast by Form, 2020-2035
  • Table 66: East Asia Market Volume (Kilotons) Forecast by Form, 2020-2035
  • Table 67: East Asia Market Value (USD Billion) Forecast by Buyer, 2020-2035
  • Table 68: East Asia Market Volume (Kilotons) Forecast by Buyer, 2020-2035
  • Table 69: East Asia Market Value (USD Billion) Forecast by Application, 2020-2035
  • Table 70: East Asia Market Volume (Kilotons) Forecast by Application, 2020-2035
  • Table 71: East Asia Market Value (USD Billion) Forecast by Sales Channel, 2020-2035
  • Table 72: East Asia Market Volume (Kilotons) Forecast by Sales Channel, 2020-2035
  • Table 73: South Asia & Pacific Market Value (USD Billion) Forecast by Country, 2020-2035
  • Table 74: South Asia & Pacific Market Volume (Kilotons) Forecast by Country, 2020-2035
  • Table 75: South Asia & Pacific Market Value (USD Billion) Forecast by Product, 2020-2035
  • Table 76: South Asia & Pacific Market Volume (Kilotons) Forecast by Product, 2020-2035
  • Table 77: South Asia & Pacific Market Value (USD Billion) Forecast by Form, 2020-2035
  • Table 78: South Asia & Pacific Market Volume (Kilotons) Forecast by Form, 2020-2035
  • Table 79: South Asia & Pacific Market Value (USD Billion) Forecast by Buyer, 2020-2035
  • Table 80: South Asia & Pacific Market Volume (Kilotons) Forecast by Buyer, 2020-2035
  • Table 81: South Asia & Pacific Market Value (USD Billion) Forecast by Application, 2020-2035
  • Table 82: South Asia & Pacific Market Volume (Kilotons) Forecast by Application, 2020-2035
  • Table 83: South Asia & Pacific Market Value (USD Billion) Forecast by Sales Channel, 2020-2035
  • Table 84: South Asia & Pacific Market Volume (Kilotons) Forecast by Sales Channel, 2020-2035
  • Table 85: Middle East and Africa Market Value (USD Billion) Forecast by Country, 2020-2035
  • Table 86: Middle East and Africa Market Volume (Kilotons) Forecast by Country, 2020-2035
  • Table 87: Middle East and Africa Market Value (USD Billion) Forecast by Product, 2020-2035
  • Table 88: Middle East and Africa Market Volume (Kilotons) Forecast by Product, 2020-2035
  • Table 89: Middle East and Africa Market Value (USD Billion) Forecast by Form, 2020-2035
  • Table 90: Middle East and Africa Market Volume (Kilotons) Forecast by Form, 2020-2035
  • Table 91: Middle East and Africa Market Value (USD Billion) Forecast by Buyer, 2020-2035
  • Table 92: Middle East and Africa Market Volume (Kilotons) Forecast by Buyer, 2020-2035
  • Table 93: Middle East and Africa Market Value (USD Billion) Forecast by Application, 2020-2035
  • Table 94: Middle East and Africa Market Volume (Kilotons) Forecast by Application, 2020-2035
  • Table 95: Middle East and Africa Market Value (USD Billion) Forecast by Sales Channel, 2020-2035
  • Table 96: Middle East and Africa Market Volume (Kilotons) Forecast by Sales Channel, 2020-2035

List of Figures

  • Figure 1: Global Market Volume (Kilotons) Forecast 2020-2035
  • Figure 2: Global Market Pricing Analysis
  • Figure 3: Global Market Value (USD Billion) Forecast 2020-2035
  • Figure 4: Global Market Value Share and BPS Analysis by Product, 2025 and 2035
  • Figure 5: Global Market Y-o-Y Growth Comparison by Product, 2025-2035
  • Figure 6: Global Market Attractiveness Analysis by Product
  • Figure 7: Global Market Value Share and BPS Analysis by Form, 2025 and 2035
  • Figure 8: Global Market Y-o-Y Growth Comparison by Form, 2025-2035
  • Figure 9: Global Market Attractiveness Analysis by Form
  • Figure 10: Global Market Value Share and BPS Analysis by Buyer, 2025 and 2035
  • Figure 11: Global Market Y-o-Y Growth Comparison by Buyer, 2025-2035
  • Figure 12: Global Market Attractiveness Analysis by Buyer
  • Figure 13: Global Market Value Share and BPS Analysis by Application, 2025 and 2035
  • Figure 14: Global Market Y-o-Y Growth Comparison by Application, 2025-2035
  • Figure 15: Global Market Attractiveness Analysis by Application
  • Figure 16: Global Market Value Share and BPS Analysis by Sales Channel, 2025 and 2035
  • Figure 17: Global Market Y-o-Y Growth Comparison by Sales Channel, 2025-2035
  • Figure 18: Global Market Attractiveness Analysis by Sales Channel
  • Figure 19: Global Market Value (USD Billion) Share and BPS Analysis by Region, 2025 and 2035
  • Figure 20: Global Market Y-o-Y Growth Comparison by Region, 2025-2035
  • Figure 21: Global Market Attractiveness Analysis by Region
  • Figure 22: North America Market Incremental $ Opportunity, 2025-2035
  • Figure 23: Latin America Market Incremental $ Opportunity, 2025-2035
  • Figure 24: Western Europe Market Incremental $ Opportunity, 2025-2035
  • Figure 25: Eastern Europe Market Incremental $ Opportunity, 2025-2035
  • Figure 26: East Asia Market Incremental $ Opportunity, 2025-2035
  • Figure 27: South Asia & Pacific Market Incremental $ Opportunity, 2025-2035
  • Figure 28: Middle East and Africa Market Incremental $ Opportunity, 2025-2035
  • Figure 29: North America Market Value Share and BPS Analysis by Country, 2025 and 2035
  • Figure 30: North America Market Value Share and BPS Analysis by Product, 2025 and 2035
  • Figure 31: North America Market Y-o-Y Growth Comparison by Product, 2025-2035
  • Figure 32: North America Market Attractiveness Analysis by Product
  • Figure 33: North America Market Value Share and BPS Analysis by Form, 2025 and 2035
  • Figure 34: North America Market Y-o-Y Growth Comparison by Form, 2025-2035
  • Figure 35: North America Market Attractiveness Analysis by Form
  • Figure 36: North America Market Value Share and BPS Analysis by Buyer, 2025 and 2035
  • Figure 37: North America Market Y-o-Y Growth Comparison by Buyer, 2025-2035
  • Figure 38: North America Market Attractiveness Analysis by Buyer
  • Figure 39: North America Market Value Share and BPS Analysis by Application, 2025 and 2035
  • Figure 40: North America Market Y-o-Y Growth Comparison by Application, 2025-2035
  • Figure 41: North America Market Attractiveness Analysis by Application
  • Figure 42: North America Market Value Share and BPS Analysis by Sales Channel, 2025 and 2035
  • Figure 43: North America Market Y-o-Y Growth Comparison by Sales Channel, 2025-2035
  • Figure 44: North America Market Attractiveness Analysis by Sales Channel
  • Figure 45: Latin America Market Value Share and BPS Analysis by Country, 2025 and 2035
  • Figure 46: Latin America Market Value Share and BPS Analysis by Product, 2025 and 2035
  • Figure 47: Latin America Market Y-o-Y Growth Comparison by Product, 2025-2035
  • Figure 48: Latin America Market Attractiveness Analysis by Product
  • Figure 49: Latin America Market Value Share and BPS Analysis by Form, 2025 and 2035
  • Figure 50: Latin America Market Y-o-Y Growth Comparison by Form, 2025-2035
  • Figure 51: Latin America Market Attractiveness Analysis by Form
  • Figure 52: Latin America Market Value Share and BPS Analysis by Buyer, 2025 and 2035
  • Figure 53: Latin America Market Y-o-Y Growth Comparison by Buyer, 2025-2035
  • Figure 54: Latin America Market Attractiveness Analysis by Buyer
  • Figure 55: Latin America Market Value Share and BPS Analysis by Application, 2025 and 2035
  • Figure 56: Latin America Market Y-o-Y Growth Comparison by Application, 2025-2035
  • Figure 57: Latin America Market Attractiveness Analysis by Application
  • Figure 58: Latin America Market Value Share and BPS Analysis by Sales Channel, 2025 and 2035
  • Figure 59: Latin America Market Y-o-Y Growth Comparison by Sales Channel, 2025-2035
  • Figure 60: Latin America Market Attractiveness Analysis by Sales Channel
  • Figure 61: Western Europe Market Value Share and BPS Analysis by Country, 2025 and 2035
  • Figure 62: Western Europe Market Value Share and BPS Analysis by Product, 2025 and 2035
  • Figure 63: Western Europe Market Y-o-Y Growth Comparison by Product, 2025-2035
  • Figure 64: Western Europe Market Attractiveness Analysis by Product
  • Figure 65: Western Europe Market Value Share and BPS Analysis by Form, 2025 and 2035
  • Figure 66: Western Europe Market Y-o-Y Growth Comparison by Form, 2025-2035
  • Figure 67: Western Europe Market Attractiveness Analysis by Form
  • Figure 68: Western Europe Market Value Share and BPS Analysis by Buyer, 2025 and 2035
  • Figure 69: Western Europe Market Y-o-Y Growth Comparison by Buyer, 2025-2035
  • Figure 70: Western Europe Market Attractiveness Analysis by Buyer
  • Figure 71: Western Europe Market Value Share and BPS Analysis by Application, 2025 and 2035
  • Figure 72: Western Europe Market Y-o-Y Growth Comparison by Application, 2025-2035
  • Figure 73: Western Europe Market Attractiveness Analysis by Application
  • Figure 74: Western Europe Market Value Share and BPS Analysis by Sales Channel, 2025 and 2035
  • Figure 75: Western Europe Market Y-o-Y Growth Comparison by Sales Channel, 2025-2035
  • Figure 76: Western Europe Market Attractiveness Analysis by Sales Channel
  • Figure 77: Eastern Europe Market Value Share and BPS Analysis by Country, 2025 and 2035
  • Figure 78: Eastern Europe Market Value Share and BPS Analysis by Product, 2025 and 2035
  • Figure 79: Eastern Europe Market Y-o-Y Growth Comparison by Product, 2025-2035
  • Figure 80: Eastern Europe Market Attractiveness Analysis by Product
  • Figure 81: Eastern Europe Market Value Share and BPS Analysis by Form, 2025 and 2035
  • Figure 82: Eastern Europe Market Y-o-Y Growth Comparison by Form, 2025-2035
  • Figure 83: Eastern Europe Market Attractiveness Analysis by Form
  • Figure 84: Eastern Europe Market Value Share and BPS Analysis by Buyer, 2025 and 2035
  • Figure 85: Eastern Europe Market Y-o-Y Growth Comparison by Buyer, 2025-2035
  • Figure 86: Eastern Europe Market Attractiveness Analysis by Buyer
  • Figure 87: Eastern Europe Market Value Share and BPS Analysis by Application, 2025 and 2035
  • Figure 88: Eastern Europe Market Y-o-Y Growth Comparison by Application, 2025-2035
  • Figure 89: Eastern Europe Market Attractiveness Analysis by Application
  • Figure 90: Eastern Europe Market Value Share and BPS Analysis by Sales Channel, 2025 and 2035
  • Figure 91: Eastern Europe Market Y-o-Y Growth Comparison by Sales Channel, 2025-2035
  • Figure 92: Eastern Europe Market Attractiveness Analysis by Sales Channel
  • Figure 93: East Asia Market Value Share and BPS Analysis by Country, 2025 and 2035
  • Figure 94: East Asia Market Value Share and BPS Analysis by Product, 2025 and 2035
  • Figure 95: East Asia Market Y-o-Y Growth Comparison by Product, 2025-2035
  • Figure 96: East Asia Market Attractiveness Analysis by Product
  • Figure 97: East Asia Market Value Share and BPS Analysis by Form, 2025 and 2035
  • Figure 98: East Asia Market Y-o-Y Growth Comparison by Form, 2025-2035
  • Figure 99: East Asia Market Attractiveness Analysis by Form
  • Figure 100: East Asia Market Value Share and BPS Analysis by Buyer, 2025 and 2035
  • Figure 101: East Asia Market Y-o-Y Growth Comparison by Buyer, 2025-2035
  • Figure 102: East Asia Market Attractiveness Analysis by Buyer
  • Figure 103: East Asia Market Value Share and BPS Analysis by Application, 2025 and 2035
  • Figure 104: East Asia Market Y-o-Y Growth Comparison by Application, 2025-2035
  • Figure 105: East Asia Market Attractiveness Analysis by Application
  • Figure 106: East Asia Market Value Share and BPS Analysis by Sales Channel, 2025 and 2035
  • Figure 107: East Asia Market Y-o-Y Growth Comparison by Sales Channel, 2025-2035
  • Figure 108: East Asia Market Attractiveness Analysis by Sales Channel
  • Figure 109: South Asia & Pacific Market Value Share and BPS Analysis by Country, 2025 and 2035
  • Figure 110: South Asia & Pacific Market Value Share and BPS Analysis by Product, 2025 and 2035
  • Figure 111: South Asia & Pacific Market Y-o-Y Growth Comparison by Product, 2025-2035
  • Figure 112: South Asia & Pacific Market Attractiveness Analysis by Product
  • Figure 113: South Asia & Pacific Market Value Share and BPS Analysis by Form, 2025 and 2035
  • Figure 114: South Asia & Pacific Market Y-o-Y Growth Comparison by Form, 2025-2035
  • Figure 115: South Asia & Pacific Market Attractiveness Analysis by Form
  • Figure 116: South Asia & Pacific Market Value Share and BPS Analysis by Buyer, 2025 and 2035
  • Figure 117: South Asia & Pacific Market Y-o-Y Growth Comparison by Buyer, 2025-2035
  • Figure 118: South Asia & Pacific Market Attractiveness Analysis by Buyer
  • Figure 119: South Asia & Pacific Market Value Share and BPS Analysis by Application, 2025 and 2035
  • Figure 120: South Asia & Pacific Market Y-o-Y Growth Comparison by Application, 2025-2035
  • Figure 121: South Asia & Pacific Market Attractiveness Analysis by Application
  • Figure 122: South Asia & Pacific Market Value Share and BPS Analysis by Sales Channel, 2025 and 2035
  • Figure 123: South Asia & Pacific Market Y-o-Y Growth Comparison by Sales Channel, 2025-2035
  • Figure 124: South Asia & Pacific Market Attractiveness Analysis by Sales Channel
  • Figure 125: Middle East and Africa Market Value Share and BPS Analysis by Country, 2025 and 2035
  • Figure 126: Middle East and Africa Market Value Share and BPS Analysis by Product, 2025 and 2035
  • Figure 127: Middle East and Africa Market Y-o-Y Growth Comparison by Product, 2025-2035
  • Figure 128: Middle East and Africa Market Attractiveness Analysis by Product
  • Figure 129: Middle East and Africa Market Value Share and BPS Analysis by Form, 2025 and 2035
  • Figure 130: Middle East and Africa Market Y-o-Y Growth Comparison by Form, 2025-2035
  • Figure 131: Middle East and Africa Market Attractiveness Analysis by Form
  • Figure 132: Middle East and Africa Market Value Share and BPS Analysis by Buyer, 2025 and 2035
  • Figure 133: Middle East and Africa Market Y-o-Y Growth Comparison by Buyer, 2025-2035
  • Figure 134: Middle East and Africa Market Attractiveness Analysis by Buyer
  • Figure 135: Middle East and Africa Market Value Share and BPS Analysis by Application, 2025 and 2035
  • Figure 136: Middle East and Africa Market Y-o-Y Growth Comparison by Application, 2025-2035
  • Figure 137: Middle East and Africa Market Attractiveness Analysis by Application
  • Figure 138: Middle East and Africa Market Value Share and BPS Analysis by Sales Channel, 2025 and 2035
  • Figure 139: Middle East and Africa Market Y-o-Y Growth Comparison by Sales Channel, 2025-2035
  • Figure 140: Middle East and Africa Market Attractiveness Analysis by Sales Channel
  • Figure 141: Global Market - Tier Structure Analysis
  • Figure 142: Global Market - Company Share Analysis

Frequently Asked Questions

How big is the cheese concentrates market in 2025?

The global cheese concentrates market is estimated to be valued at USD 1.9 billion in 2025.

What will be the size of the cheese concentrates market in 2035?

The market size for cheese concentrates is projected to reach USD 3.1 billion by 2035.

How much will be the cheese concentrates market growth between 2025 and 2035?

The cheese concentrates market is expected to grow at a 5.0% CAGR between 2025 and 2035.

Which product type is projected to lead in the cheese concentrates market in 2025?

Cheddar cheese is projected to lead in the cheese concentrates market with 38% market share in 2025.

Which form segment is expected to dominate the cheese concentrates market in 2025?

The powder form segment is expected to dominate with 45% market share in 2025.

Explore Similar Insights

Future Market Insights

Cheese Concentrates Market

Chat With

MaRIA

Hi There, I am MaRIA, Your Market Research Intelligence Assistant. How may I help you?