Vegan Hyaluronic Acid Market Size and Share Forecast Outlook 2025 to 2035

The Vegan Hyaluronic Acid Market is anticipated to secure a valuation of USD 2,602.3 million in 2025, expanding to USD 8,125.1 million by 2035. This progression represents an absolute growth of USD 5,522.8 million, equivalent to a threefold expansion over the period. A compound annual growth rate (CAGR) of 12.1% has been projected, highlighting consistent acceleration in demand across global regions.
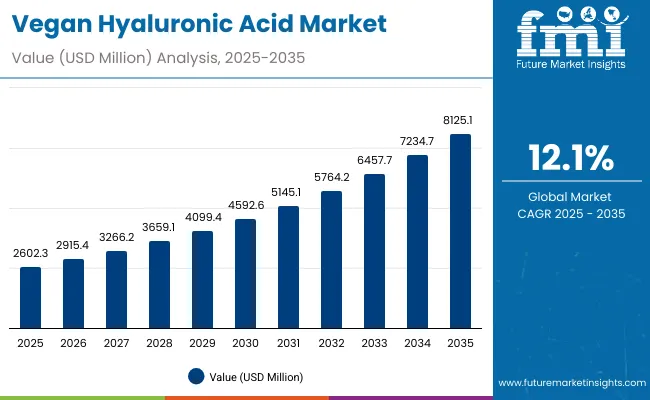
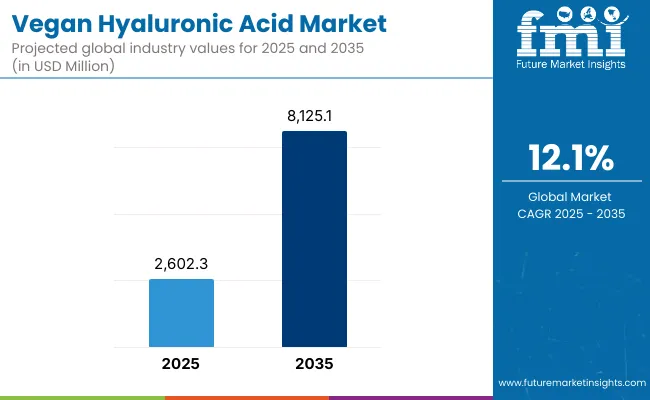
Vegan Hyaluronic Acid Market Value Analysis

Quick Stats for Vegan Hyaluronic Acid Market

  • Vegan Hyaluronic Acid Market Value (2025): USD 2,602.3 million
  • Vegan Hyaluronic Acid Market Forecast Value (2035): USD 8,125.1 million
  • Vegan Hyaluronic Acid Market Forecast CAGR: 12.1%
  • Leading Segment in Vegan Hyaluronic Acid Market in 2025: Fermentation-derived (64.6%)
  • Key Growth Regions in the Vegan Hyaluronic Acid Market: Asia-Pacific, Europe, North America
  • Top Key Players in Vegan Hyaluronic Acid Market: Bloomage Biotech, DSM-Firmenich, Evonik, Contipro, Kewpie, Givaudan, Croda, Roquette, Ashland, Lubrizol

Vegan Hyaluronic Acid Market

Vegan Hyaluronic Acid Market Key Takeaways

Metric Value
Vegan Hyaluronic Acid Market Estimated Value in (2025E) USD 2,602.3 million
Vegan Hyaluronic Acid Market Forecast Value in (2035F) USD 8,125.1 million
Forecast CAGR (2025 to 2035) 12.10%

During the initial half of the forecast window, between 2025 and 2030, the market is set to advance from USD 2,602.3 million to USD 4,592.6 million, adding nearly USD 1,990.3 million in value, which accounts for approximately 36% of the overall decade’s growth. This initial momentum is expected to be underpinned by rising adoption of clean-label antioxidant-rich formulations in nutrition, skincare, and preventive health sectors.

The latter phase, extending from 2030 to 2035, will contribute a significant USD 3,532.5 million, translating to 64% of the decade’s incremental gains, as the market surges from USD 4,592.6 million to USD 8,125.1 million. This acceleration is expected to be supported by advancements in extraction technologies, improved bioavailability, and widespread consumer acceptance of functional botanicals as preventive healthcare becomes mainstream.

A stronger push from emerging economies, particularly in Asia, is likely to reinforce growth, with cultivated sources and clinically validated extracts gaining priority. As regulatory clarity strengthens and validated supply chains expand, antioxidant-rich Sea Buckthorn is positioned to emerge as a cornerstone ingredient in the nutraceutical and cosmeceutical landscapes through 2035.

From 2020 to 2024, the Vegan Hyaluronic Acid Market expanded steadily, supported by rising demand for clean-label nutraceuticals and premium cosmeceuticals. During this period, fermentation-derived sources began to dominate, holding nearly two-thirds of total value by 2024, while hydration applications were established as the leading function.

Competitive dynamics were shaped by companies such as Bloomage Biotech, DSM-Firmenich, and Evonik, which strengthened their positions through bioactive standardization and cross-industry partnerships. Growth was also reinforced by rising investments in clinical validation and sustainable sourcing.

Looking ahead, the market is expected to accelerate toward USD 8,125.1 million by 2035, with Asia-Pacific driving the highest incremental gains. Competitive differentiation is forecasted to shift from raw ingredient supply toward ecosystem-based offerings, including traceability, formulation support, and digital-first consumer engagement. Leaders that integrate transparency, sustainability, and clinically supported outcomes are anticipated to secure long-term competitive advantage.

Why the Vegan Hyaluronic Acid Market is growing?

Growth in the Vegan Hyaluronic Acid Market is being driven by rising consumer preference for natural and clean-label products, reinforced by increasing awareness of antioxidant benefits in preventive health and skin wellness. Demand is being strengthened by clinical validation of bioactive compounds, including flavonoids, vitamins, and omega fatty acids, which are associated with improved immunity, cardiovascular support, and barrier restoration.

Adoption is being accelerated by the convergence of nutraceuticals and cosmeceuticals, where beauty-from-within and functional nutrition concepts are being embraced by both consumers and healthcare professionals. Expansion is being supported by e-commerce penetration and D2C brand strategies, which are enabling wider product access and education-driven marketing.

Technological advances in sustainable cultivation, extraction, and encapsulation are being positioned to ensure higher bioavailability and traceability. Over the forecast horizon, the market is expected to be propelled by growing emphasis on holistic wellness, clinical evidence, and eco-friendly positioning, securing long-term relevance and scalability.

Segmental Analysis

The Vegan Hyaluronic Acid Market has been segmented across multiple dimensions to provide clarity on key growth drivers. Segmentation by source, function, and claim has been adopted to highlight how demand patterns are shifting across supply chains, consumer preferences, and application benefits. Each segment offers distinct insights into value creation and competitive positioning.

Fermentation-derived sources are expected to lead with efficiency in extraction and standardization, hydration-based functions are gaining traction as consumers focus on skin barrier restoration, and vegan-certified claims are shaping brand narratives in both nutraceuticals and cosmeceuticals. By analyzing these categories, the evolving structure of demand can be understood, showcasing how natural positioning, validated efficacy, and ethical claims are aligning to influence adoption globally.
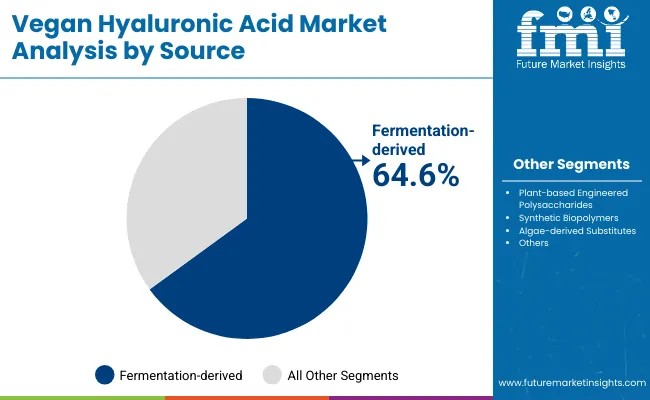
Insights into the Source Segment with Fermentation-derived Leading

Vegan Hyaluronic Acid Market By Source

Segment Market Value Share, 2025
Fermentation-derived 64.6%
Others 35.4%

Fermentation-derived sources are expected to command a 64.6% share of theVegan Hyaluronic Acid Market in 2025, valued at USD 1,680.8 million. Growth is being driven by advancements in biotechnological processes that ensure higher purity, standardized potency, and scalability compared to traditional extraction methods.

Demand is being reinforced by the rising preference for sustainable and traceable supply chains, as fermentation allows consistent yields independent of climatic fluctuations. Increasing validation from regulatory bodies and clinical researchers is further supporting adoption in nutraceuticals and cosmeceuticals. As cost efficiencies improve and quality assurances strengthen, fermentation-derived sources are expected to retain their leadership, providing manufacturers with reliable inputs for premium-positioned products across global markets.
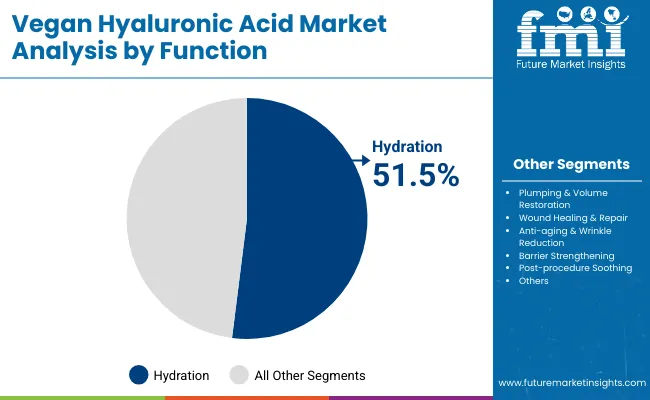
Insights into the Function Segment with Hydration Dominating

Vegan Hyaluronic Acid Market By Function

Segment Market Value Share, 2025
Hydration 51.5%
Others 48.5%

Hydration functions are projected to represent 51.5% of the Vegan Hyaluronic Acid Market in 2025, equivalent to USD 1,339.4 million. Growth is being sustained by strong consumer demand for skin barrier protection, moisture retention, and anti-aging solutions supported by antioxidant efficacy. Sea Buckthorn’s natural omega and flavonoid profiles are being positioned as highly effective for maintaining elasticity and reducing oxidative stress, making hydration a central claim across formulations.

Adoption is being accelerated by dermatology clinics and cosmeceutical brands promoting barrier-strengthening benefits for sensitive and aging skin. As awareness of water-loss prevention and environmental stress defense grows, hydration-focused formulations are expected to dominate, positioning this function as a cornerstone of product innovation and consumer loyalty within the segment.
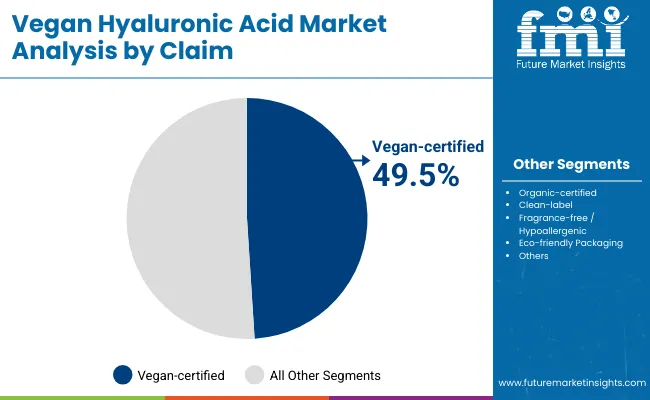
Insights into the Claim Segment with Vegan-certified Expanding

Vegan Hyaluronic Acid Market By Claim

Segment Market Value Share, 2025
Vegan-certified 49.5%
Others 50.5%

Vegan-certified claims are forecasted to secure 49.5% of the Vegan Hyaluronic Acid Market in 2025, generating USD 1,286.9 million. Expansion is being supported by the growing consumer inclination toward ethical, sustainable, and plant-based products. Certification is acting as a key differentiator for brands, providing reassurance of cruelty-free sourcing and alignment with clean-label expectations.

Adoption is being encouraged by regulatory clarity and increased retail demand for certified, transparent labeling. Vegan certification is also driving trust among younger demographics seeking eco-conscious and socially responsible choices. With ethical branding and sustainability narratives gaining momentum across the nutraceutical and personal care landscape, vegan-certified products are expected to sustain their strong growth trajectory and increase market penetration over the decade.

What are the Drivers, Restraints, and Key Trends of the VEGAN HYALURONIC ACID Market?

The Vegan Hyaluronic Acid Market is being shaped by evolving dynamics where cost barriers and regulatory complexities coexist with growing scientific validation, functional innovation, and consumer preference for natural antioxidants, positioning the category as a critical pillar of future nutraceutical and cosmeceutical adoption.

Clinical Standardization and Bioactive Validation

Market growth is being propelled by the increasing focus on standardized bioactive compositions, such as omega-7 fatty acids, polyphenols, and flavonoids, validated through controlled clinical trials. This scientific rigor is enabling stronger differentiation in premium nutraceutical and skincare categories, moving products beyond generic antioxidant claims.

Clinical substantiation is fostering partnerships between ingredient suppliers, academic researchers, and pharmaceutical stakeholders, ensuring that formulations align with pharmacopoeial standards and achieve broader acceptance among healthcare professionals.

This driver is expected to reinforce consumer trust, strengthen regulatory compliance, and open pathways into prescription-adjacent functional solutions, elevating Sea Buckthorn from a niche botanical to a clinically credible ingredient across multiple high-value applications.

Agronomic Volatility and Regional Supply Risk

Expansion is being constrained by agricultural volatility, as Sea Buckthorn cultivation is highly sensitive to altitude, soil salinity, and temperature fluctuations. Climate variability and limited mechanization are resulting in inconsistent yields, which complicates supply planning and raises costs for manufacturers.

Dependence on wild harvests in certain regions is creating further challenges in ensuring consistent phytochemical profiles and meeting global demand for standardized inputs. These constraints are magnified by logistical inefficiencies in high-altitude regions, where transport and processing infrastructure remain underdeveloped.

Unless supply chains are stabilized through contract farming, irrigation modernization, and cultivation diversification, the ability to scale reliably will remain limited, restraining the pace of global adoption despite increasing downstream demand.
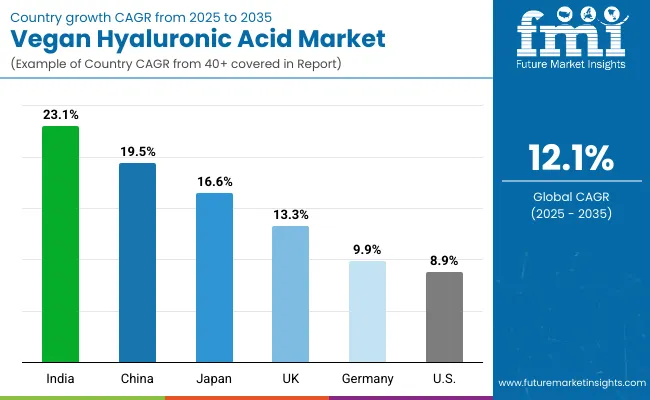
Analysis of Vegan Hyaluronic Acid Market By Key Countries

Vegan Hyaluronic Acid Market Country Wise Analysis

Country CAGR
China 19.5%
USA 8.9%
India 23.1%
UK 13.3%
Germany 9.9%
Japan 16.6%

The global Vegan Hyaluronic Acid Market demonstrates distinct growth trajectories across key countries, shaped by consumer health awareness, regulatory structures, and advances in cultivation practices. India is projected to record the fastest expansion with a CAGR of 23.1% between 2025 and 2035, supported by increasing adoption of preventive nutrition, rising disposable incomes, and the rapid growth of nutraceutical consumption.

China is forecasted to follow closely with a CAGR of 19.5%, driven by large-scale cultivation initiatives, growing cosmeceutical innovation, and rising demand for clean-label, antioxidant-rich products. Japan’s growth, estimated at 16.6%, is expected to be powered by its mature beauty and skincare industries, where Sea Buckthorn is being positioned as a premium anti-aging and hydration ingredient.

In Europe, the UK is projected to advance at a CAGR of 13.3%, reflecting strong momentum in clean-label supplementation and plant-based wellness markets. Germany, while expanding at a slower CAGR of 9.9%, is expected to benefit from regulatory-driven quality standards and the country’s emphasis on evidence-based nutraceuticals.

The USA is anticipated to grow at a CAGR of 8.9%, representing a mature but steadily expanding market where premium cosmeceuticals and functional beverages are driving incremental adoption. Collectively, these country-level variations underline how regional demand drivers and regulatory environments are expected to shape the competitive landscape of antioxidant-rich Sea Buckthorn over the next decade.
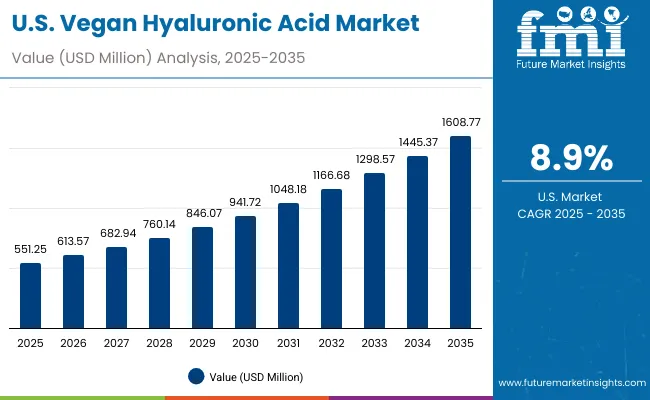
Sales Outlook for Vegan Hyaluronic Acidin the United States

Usa Vegan Hyaluronic Acid Market

Year USA Market (USD Million)
2025 551.25
2026 613.57
2027 682.94
2028 760.14
2029 846.07
2030 941.72
2031 1,048.18
2032 1,166.68
2033 1,298.57
2034 1,445.37
2035 1,608.77

The Vegan Hyaluronic Acid Market in the United States is projected to expand at a CAGR of 12% from 2025 to 2035, reflecting steady acceleration in demand across nutraceuticals, functional beverages, and cosmeceuticals. Market valuation is expected to rise from USD 551.25 million in 2025 to USD 1,608.77 million by 2035. Expansion is being fueled by a strong consumer shift toward natural antioxidants and clean-label health solutions, supported by clinical evidence highlighting Sea Buckthorn’s efficacy in skin hydration, anti-aging, and immune reinforcement.

Growth is also being strengthened by the integration of bioactive-rich formulations into dermatology-led skincare ranges and wellness-focused dietary supplements. The USA landscape is being further shaped by transparent supply chains, e-commerce distribution, and advances in extraction technologies that ensure potency and bioavailability.

  • Functional beverage manufacturers are integrating Sea Buckthorn extracts for antioxidant positioning and immunity-boosting claims.
  • Dermatology-led cosmeceutical brands are emphasizing hydration and anti-aging benefits, creating stronger consumer engagement through clinically supported claims.

Growth and Expansion Outlook for Vegan Hyaluronic Acid Market in the United Kingdom

The Vegan Hyaluronic Acid Market in the United Kingdom is projected to expand at a CAGR of 13.3% through 2035. Growth is expected to be underpinned by pharmacy-led dermacosmetics, premium supplementation, and retailer preference for evidentiary claims. Fermentation-derived inputs are likely to be prioritized for batch-to-batch consistency, while hydration-focused positioning is expected to anchor skincare launches.

Vegan-certified labelling is anticipated to resonate with ethical shoppers and support price realization. E-commerce and specialty retail are expected to drive discovery, with clinicians and aestheticians influencing regimen adoption. Sustainability requirements around packaging and supply-chain traceability are likely to shape vendor selection, rewarding transparent COA practices and stable sensory profiles for beverage formats.

  • Pharmacy and clinic endorsements expected to accelerate regimen adoption
  • Fermentation-derived sourcing favored for reproducible specifications
  • Hydration-led claims anticipated to anchor dermacosmetic ranges
  • Vegan certification expected to reinforce premium price ladders

Growth and Expansion Outlook for Vegan Hyaluronic Acid Market in India

TheVegan Hyaluronic Acid Market in India is projected to expand at a CAGR of 23.1% over 2025 to 2035. Growth is expected to be catalyzed by mainstreamization of preventive nutrition, fast-scaling e-commerce, and Ayurveda-aligned botanicals positioned with modern clinical narratives. Contract farming and domestic processing pilots are likely to reduce import dependence and variability.

Hydration and barrier-strengthening claims are expected to proliferate across mass and masstige skincare, supported by dermatologist content. Sachetization and localized flavor systems are anticipated to expand penetration in functional beverages. Regulatory clarity around labelling and contaminant thresholds is expected to favor standardized, fermentation-derived inputs and audited traceability.

  • Contract farming and localized extraction expected to stabilize supply
  • Dermatology content anticipated to normalize premium pricing
  • Vegan-certified claims likely to broaden urban adoption
  • Sachet-led beverage formats expected to widen access

Sales Outlook for Vegan Hyaluronic Acidin China

The Vegan Hyaluronic Acid Market in China is projected to expand at a CAGR of 19.5% to 2035. Momentum is expected from cosmeceutical innovation, cross-border and domestic e-commerce, and traditional-wellness alignment reframed with clinical endpoints. Cultivation zones are likely to scale under quality programs emphasizing pesticide-residue control and standardized omega/polyphenol profiles.

Hydration, redness relief, and post-procedure soothing are expected to feature in dermatologist-influenced assortments. Fermentation-derived, pharmacopoeia-aligned inputs are anticipated to strengthen OEM partnerships and accelerate NMPA-compliant launches. Live-commerce formats are expected to compress education cycles and lift premium tiers.
  • Quality programs expected to tighten residue and authenticity controls Hydration and soothing claims anticipated to dominate dermocosmetics
  • Fermentation-derived inputs likely to support fast regulatory clearance E-commerce activations expected to premiumize assortments

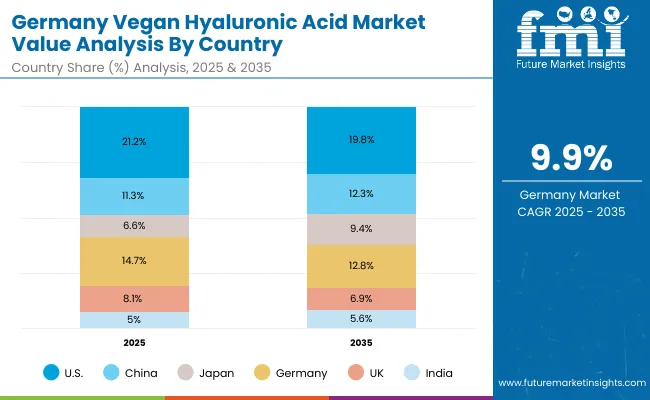
In-depth Analysis of Vegan Hyaluronic Acidin Germany

Germany Vegan Hyaluronic Acid Market

Countries 2025
USA 21.2%
China 11.3%
Japan 6.6%
Germany 14.7%
UK 8.1%
India 5.0%
Countries 2035
USA 19.8%
China 12.3%
Japan 9.4%
Germany 12.8%
UK 6.9%
India 5.6%

The Vegan Hyaluronic Acid Market in Germany is projected to expand at a CAGR of 9.9% during 2025 to 2035. Expansion is expected to reflect evidence-led consumer behavior, pharmacist-mediated recommendations, and strict conformity with EU quality frameworks. Organic and vegan certifications are likely to remain decisive purchase cues, while fermentation-derived inputs are expected to secure preference for reproducibility and safety dossiers.

Hydration-centric cosmeceuticals and clinically characterized supplements are anticipated to lead, with traceable, low-oxidation oils prioritized for stability. Brick-and-mortar pharmacies and specialty health retail are expected to anchor trial, complemented by disciplined D2C education.
  • Pharmacist channels expected to validate clinical positioning
  • Organic and vegan certifications likely to steer shelf placement
  • Fermentation-derived sourcing anticipated to ensure reproducible potency
  • Traceability and COA rigor expected to influence tenders and listings

Growth Outlook for Vegan Hyaluronic Acid Market in USA

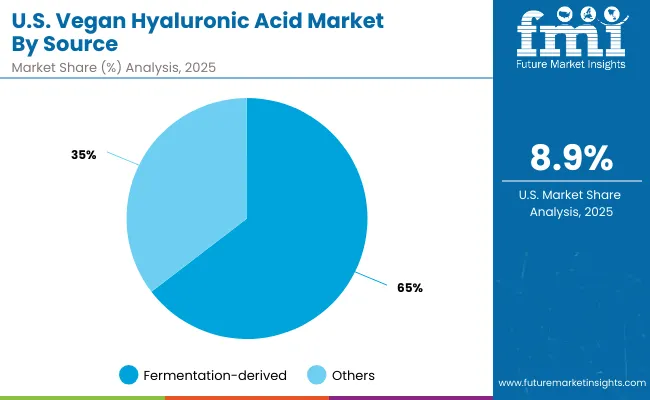
Usa Vegan Hyaluronic Acid Market By Source

Segment Market Value Share, 2025
Fermentation-derived 64.6%
Others 35.4%

The vegan hyaluronic acid market in the United States is projected at USD 551.25 million in 2025. Fermentation-derived sources contribute 64.6%, while others hold 35.4%, indicating a strong preference toward biotechnological production methods. This dominance of fermentation-derived inputs is being reinforced by growing consumer trust in sustainability, purity, and traceability of vegan-certified formulations. Increasing adoption of biotech-driven production is being favored due to its ability to ensure consistent quality, scalability, and alignment with regulatory frameworks that discourage animal-derived ingredients.

The “Others” segment, while smaller, is expected to retain relevance in niche applications, particularly where hybrid sourcing or cost optimization is sought. However, a gradual shift is anticipated toward fermentation processes as R&D investments accelerate, yielding higher yields and cost efficiencies.

Growth is also being shaped by rising demand for hydration-focused skincare, where fermentation-derived hyaluronic acid demonstrates superior molecular weight control and bioavailability. Nutraceutical manufacturers are increasingly exploring fermentation-based inputs to address consumer needs for joint health, wellness, and anti-aging benefits. Strategic partnerships between biotechnology firms and cosmetics leaders are expected to define future competition, as USA players emphasize innovation pipelines and certification-driven branding strategies.
  • Market in the United States is valued at USD 551.25 million in 2025
  • Fermentation-derived segment leads with 64.6%, compared to 35.4% for others
  • Growth is supported by clean-label demand, nutraceutical adoption, and biotechnology-driven innovation

Opportunity Analysis of China Vegan Hyaluronic Acid Market

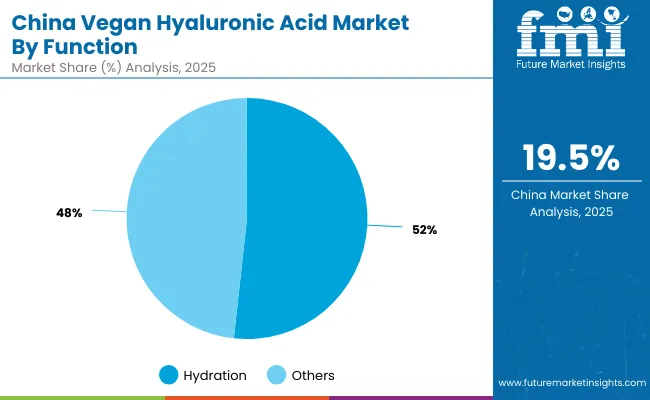
China Vegan Hyaluronic Acid Market By Function

Segment Market Value Share, 2025
Hydration 51.5%
Others 48.5%

The vegan hyaluronic acid market in China is projected at USD 294.06 million in 2025. Hydration-driven applications contribute 51.5%, while other functional categories account for 48.5%, reflecting a balanced distribution of demand. A marginal dominance of hydration is being reinforced by the growing preference for anti-aging, moisture retention, and elasticity-enhancing solutions in cosmetics and personal care. This trend is being accelerated by urban lifestyles, rising disposable incomes, and the increasing influence of global clean beauty standards in the Chinese market.

The “Others” segment, while slightly smaller, is expected to expand through applications in nutraceuticals, pharmaceuticals, and tissue-repair formulations, driven by the rising adoption of wellness-oriented supplements. As consumer awareness of vegan-certified ingredients continues to build, product differentiation is being shaped by purity, molecular weight customization, and clinical validation.

The Chinese market is expected to be propelled by rapid biotechnology advancements and domestic R&D investment, enabling cost-efficient production and broader functional diversification. Multinational collaborations with local firms are projected to accelerate innovation pipelines, ensuring consistent supply and global export potential. Functional versatility beyond hydration — such as wound healing and regenerative applications — is anticipated to emerge as a long-term growth catalyst.
  • Market in China is valued at USD 294.06 million in 2025
  • Hydration accounts for 51.5%, while other functions represent 48.5%
  • Growth is supported by premium skincare demand, nutraceutical adoption, and biotechnology-driven product diversification

Competitive Landscape of Vegan Hyaluronic Acid Market

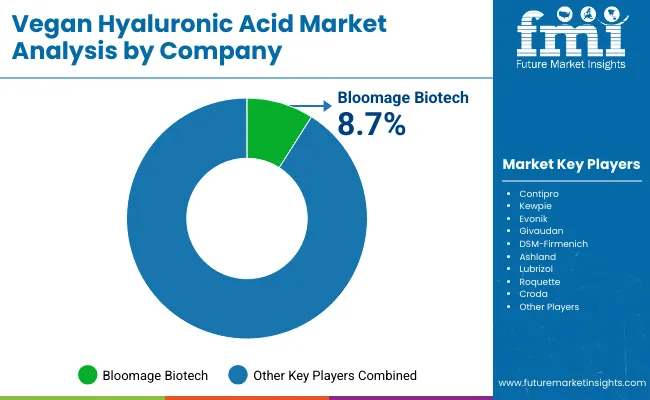
Vegan Hyaluronic Acid Market By Company

Comapany Global Value Share 2025
Bloomage Biotech 8.7%
Others 91.3%

The Vegan Hyaluronic Acid Market is moderately fragmented, with established global leaders, regional innovators, and specialized suppliers shaping competitive dynamics. Large-scale players such as Bloomage Biotech, DSM-Firmenich, and Evonik are positioned as key influencers, leveraging advanced extraction technologies, clinical validation programs, and strong global distribution. Their portfolios are increasingly aligned with vegan-certified, clean-label trends, ensuring stronger penetration in nutraceutical and cosmeceutical applications. Bloomage Biotech dominates with a global value share of 8.7% in 2025, making it the largest single company in this market. Its estimated share in 2024 is around 8.5%, reflecting steady leadership.

Mid-sized innovators such as Contipro, Kewpie, and Roquette are contributing significantly by supplying high-quality fermentation-derived inputs and specialty formulations that cater to regional needs. Their strategies emphasize supply reliability, cost efficiency, and partnerships with beauty and nutrition brands. Companies like Givaudan, Croda, Ashland, and Lubrizol are entering the market through active ingredient diversification, positioning antioxidant-rich Sea Buckthorn alongside their broader functional actives portfolios.

Niche-focused suppliers are building strength through traceability, localized sourcing, and application-specific customization, particularly for markets emphasizing organic and eco-friendly claims. Competitive differentiation is expected to move beyond raw material supply toward integrated solutions, combining science-backed formulations, transparent labelling, and sustainability-driven narratives to capture long-term brand loyalty.

Key Developments in Vegan Hyaluronic Acid Market

  • March 2025 - Bloomage Biotech won the prestigious Allē Award for breakthrough sustainable skincare innovation. The recognition was awarded for advanced biotechdriven formulations leveraging skin science and clean-label positioning, positioning Sea Buckthorn as a high-performance cosmeceutical ingredient across premium beauty and dermatology segments.
  • April 2025 - Bloomage Biotech initiated a strategic business transformation under new leadership. The "Skin Science Innovation and Transformation" business line was introduced by Chairman Zhao Yan, signaling a shift from consumer-goods marketing toward R&D-led, efficacy-based medicalgrade Sea Buckthorn applications.

Scope of the Report

Item Value
Quantitative Units USD 2,602.3 million (2025), USD 8,125.1 million (2035), CAGR 12.1% (2025 to 2035)
Source Fermentation-derived, Plant-based polysaccharides, Synthetic biopolymers, Algae-derived substitutes
Function Hydration & moisture-binding, Plumping & volume restoration, Wound healing & repair, Anti-aging & wrinkle reduction, Barrier strengthening, Post-procedure soothing
Product Type Serums & ampoules, Creams & lotions, Masks & patches, Capsules/ nutricosmetics , Sprays & mists, Injectables
Claim Vegan-certified, Organic-certified, Clean-label, Fragrance-free/Hypoallergenic, Eco-friendly packaging
End-use Industry Dermatology clinics, Mass retail, Pharmacies & drugstores, Specialty beauty retailers, E-commerce marketplaces, D2C brand websites
Regions Covered North America, Europe, Asia-Pacific, Latin America, Middle East & Africa
Countries Covered United States, Canada, Germany, France, United Kingdom, China, Japan, India, Brazil, South Korea
Key Companies Profiled Bloomage Biotech, DSM- Firmenich , Evonik , Contipro , Kewpie, Givaudan , Croda , Roquette , Ashland, Lubrizol
Additional Attributes Market size and forecast by source, function, and claim; adoption trends in cosmeceuticals, nutraceuticals, and functional beverages; rising demand for vegan-certified and clean-label ingredients; growing influence of e-commerce; technological advances in extraction and encapsulation; regulatory frameworks shaping quality standards; sustainability and traceability trends driving competitive positioning

Key Segments

By Source:

  • Fermentation-derived (bacterial, yeast, fungal)
  • Plant-based engineered polysaccharides
  • Synthetic biopolymers
  • Algae-derived substitutes

By Function:

  • Hydration & moisture-binding
  • Plumping & volume restoration
  • Wound healing & repair
  • Anti-aging & wrinkle reduction
  • Barrier strengthening
  • Post-procedure soothing

By Product Type:

  • Serums & ampoules
  • Creams & lotions
  • Masks & patches
  • Capsules/nutricosmetics
  • Sprays & mists
  • Injectables

By Channel:

  • E-commerce marketplaces
  • D2C brand websites
  • Pharmacies & drugstores
  • Specialty beauty retailers
  • Dermatology clinics
  • Mass retail

By Claim:

  • Vegan-certified
  • Organic-certified
  • Clean-label
  • Fragrance-free/hypoallergenic
  • Eco-friendly packaging

By End User:

  • Women
  • Men
  • Unisex
  • Sensitive skin

By Region:

  • North America
  • Latin America
  • Europe
  • East Asia
  • South Asia & Pacific
  • Middle East and Africa

Table of Content

  1. Executive Summary
    • Global Market Outlook
    • Demand-side Trends
    • Supply-side Trends
    • Technology Roadmap Analysis
    • Analysis and Recommendations
  2. Market Overview
    • Market Coverage / Taxonomy
    • Market Definition / Scope / Limitations
  3. Market Background
    • Market Dynamics
      • Drivers
      • Restraints
      • Opportunity
      • Trends
    • Scenario Forecast
      • Demand in Optimistic Scenario
      • Demand in Likely Scenario
      • Demand in Conservative Scenario
    • Opportunity Map Analysis
    • Product Life Cycle Analysis
    • Supply Chain Analysis
      • Supply Side Participants and their Roles
        • Producers
        • Mid-Level Participants (Traders/ Agents/ Brokers)
        • Wholesalers and Distributors
      • Value Added and Value Created at Node in the Supply Chain
      • List of Raw Material Suppliers
      • List of Existing and Potential Buyer’s
    • Investment Feasibility Matrix
    • Value Chain Analysis
      • Profit Margin Analysis
      • Wholesalers and Distributors
      • Retailers
    • PESTLE and Porter’s Analysis
    • Regulatory Landscape
      • By Key Regions
      • By Key Countries
    • Regional Parent Market Outlook
    • Production and Consumption Statistics
    • Import and Export Statistics
  4. Global Market Analysis 2020 to 2024 and Forecast, 2025 to 2035
    • Historical Market Size Value (USD Million) & Volume (Units) Analysis, 2020 to 2024
    • Current and Future Market Size Value (USD Million) & Volume (Units) Projections, 2025 to 2035
      • Y-o-Y Growth Trend Analysis
      • Absolute $ Opportunity Analysis
  5. Global Market Analysis 2020 to 2024 and Forecast 2025 to 2035, By Source
    • Introduction / Key Findings
    • Historical Market Size Value (USD Million) & Volume (Units) Analysis By Source, 2020 to 2024
    • Current and Future Market Size Value (USD Million) & Volume (Units) Analysis and Forecast By Source, 2025 to 2035
      • Fermentation-derived (bacterial, yeast, fungal)
      • Plant-based engineered polysaccharides
      • Synthetic biopolymers
      • Algae-derived substitutes
    • Y-o-Y Growth Trend Analysis By Source, 2020 to 2024
    • Absolute $ Opportunity Analysis By Source, 2025 to 2035
  6. Global Market Analysis 2020 to 2024 and Forecast 2025 to 2035, By Function
    • Introduction / Key Findings
    • Historical Market Size Value (USD Million) & Volume (Units) Analysis By Function, 2020 to 2024
    • Current and Future Market Size Value (USD Million) & Volume (Units) Analysis and Forecast By Function, 2025 to 2035
      • Hydration & moisture-binding
      • Plumping & volume restoration
      • Wound healing & repair
      • Anti-aging & wrinkle reduction
      • Barrier strengthening
      • Post-procedure soothing
    • Y-o-Y Growth Trend Analysis By Function, 2020 to 2024
    • Absolute $ Opportunity Analysis By Function, 2025 to 2035
  7. Global Market Analysis 2020 to 2024 and Forecast 2025 to 2035, By Product Type
    • Introduction / Key Findings
    • Historical Market Size Value (USD Million) & Volume (Units) Analysis By Product Type, 2020 to 2024
    • Current and Future Market Size Value (USD Million) & Volume (Units) Analysis and Forecast By Product Type, 2025 to 2035
      • Serums & ampoules
      • Creams & lotions
      • Masks & patches
      • Capsules/nutricosmetics
      • Sprays & mists
      • Injectables
    • Y-o-Y Growth Trend Analysis By Product Type, 2020 to 2024
    • Absolute $ Opportunity Analysis By Product Type, 2025 to 2035
  8. Global Market Analysis 2020 to 2024 and Forecast 2025 to 2035, By Channel
    • Introduction / Key Findings
    • Historical Market Size Value (USD Million) & Volume (Units) Analysis By Channel, 2020 to 2024
    • Current and Future Market Size Value (USD Million) & Volume (Units) Analysis and Forecast By Channel, 2025 to 2035
      • E-commerce marketplaces
      • D2C brand websites
      • Pharmacies & drugstores
      • Specialty beauty retailers
      • Dermatology clinics
      • Mass retail
    • Y-o-Y Growth Trend Analysis By Channel, 2020 to 2024
    • Absolute $ Opportunity Analysis By Channel, 2025 to 2035
  9. Global Market Analysis 2020 to 2024 and Forecast 2025 to 2035, By Claim
    • Introduction / Key Findings
    • Historical Market Size Value (USD Million) & Volume (Units) Analysis By Claim, 2020 to 2024
    • Current and Future Market Size Value (USD Million) & Volume (Units) Analysis and Forecast By Claim, 2025 to 2035
      • Vegan-certified
      • Organic-certified
      • Clean-label
      • Fragrance-free/hypoallergenic
      • Eco-friendly packaging
    • Y-o-Y Growth Trend Analysis By Claim, 2020 to 2024
    • Absolute $ Opportunity Analysis By Claim, 2025 to 2035
  10. Global Market Analysis 2020 to 2024 and Forecast 2025 to 2035, By End User
    • Introduction / Key Findings
    • Historical Market Size Value (USD Million) & Volume (Units) Analysis By End User, 2020 to 2024
    • Current and Future Market Size Value (USD Million) & Volume (Units) Analysis and Forecast By End User, 2025 to 2035
      • Women
      • Men
      • Unisex
      • Sensitive skin
    • Y-o-Y Growth Trend Analysis By End User, 2020 to 2024
    • Absolute $ Opportunity Analysis By End User, 2025 to 2035
  11. Global Market Analysis 2020 to 2024 and Forecast 2025 to 2035, By Region
    • Introduction
    • Historical Market Size Value (USD Million) & Volume (Units) Analysis By Region, 2020 to 2024
    • Current Market Size Value (USD Million) & Volume (Units) Analysis and Forecast By Region, 2025 to 2035
      • North America
      • Latin America
      • Europe
      • East Asia
      • South Asia & Pacific
      • Middle East and Africa
    • Market Attractiveness Analysis By Region
  12. North America Market Analysis 2020 to 2024 and Forecast 2025 to 2035, By Country
    • Historical Market Size Value (USD Million) & Volume (Units) Trend Analysis By Market Taxonomy, 2020 to 2024
    • Market Size Value (USD Million) & Volume (Units) Forecast By Market Taxonomy, 2025 to 2035
      • By Country
        • USA
        • Canada
      • By Source
      • By Function
      • By Product Type
      • By Channel
      • By Claim
      • By End User
    • Market Attractiveness Analysis
      • By Country
      • By Source
      • By Function
      • By Product Type
      • By Channel
      • By Claim
      • By End User
    • Key Takeaways
  13. Latin America Market Analysis 2020 to 2024 and Forecast 2025 to 2035, By Country
    • Historical Market Size Value (USD Million) & Volume (Units) Trend Analysis By Market Taxonomy, 2020 to 2024
    • Market Size Value (USD Million) & Volume (Units) Forecast By Market Taxonomy, 2025 to 2035
      • By Country
        • Brazil
        • Mexico
        • Colombia
        • Rest of Latin America
      • By Source
      • By Function
      • By Product Type
      • By Channel
      • By Claim
      • By End User
    • Market Attractiveness Analysis
      • By Country
      • By Source
      • By Function
      • By Product Type
      • By Channel
      • By Claim
      • By End User
    • Key Takeaways
  14. Europe Market Analysis 2020 to 2024 and Forecast 2025 to 2035, By Country
    • Historical Market Size Value (USD Million) & Volume (Units) Trend Analysis By Market Taxonomy, 2020 to 2024
    • Market Size Value (USD Million) & Volume (Units) Forecast By Market Taxonomy, 2025 to 2035
      • By Country
        • Germany
        • UK
        • France
        • Italy
        • Spain
        • Belgium
        • Netherlands
        • Nordic
        • Switzerland
        • Russia
        • Poland
        • Rest of Europe
      • By Source
      • By Function
      • By Product Type
      • By Channel
      • By Claim
      • By End User
    • Market Attractiveness Analysis
      • By Country
      • By Source
      • By Function
      • By Product Type
      • By Channel
      • By Claim
      • By End User
    • Key Takeaways
  15. East Asia Market Analysis 2020 to 2024 and Forecast 2025 to 2035, By Country
    • Historical Market Size Value (USD Million) & Volume (Units) Trend Analysis By Market Taxonomy, 2020 to 2024
    • Market Size Value (USD Million) & Volume (Units) Forecast By Market Taxonomy, 2025 to 2035
      • By Country
        • China
        • Japan
        • South Korea
      • By Source
      • By Function
      • By Product Type
      • By Channel
      • By Claim
      • By End User
    • Market Attractiveness Analysis
      • By Country
      • By Source
      • By Function
      • By Product Type
      • By Channel
      • By Claim
      • By End User
    • Key Takeaways
  16. South Asia & Pacific Market Analysis 2020 to 2024 and Forecast 2025 to 2035, By Country
    • Historical Market Size Value (USD Million) & Volume (Units) Trend Analysis By Market Taxonomy, 2020 to 2024
    • Market Size Value (USD Million) & Volume (Units) Forecast By Market Taxonomy, 2025 to 2035
      • By Country
        • India
        • Thailand
        • Malaysia
        • Indonesia
        • Singapore
        • Vietnam
        • Australia
        • New Zealand
        • Rest of South Asia
      • By Source
      • By Function
      • By Product Type
      • By Channel
      • By Claim
      • By End User
    • Market Attractiveness Analysis
      • By Country
      • By Source
      • By Function
      • By Product Type
      • By Channel
      • By Claim
      • By End User
    • Key Takeaways
  17. Middle East and Africa Market Analysis 2020 to 2024 and Forecast 2025 to 2035, By Country
    • Historical Market Size Value (USD Million) & Volume (Units) Trend Analysis By Market Taxonomy, 2020 to 2024
    • Market Size Value (USD Million) & Volume (Units) Forecast By Market Taxonomy, 2025 to 2035
      • By Country
        • Turkey
        • UAE
        • Saudi Arabia
        • Israel
        • Other GCC Countries
        • North Africa
        • South Africa
      • By Source
      • By Function
      • By Product Type
      • By Channel
      • By Claim
      • By End User
    • Market Attractiveness Analysis
      • By Country
      • By Source
      • By Function
      • By Product Type
      • By Channel
      • By Claim
      • By End User
    • Key Takeaways
  18. Key Countries Market Analysis
    • USA
      • Pricing Analysis
      • Market Share Analysis, 2024
        • By Source
        • By Function
        • By Product Type
        • By Channel
        • By Claim
        • By End User
    • Canada
      • Pricing Analysis
      • Market Share Analysis, 2024
        • By Source
        • By Function
        • By Product Type
        • By Channel
        • By Claim
        • By End User
    • Brazil
      • Pricing Analysis
      • Market Share Analysis, 2024
        • By Source
        • By Function
        • By Product Type
        • By Channel
        • By Claim
        • By End User
    • Mexico
      • Pricing Analysis
      • Market Share Analysis, 2024
        • By Source
        • By Function
        • By Product Type
        • By Channel
        • By Claim
        • By End User
    • Colombia
      • Pricing Analysis
      • Market Share Analysis, 2024
        • By Source
        • By Function
        • By Product Type
        • By Channel
        • By Claim
        • By End User
    • Germany
      • Pricing Analysis
      • Market Share Analysis, 2024
        • By Source
        • By Function
        • By Product Type
        • By Channel
        • By Claim
        • By End User
    • UK
      • Pricing Analysis
      • Market Share Analysis, 2024
        • By Source
        • By Function
        • By Product Type
        • By Channel
        • By Claim
        • By End User
    • France
      • Pricing Analysis
      • Market Share Analysis, 2024
        • By Source
        • By Function
        • By Product Type
        • By Channel
        • By Claim
        • By End User
    • Italy
      • Pricing Analysis
      • Market Share Analysis, 2024
        • By Source
        • By Function
        • By Product Type
        • By Channel
        • By Claim
        • By End User
    • Spain
      • Pricing Analysis
      • Market Share Analysis, 2024
        • By Source
        • By Function
        • By Product Type
        • By Channel
        • By Claim
        • By End User
    • Belgium
      • Pricing Analysis
      • Market Share Analysis, 2024
        • By Source
        • By Function
        • By Product Type
        • By Channel
        • By Claim
        • By End User
    • Netherlands
      • Pricing Analysis
      • Market Share Analysis, 2024
        • By Source
        • By Function
        • By Product Type
        • By Channel
        • By Claim
        • By End User
    • Nordic
      • Pricing Analysis
      • Market Share Analysis, 2024
        • By Source
        • By Function
        • By Product Type
        • By Channel
        • By Claim
        • By End User
    • Switzerland
      • Pricing Analysis
      • Market Share Analysis, 2024
        • By Source
        • By Function
        • By Product Type
        • By Channel
        • By Claim
        • By End User
    • Russia
      • Pricing Analysis
      • Market Share Analysis, 2024
        • By Source
        • By Function
        • By Product Type
        • By Channel
        • By Claim
        • By End User
    • Poland
      • Pricing Analysis
      • Market Share Analysis, 2024
        • By Source
        • By Function
        • By Product Type
        • By Channel
        • By Claim
        • By End User
    • China
      • Pricing Analysis
      • Market Share Analysis, 2024
        • By Source
        • By Function
        • By Product Type
        • By Channel
        • By Claim
        • By End User
    • Japan
      • Pricing Analysis
      • Market Share Analysis, 2024
        • By Source
        • By Function
        • By Product Type
        • By Channel
        • By Claim
        • By End User
    • South Korea
      • Pricing Analysis
      • Market Share Analysis, 2024
        • By Source
        • By Function
        • By Product Type
        • By Channel
        • By Claim
        • By End User
    • India
      • Pricing Analysis
      • Market Share Analysis, 2024
        • By Source
        • By Function
        • By Product Type
        • By Channel
        • By Claim
        • By End User
    • Thailand
      • Pricing Analysis
      • Market Share Analysis, 2024
        • By Source
        • By Function
        • By Product Type
        • By Channel
        • By Claim
        • By End User
    • Indonesia
      • Pricing Analysis
      • Market Share Analysis, 2024
        • By Source
        • By Function
        • By Product Type
        • By Channel
        • By Claim
        • By End User
    • Australia
      • Pricing Analysis
      • Market Share Analysis, 2024
        • By Source
        • By Function
        • By Product Type
        • By Channel
        • By Claim
        • By End User
    • New Zealand
      • Pricing Analysis
      • Market Share Analysis, 2024
        • By Source
        • By Function
        • By Product Type
        • By Channel
        • By Claim
        • By End User
    • Turkey
      • Pricing Analysis
      • Market Share Analysis, 2024
        • By Source
        • By Function
        • By Product Type
        • By Channel
        • By Claim
        • By End User
    • UAE
      • Pricing Analysis
      • Market Share Analysis, 2024
        • By Source
        • By Function
        • By Product Type
        • By Channel
        • By Claim
        • By End User
    • Saudi Arabia
      • Pricing Analysis
      • Market Share Analysis, 2024
        • By Source
        • By Function
        • By Product Type
        • By Channel
        • By Claim
        • By End User
    • Israel
      • Pricing Analysis
      • Market Share Analysis, 2024
        • By Source
        • By Function
        • By Product Type
        • By Channel
        • By Claim
        • By End User
    • North Africa
      • Pricing Analysis
      • Market Share Analysis, 2024
        • By Source
        • By Function
        • By Product Type
        • By Channel
        • By Claim
        • By End User
    • South Africa
      • Pricing Analysis
      • Market Share Analysis, 2024
        • By Source
        • By Function
        • By Product Type
        • By Channel
        • By Claim
        • By End User
  19. Market Structure Analysis
    • Competition Dashboard
    • Competition Benchmarking
    • Market Share Analysis of Top Players
      • By Regional
      • By Source
      • By Function
      • By Product Type
      • By Channel
      • By Claim
      • By End User
  20. Competition Analysis
    • Competition Deep Dive
      • Contipro
        • Overview
        • Product Portfolio
        • Profitability by Market Segments (Product/Age /Sales Channel/Region)
        • Sales Footprint
        • Strategy Overview
          • Marketing Strategy
          • Product Strategy
          • Channel Strategy
      • Kewpie
        • Overview
        • Product Portfolio
        • Profitability by Market Segments (Product/Age /Sales Channel/Region)
        • Sales Footprint
        • Strategy Overview
          • Marketing Strategy
          • Product Strategy
          • Channel Strategy
      • Evonik
        • Overview
        • Product Portfolio
        • Profitability by Market Segments (Product/Age /Sales Channel/Region)
        • Sales Footprint
        • Strategy Overview
          • Marketing Strategy
          • Product Strategy
          • Channel Strategy
      • Givaudan
        • Overview
        • Product Portfolio
        • Profitability by Market Segments (Product/Age /Sales Channel/Region)
        • Sales Footprint
        • Strategy Overview
          • Marketing Strategy
          • Product Strategy
          • Channel Strategy
      • DSM-Firmenich
        • Overview
        • Product Portfolio
        • Profitability by Market Segments (Product/Age /Sales Channel/Region)
        • Sales Footprint
        • Strategy Overview
          • Marketing Strategy
          • Product Strategy
          • Channel Strategy
      • Bloomage Biotech
        • Overview
        • Product Portfolio
        • Profitability by Market Segments (Product/Age /Sales Channel/Region)
        • Sales Footprint
        • Strategy Overview
          • Marketing Strategy
          • Product Strategy
          • Channel Strategy
      • Ashland
        • Overview
        • Product Portfolio
        • Profitability by Market Segments (Product/Age /Sales Channel/Region)
        • Sales Footprint
        • Strategy Overview
          • Marketing Strategy
          • Product Strategy
          • Channel Strategy
      • Lubrizol
        • Overview
        • Product Portfolio
        • Profitability by Market Segments (Product/Age /Sales Channel/Region)
        • Sales Footprint
        • Strategy Overview
          • Marketing Strategy
          • Product Strategy
          • Channel Strategy
      • Roquette
        • Overview
        • Product Portfolio
        • Profitability by Market Segments (Product/Age /Sales Channel/Region)
        • Sales Footprint
        • Strategy Overview
          • Marketing Strategy
          • Product Strategy
          • Channel Strategy
      • Croda
        • Overview
        • Product Portfolio
        • Profitability by Market Segments (Product/Age /Sales Channel/Region)
        • Sales Footprint
        • Strategy Overview
          • Marketing Strategy
          • Product Strategy
          • Channel Strategy
      • Others
        • Overview
        • Product Portfolio
        • Profitability by Market Segments (Product/Age /Sales Channel/Region)
        • Sales Footprint
        • Strategy Overview
          • Marketing Strategy
          • Product Strategy
          • Channel Strategy
  21. Assumptions & Acronyms Used
  22. Research Methodology

List of Tables

  • Table 1: Global Market Value (USD Million) Forecast by Region, 2020-2035
  • Table 2: Global Market Volume (Units) Forecast by Region, 2020-2035
  • Table 3: Global Market Value (USD Million) Forecast by Source, 2020-2035
  • Table 4: Global Market Volume (Units) Forecast by Source, 2020-2035
  • Table 5: Global Market Value (USD Million) Forecast by Function, 2020-2035
  • Table 6: Global Market Volume (Units) Forecast by Function, 2020-2035
  • Table 7: Global Market Value (USD Million) Forecast by Product Type, 2020-2035
  • Table 8: Global Market Volume (Units) Forecast by Product Type, 2020-2035
  • Table 9: Global Market Value (USD Million) Forecast by Channel, 2020-2035
  • Table 10: Global Market Volume (Units) Forecast by Channel, 2020-2035
  • Table 11: Global Market Value (USD Million) Forecast by Claim, 2020-2035
  • Table 12: Global Market Volume (Units) Forecast by Claim, 2020-2035
  • Table 13: Global Market Value (USD Million) Forecast by End User, 2020-2035
  • Table 14: Global Market Volume (Units) Forecast by End User, 2020-2035
  • Table 15: North America Market Value (USD Million) Forecast by Country, 2020-2035
  • Table 16: North America Market Volume (Units) Forecast by Country, 2020-2035
  • Table 17: North America Market Value (USD Million) Forecast by Source, 2020-2035
  • Table 18: North America Market Volume (Units) Forecast by Source, 2020-2035
  • Table 19: North America Market Value (USD Million) Forecast by Function, 2020-2035
  • Table 20: North America Market Volume (Units) Forecast by Function, 2020-2035
  • Table 21: North America Market Value (USD Million) Forecast by Product Type, 2020-2035
  • Table 22: North America Market Volume (Units) Forecast by Product Type, 2020-2035
  • Table 23: North America Market Value (USD Million) Forecast by Channel, 2020-2035
  • Table 24: North America Market Volume (Units) Forecast by Channel, 2020-2035
  • Table 25: North America Market Value (USD Million) Forecast by Claim, 2020-2035
  • Table 26: North America Market Volume (Units) Forecast by Claim, 2020-2035
  • Table 27: North America Market Value (USD Million) Forecast by End User, 2020-2035
  • Table 28: North America Market Volume (Units) Forecast by End User, 2020-2035
  • Table 29: Latin America Market Value (USD Million) Forecast by Country, 2020-2035
  • Table 30: Latin America Market Volume (Units) Forecast by Country, 2020-2035
  • Table 31: Latin America Market Value (USD Million) Forecast by Source, 2020-2035
  • Table 32: Latin America Market Volume (Units) Forecast by Source, 2020-2035
  • Table 33: Latin America Market Value (USD Million) Forecast by Function, 2020-2035
  • Table 34: Latin America Market Volume (Units) Forecast by Function, 2020-2035
  • Table 35: Latin America Market Value (USD Million) Forecast by Product Type, 2020-2035
  • Table 36: Latin America Market Volume (Units) Forecast by Product Type, 2020-2035
  • Table 37: Latin America Market Value (USD Million) Forecast by Channel, 2020-2035
  • Table 38: Latin America Market Volume (Units) Forecast by Channel, 2020-2035
  • Table 39: Latin America Market Value (USD Million) Forecast by Claim, 2020-2035
  • Table 40: Latin America Market Volume (Units) Forecast by Claim, 2020-2035
  • Table 41: Latin America Market Value (USD Million) Forecast by End User, 2020-2035
  • Table 42: Latin America Market Volume (Units) Forecast by End User, 2020-2035
  • Table 43: Europe Market Value (USD Million) Forecast by Country, 2020-2035
  • Table 44: Europe Market Volume (Units) Forecast by Country, 2020-2035
  • Table 45: Europe Market Value (USD Million) Forecast by Source, 2020-2035
  • Table 46: Europe Market Volume (Units) Forecast by Source, 2020-2035
  • Table 47: Europe Market Value (USD Million) Forecast by Function, 2020-2035
  • Table 48: Europe Market Volume (Units) Forecast by Function, 2020-2035
  • Table 49: Europe Market Value (USD Million) Forecast by Product Type, 2020-2035
  • Table 50: Europe Market Volume (Units) Forecast by Product Type, 2020-2035
  • Table 51: Europe Market Value (USD Million) Forecast by Channel, 2020-2035
  • Table 52: Europe Market Volume (Units) Forecast by Channel, 2020-2035
  • Table 53: Europe Market Value (USD Million) Forecast by Claim, 2020-2035
  • Table 54: Europe Market Volume (Units) Forecast by Claim, 2020-2035
  • Table 55: Europe Market Value (USD Million) Forecast by End User, 2020-2035
  • Table 56: Europe Market Volume (Units) Forecast by End User, 2020-2035
  • Table 57: East Asia Market Value (USD Million) Forecast by Country, 2020-2035
  • Table 58: East Asia Market Volume (Units) Forecast by Country, 2020-2035
  • Table 59: East Asia Market Value (USD Million) Forecast by Source, 2020-2035
  • Table 60: East Asia Market Volume (Units) Forecast by Source, 2020-2035
  • Table 61: East Asia Market Value (USD Million) Forecast by Function, 2020-2035
  • Table 62: East Asia Market Volume (Units) Forecast by Function, 2020-2035
  • Table 63: East Asia Market Value (USD Million) Forecast by Product Type, 2020-2035
  • Table 64: East Asia Market Volume (Units) Forecast by Product Type, 2020-2035
  • Table 65: East Asia Market Value (USD Million) Forecast by Channel, 2020-2035
  • Table 66: East Asia Market Volume (Units) Forecast by Channel, 2020-2035
  • Table 67: East Asia Market Value (USD Million) Forecast by Claim, 2020-2035
  • Table 68: East Asia Market Volume (Units) Forecast by Claim, 2020-2035
  • Table 69: East Asia Market Value (USD Million) Forecast by End User, 2020-2035
  • Table 70: East Asia Market Volume (Units) Forecast by End User, 2020-2035
  • Table 71: South Asia & Pacific Market Value (USD Million) Forecast by Country, 2020-2035
  • Table 72: South Asia & Pacific Market Volume (Units) Forecast by Country, 2020-2035
  • Table 73: South Asia & Pacific Market Value (USD Million) Forecast by Source, 2020-2035
  • Table 74: South Asia & Pacific Market Volume (Units) Forecast by Source, 2020-2035
  • Table 75: South Asia & Pacific Market Value (USD Million) Forecast by Function, 2020-2035
  • Table 76: South Asia & Pacific Market Volume (Units) Forecast by Function, 2020-2035
  • Table 77: South Asia & Pacific Market Value (USD Million) Forecast by Product Type, 2020-2035
  • Table 78: South Asia & Pacific Market Volume (Units) Forecast by Product Type, 2020-2035
  • Table 79: South Asia & Pacific Market Value (USD Million) Forecast by Channel, 2020-2035
  • Table 80: South Asia & Pacific Market Volume (Units) Forecast by Channel, 2020-2035
  • Table 81: South Asia & Pacific Market Value (USD Million) Forecast by Claim, 2020-2035
  • Table 82: South Asia & Pacific Market Volume (Units) Forecast by Claim, 2020-2035
  • Table 83: South Asia & Pacific Market Value (USD Million) Forecast by End User, 2020-2035
  • Table 84: South Asia & Pacific Market Volume (Units) Forecast by End User, 2020-2035
  • Table 85: Middle East and Africa Market Value (USD Million) Forecast by Country, 2020-2035
  • Table 86: Middle East and Africa Market Volume (Units) Forecast by Country, 2020-2035
  • Table 87: Middle East and Africa Market Value (USD Million) Forecast by Source, 2020-2035
  • Table 88: Middle East and Africa Market Volume (Units) Forecast by Source, 2020-2035
  • Table 89: Middle East and Africa Market Value (USD Million) Forecast by Function, 2020-2035
  • Table 90: Middle East and Africa Market Volume (Units) Forecast by Function, 2020-2035
  • Table 91: Middle East and Africa Market Value (USD Million) Forecast by Product Type, 2020-2035
  • Table 92: Middle East and Africa Market Volume (Units) Forecast by Product Type, 2020-2035
  • Table 93: Middle East and Africa Market Value (USD Million) Forecast by Channel, 2020-2035
  • Table 94: Middle East and Africa Market Volume (Units) Forecast by Channel, 2020-2035
  • Table 95: Middle East and Africa Market Value (USD Million) Forecast by Claim, 2020-2035
  • Table 96: Middle East and Africa Market Volume (Units) Forecast by Claim, 2020-2035
  • Table 97: Middle East and Africa Market Value (USD Million) Forecast by End User, 2020-2035
  • Table 98: Middle East and Africa Market Volume (Units) Forecast by End User, 2020-2035

List of Figures

  • Figure 1: Global Market Value (USD Million) by Source, 2025-2035
  • Figure 2: Global Market Value (USD Million) by Function, 2025-2035
  • Figure 3: Global Market Value (USD Million) by Product Type, 2025-2035
  • Figure 4: Global Market Value (USD Million) by Channel, 2025-2035
  • Figure 5: Global Market Value (USD Million) by Claim, 2025-2035
  • Figure 6: Global Market Value (USD Million) by End User, 2025-2035
  • Figure 7: Global Market Value (USD Million) by Region, 2025-2035
  • Figure 8: Global Market Value (USD Million) Analysis by Region, 2020-2035
  • Figure 9: Global Market Volume (Units) Analysis by Region, 2020-2035
  • Figure 10: Global Market Value Share (%) and BPS Analysis by Region, 2025-2035
  • Figure 11: Global Market Y-o-Y Growth (%) Projections by Region, 2025-2035
  • Figure 12: Global Market Value (USD Million) Analysis by Source, 2020-2035
  • Figure 13: Global Market Volume (Units) Analysis by Source, 2020-2035
  • Figure 14: Global Market Value Share (%) and BPS Analysis by Source, 2025-2035
  • Figure 15: Global Market Y-o-Y Growth (%) Projections by Source, 2025-2035
  • Figure 16: Global Market Value (USD Million) Analysis by Function, 2020-2035
  • Figure 17: Global Market Volume (Units) Analysis by Function, 2020-2035
  • Figure 18: Global Market Value Share (%) and BPS Analysis by Function, 2025-2035
  • Figure 19: Global Market Y-o-Y Growth (%) Projections by Function, 2025-2035
  • Figure 20: Global Market Value (USD Million) Analysis by Product Type, 2020-2035
  • Figure 21: Global Market Volume (Units) Analysis by Product Type, 2020-2035
  • Figure 22: Global Market Value Share (%) and BPS Analysis by Product Type, 2025-2035
  • Figure 23: Global Market Y-o-Y Growth (%) Projections by Product Type, 2025-2035
  • Figure 24: Global Market Value (USD Million) Analysis by Channel, 2020-2035
  • Figure 25: Global Market Volume (Units) Analysis by Channel, 2020-2035
  • Figure 26: Global Market Value Share (%) and BPS Analysis by Channel, 2025-2035
  • Figure 27: Global Market Y-o-Y Growth (%) Projections by Channel, 2025-2035
  • Figure 28: Global Market Value (USD Million) Analysis by Claim, 2020-2035
  • Figure 29: Global Market Volume (Units) Analysis by Claim, 2020-2035
  • Figure 30: Global Market Value Share (%) and BPS Analysis by Claim, 2025-2035
  • Figure 31: Global Market Y-o-Y Growth (%) Projections by Claim, 2025-2035
  • Figure 32: Global Market Value (USD Million) Analysis by End User, 2020-2035
  • Figure 33: Global Market Volume (Units) Analysis by End User, 2020-2035
  • Figure 34: Global Market Value Share (%) and BPS Analysis by End User, 2025-2035
  • Figure 35: Global Market Y-o-Y Growth (%) Projections by End User, 2025-2035
  • Figure 36: Global Market Attractiveness by Source, 2025-2035
  • Figure 37: Global Market Attractiveness by Function, 2025-2035
  • Figure 38: Global Market Attractiveness by Product Type, 2025-2035
  • Figure 39: Global Market Attractiveness by Channel, 2025-2035
  • Figure 40: Global Market Attractiveness by Claim, 2025-2035
  • Figure 41: Global Market Attractiveness by End User, 2025-2035
  • Figure 42: Global Market Attractiveness by Region, 2025-2035
  • Figure 43: North America Market Value (USD Million) by Source, 2025-2035
  • Figure 44: North America Market Value (USD Million) by Function, 2025-2035
  • Figure 45: North America Market Value (USD Million) by Product Type, 2025-2035
  • Figure 46: North America Market Value (USD Million) by Channel, 2025-2035
  • Figure 47: North America Market Value (USD Million) by Claim, 2025-2035
  • Figure 48: North America Market Value (USD Million) by End User, 2025-2035
  • Figure 49: North America Market Value (USD Million) by Country, 2025-2035
  • Figure 50: North America Market Value (USD Million) Analysis by Country, 2020-2035
  • Figure 51: North America Market Volume (Units) Analysis by Country, 2020-2035
  • Figure 52: North America Market Value Share (%) and BPS Analysis by Country, 2025-2035
  • Figure 53: North America Market Y-o-Y Growth (%) Projections by Country, 2025-2035
  • Figure 54: North America Market Value (USD Million) Analysis by Source, 2020-2035
  • Figure 55: North America Market Volume (Units) Analysis by Source, 2020-2035
  • Figure 56: North America Market Value Share (%) and BPS Analysis by Source, 2025-2035
  • Figure 57: North America Market Y-o-Y Growth (%) Projections by Source, 2025-2035
  • Figure 58: North America Market Value (USD Million) Analysis by Function, 2020-2035
  • Figure 59: North America Market Volume (Units) Analysis by Function, 2020-2035
  • Figure 60: North America Market Value Share (%) and BPS Analysis by Function, 2025-2035
  • Figure 61: North America Market Y-o-Y Growth (%) Projections by Function, 2025-2035
  • Figure 62: North America Market Value (USD Million) Analysis by Product Type, 2020-2035
  • Figure 63: North America Market Volume (Units) Analysis by Product Type, 2020-2035
  • Figure 64: North America Market Value Share (%) and BPS Analysis by Product Type, 2025-2035
  • Figure 65: North America Market Y-o-Y Growth (%) Projections by Product Type, 2025-2035
  • Figure 66: North America Market Value (USD Million) Analysis by Channel, 2020-2035
  • Figure 67: North America Market Volume (Units) Analysis by Channel, 2020-2035
  • Figure 68: North America Market Value Share (%) and BPS Analysis by Channel, 2025-2035
  • Figure 69: North America Market Y-o-Y Growth (%) Projections by Channel, 2025-2035
  • Figure 70: North America Market Value (USD Million) Analysis by Claim, 2020-2035
  • Figure 71: North America Market Volume (Units) Analysis by Claim, 2020-2035
  • Figure 72: North America Market Value Share (%) and BPS Analysis by Claim, 2025-2035
  • Figure 73: North America Market Y-o-Y Growth (%) Projections by Claim, 2025-2035
  • Figure 74: North America Market Value (USD Million) Analysis by End User, 2020-2035
  • Figure 75: North America Market Volume (Units) Analysis by End User, 2020-2035
  • Figure 76: North America Market Value Share (%) and BPS Analysis by End User, 2025-2035
  • Figure 77: North America Market Y-o-Y Growth (%) Projections by End User, 2025-2035
  • Figure 78: North America Market Attractiveness by Source, 2025-2035
  • Figure 79: North America Market Attractiveness by Function, 2025-2035
  • Figure 80: North America Market Attractiveness by Product Type, 2025-2035
  • Figure 81: North America Market Attractiveness by Channel, 2025-2035
  • Figure 82: North America Market Attractiveness by Claim, 2025-2035
  • Figure 83: North America Market Attractiveness by End User, 2025-2035
  • Figure 84: North America Market Attractiveness by Country, 2025-2035
  • Figure 85: Latin America Market Value (USD Million) by Source, 2025-2035
  • Figure 86: Latin America Market Value (USD Million) by Function, 2025-2035
  • Figure 87: Latin America Market Value (USD Million) by Product Type, 2025-2035
  • Figure 88: Latin America Market Value (USD Million) by Channel, 2025-2035
  • Figure 89: Latin America Market Value (USD Million) by Claim, 2025-2035
  • Figure 90: Latin America Market Value (USD Million) by End User, 2025-2035
  • Figure 91: Latin America Market Value (USD Million) by Country, 2025-2035
  • Figure 92: Latin America Market Value (USD Million) Analysis by Country, 2020-2035
  • Figure 93: Latin America Market Volume (Units) Analysis by Country, 2020-2035
  • Figure 94: Latin America Market Value Share (%) and BPS Analysis by Country, 2025-2035
  • Figure 95: Latin America Market Y-o-Y Growth (%) Projections by Country, 2025-2035
  • Figure 96: Latin America Market Value (USD Million) Analysis by Source, 2020-2035
  • Figure 97: Latin America Market Volume (Units) Analysis by Source, 2020-2035
  • Figure 98: Latin America Market Value Share (%) and BPS Analysis by Source, 2025-2035
  • Figure 99: Latin America Market Y-o-Y Growth (%) Projections by Source, 2025-2035
  • Figure 100: Latin America Market Value (USD Million) Analysis by Function, 2020-2035
  • Figure 101: Latin America Market Volume (Units) Analysis by Function, 2020-2035
  • Figure 102: Latin America Market Value Share (%) and BPS Analysis by Function, 2025-2035
  • Figure 103: Latin America Market Y-o-Y Growth (%) Projections by Function, 2025-2035
  • Figure 104: Latin America Market Value (USD Million) Analysis by Product Type, 2020-2035
  • Figure 105: Latin America Market Volume (Units) Analysis by Product Type, 2020-2035
  • Figure 106: Latin America Market Value Share (%) and BPS Analysis by Product Type, 2025-2035
  • Figure 107: Latin America Market Y-o-Y Growth (%) Projections by Product Type, 2025-2035
  • Figure 108: Latin America Market Value (USD Million) Analysis by Channel, 2020-2035
  • Figure 109: Latin America Market Volume (Units) Analysis by Channel, 2020-2035
  • Figure 110: Latin America Market Value Share (%) and BPS Analysis by Channel, 2025-2035
  • Figure 111: Latin America Market Y-o-Y Growth (%) Projections by Channel, 2025-2035
  • Figure 112: Latin America Market Value (USD Million) Analysis by Claim, 2020-2035
  • Figure 113: Latin America Market Volume (Units) Analysis by Claim, 2020-2035
  • Figure 114: Latin America Market Value Share (%) and BPS Analysis by Claim, 2025-2035
  • Figure 115: Latin America Market Y-o-Y Growth (%) Projections by Claim, 2025-2035
  • Figure 116: Latin America Market Value (USD Million) Analysis by End User, 2020-2035
  • Figure 117: Latin America Market Volume (Units) Analysis by End User, 2020-2035
  • Figure 118: Latin America Market Value Share (%) and BPS Analysis by End User, 2025-2035
  • Figure 119: Latin America Market Y-o-Y Growth (%) Projections by End User, 2025-2035
  • Figure 120: Latin America Market Attractiveness by Source, 2025-2035
  • Figure 121: Latin America Market Attractiveness by Function, 2025-2035
  • Figure 122: Latin America Market Attractiveness by Product Type, 2025-2035
  • Figure 123: Latin America Market Attractiveness by Channel, 2025-2035
  • Figure 124: Latin America Market Attractiveness by Claim, 2025-2035
  • Figure 125: Latin America Market Attractiveness by End User, 2025-2035
  • Figure 126: Latin America Market Attractiveness by Country, 2025-2035
  • Figure 127: Europe Market Value (USD Million) by Source, 2025-2035
  • Figure 128: Europe Market Value (USD Million) by Function, 2025-2035
  • Figure 129: Europe Market Value (USD Million) by Product Type, 2025-2035
  • Figure 130: Europe Market Value (USD Million) by Channel, 2025-2035
  • Figure 131: Europe Market Value (USD Million) by Claim, 2025-2035
  • Figure 132: Europe Market Value (USD Million) by End User, 2025-2035
  • Figure 133: Europe Market Value (USD Million) by Country, 2025-2035
  • Figure 134: Europe Market Value (USD Million) Analysis by Country, 2020-2035
  • Figure 135: Europe Market Volume (Units) Analysis by Country, 2020-2035
  • Figure 136: Europe Market Value Share (%) and BPS Analysis by Country, 2025-2035
  • Figure 137: Europe Market Y-o-Y Growth (%) Projections by Country, 2025-2035
  • Figure 138: Europe Market Value (USD Million) Analysis by Source, 2020-2035
  • Figure 139: Europe Market Volume (Units) Analysis by Source, 2020-2035
  • Figure 140: Europe Market Value Share (%) and BPS Analysis by Source, 2025-2035
  • Figure 141: Europe Market Y-o-Y Growth (%) Projections by Source, 2025-2035
  • Figure 142: Europe Market Value (USD Million) Analysis by Function, 2020-2035
  • Figure 143: Europe Market Volume (Units) Analysis by Function, 2020-2035
  • Figure 144: Europe Market Value Share (%) and BPS Analysis by Function, 2025-2035
  • Figure 145: Europe Market Y-o-Y Growth (%) Projections by Function, 2025-2035
  • Figure 146: Europe Market Value (USD Million) Analysis by Product Type, 2020-2035
  • Figure 147: Europe Market Volume (Units) Analysis by Product Type, 2020-2035
  • Figure 148: Europe Market Value Share (%) and BPS Analysis by Product Type, 2025-2035
  • Figure 149: Europe Market Y-o-Y Growth (%) Projections by Product Type, 2025-2035
  • Figure 150: Europe Market Value (USD Million) Analysis by Channel, 2020-2035
  • Figure 151: Europe Market Volume (Units) Analysis by Channel, 2020-2035
  • Figure 152: Europe Market Value Share (%) and BPS Analysis by Channel, 2025-2035
  • Figure 153: Europe Market Y-o-Y Growth (%) Projections by Channel, 2025-2035
  • Figure 154: Europe Market Value (USD Million) Analysis by Claim, 2020-2035
  • Figure 155: Europe Market Volume (Units) Analysis by Claim, 2020-2035
  • Figure 156: Europe Market Value Share (%) and BPS Analysis by Claim, 2025-2035
  • Figure 157: Europe Market Y-o-Y Growth (%) Projections by Claim, 2025-2035
  • Figure 158: Europe Market Value (USD Million) Analysis by End User, 2020-2035
  • Figure 159: Europe Market Volume (Units) Analysis by End User, 2020-2035
  • Figure 160: Europe Market Value Share (%) and BPS Analysis by End User, 2025-2035
  • Figure 161: Europe Market Y-o-Y Growth (%) Projections by End User, 2025-2035
  • Figure 162: Europe Market Attractiveness by Source, 2025-2035
  • Figure 163: Europe Market Attractiveness by Function, 2025-2035
  • Figure 164: Europe Market Attractiveness by Product Type, 2025-2035
  • Figure 165: Europe Market Attractiveness by Channel, 2025-2035
  • Figure 166: Europe Market Attractiveness by Claim, 2025-2035
  • Figure 167: Europe Market Attractiveness by End User, 2025-2035
  • Figure 168: Europe Market Attractiveness by Country, 2025-2035
  • Figure 169: East Asia Market Value (USD Million) by Source, 2025-2035
  • Figure 170: East Asia Market Value (USD Million) by Function, 2025-2035
  • Figure 171: East Asia Market Value (USD Million) by Product Type, 2025-2035
  • Figure 172: East Asia Market Value (USD Million) by Channel, 2025-2035
  • Figure 173: East Asia Market Value (USD Million) by Claim, 2025-2035
  • Figure 174: East Asia Market Value (USD Million) by End User, 2025-2035
  • Figure 175: East Asia Market Value (USD Million) by Country, 2025-2035
  • Figure 176: East Asia Market Value (USD Million) Analysis by Country, 2020-2035
  • Figure 177: East Asia Market Volume (Units) Analysis by Country, 2020-2035
  • Figure 178: East Asia Market Value Share (%) and BPS Analysis by Country, 2025-2035
  • Figure 179: East Asia Market Y-o-Y Growth (%) Projections by Country, 2025-2035
  • Figure 180: East Asia Market Value (USD Million) Analysis by Source, 2020-2035
  • Figure 181: East Asia Market Volume (Units) Analysis by Source, 2020-2035
  • Figure 182: East Asia Market Value Share (%) and BPS Analysis by Source, 2025-2035
  • Figure 183: East Asia Market Y-o-Y Growth (%) Projections by Source, 2025-2035
  • Figure 184: East Asia Market Value (USD Million) Analysis by Function, 2020-2035
  • Figure 185: East Asia Market Volume (Units) Analysis by Function, 2020-2035
  • Figure 186: East Asia Market Value Share (%) and BPS Analysis by Function, 2025-2035
  • Figure 187: East Asia Market Y-o-Y Growth (%) Projections by Function, 2025-2035
  • Figure 188: East Asia Market Value (USD Million) Analysis by Product Type, 2020-2035
  • Figure 189: East Asia Market Volume (Units) Analysis by Product Type, 2020-2035
  • Figure 190: East Asia Market Value Share (%) and BPS Analysis by Product Type, 2025-2035
  • Figure 191: East Asia Market Y-o-Y Growth (%) Projections by Product Type, 2025-2035
  • Figure 192: East Asia Market Value (USD Million) Analysis by Channel, 2020-2035
  • Figure 193: East Asia Market Volume (Units) Analysis by Channel, 2020-2035
  • Figure 194: East Asia Market Value Share (%) and BPS Analysis by Channel, 2025-2035
  • Figure 195: East Asia Market Y-o-Y Growth (%) Projections by Channel, 2025-2035
  • Figure 196: East Asia Market Value (USD Million) Analysis by Claim, 2020-2035
  • Figure 197: East Asia Market Volume (Units) Analysis by Claim, 2020-2035
  • Figure 198: East Asia Market Value Share (%) and BPS Analysis by Claim, 2025-2035
  • Figure 199: East Asia Market Y-o-Y Growth (%) Projections by Claim, 2025-2035
  • Figure 200: East Asia Market Value (USD Million) Analysis by End User, 2020-2035
  • Figure 201: East Asia Market Volume (Units) Analysis by End User, 2020-2035
  • Figure 202: East Asia Market Value Share (%) and BPS Analysis by End User, 2025-2035
  • Figure 203: East Asia Market Y-o-Y Growth (%) Projections by End User, 2025-2035
  • Figure 204: East Asia Market Attractiveness by Source, 2025-2035
  • Figure 205: East Asia Market Attractiveness by Function, 2025-2035
  • Figure 206: East Asia Market Attractiveness by Product Type, 2025-2035
  • Figure 207: East Asia Market Attractiveness by Channel, 2025-2035
  • Figure 208: East Asia Market Attractiveness by Claim, 2025-2035
  • Figure 209: East Asia Market Attractiveness by End User, 2025-2035
  • Figure 210: East Asia Market Attractiveness by Country, 2025-2035
  • Figure 211: South Asia & Pacific Market Value (USD Million) by Source, 2025-2035
  • Figure 212: South Asia & Pacific Market Value (USD Million) by Function, 2025-2035
  • Figure 213: South Asia & Pacific Market Value (USD Million) by Product Type, 2025-2035
  • Figure 214: South Asia & Pacific Market Value (USD Million) by Channel, 2025-2035
  • Figure 215: South Asia & Pacific Market Value (USD Million) by Claim, 2025-2035
  • Figure 216: South Asia & Pacific Market Value (USD Million) by End User, 2025-2035
  • Figure 217: South Asia & Pacific Market Value (USD Million) by Country, 2025-2035
  • Figure 218: South Asia & Pacific Market Value (USD Million) Analysis by Country, 2020-2035
  • Figure 219: South Asia & Pacific Market Volume (Units) Analysis by Country, 2020-2035
  • Figure 220: South Asia & Pacific Market Value Share (%) and BPS Analysis by Country, 2025-2035
  • Figure 221: South Asia & Pacific Market Y-o-Y Growth (%) Projections by Country, 2025-2035
  • Figure 222: South Asia & Pacific Market Value (USD Million) Analysis by Source, 2020-2035
  • Figure 223: South Asia & Pacific Market Volume (Units) Analysis by Source, 2020-2035
  • Figure 224: South Asia & Pacific Market Value Share (%) and BPS Analysis by Source, 2025-2035
  • Figure 225: South Asia & Pacific Market Y-o-Y Growth (%) Projections by Source, 2025-2035
  • Figure 226: South Asia & Pacific Market Value (USD Million) Analysis by Function, 2020-2035
  • Figure 227: South Asia & Pacific Market Volume (Units) Analysis by Function, 2020-2035
  • Figure 228: South Asia & Pacific Market Value Share (%) and BPS Analysis by Function, 2025-2035
  • Figure 229: South Asia & Pacific Market Y-o-Y Growth (%) Projections by Function, 2025-2035
  • Figure 230: South Asia & Pacific Market Value (USD Million) Analysis by Product Type, 2020-2035
  • Figure 231: South Asia & Pacific Market Volume (Units) Analysis by Product Type, 2020-2035
  • Figure 232: South Asia & Pacific Market Value Share (%) and BPS Analysis by Product Type, 2025-2035
  • Figure 233: South Asia & Pacific Market Y-o-Y Growth (%) Projections by Product Type, 2025-2035
  • Figure 234: South Asia & Pacific Market Value (USD Million) Analysis by Channel, 2020-2035
  • Figure 235: South Asia & Pacific Market Volume (Units) Analysis by Channel, 2020-2035
  • Figure 236: South Asia & Pacific Market Value Share (%) and BPS Analysis by Channel, 2025-2035
  • Figure 237: South Asia & Pacific Market Y-o-Y Growth (%) Projections by Channel, 2025-2035
  • Figure 238: South Asia & Pacific Market Value (USD Million) Analysis by Claim, 2020-2035
  • Figure 239: South Asia & Pacific Market Volume (Units) Analysis by Claim, 2020-2035
  • Figure 240: South Asia & Pacific Market Value Share (%) and BPS Analysis by Claim, 2025-2035
  • Figure 241: South Asia & Pacific Market Y-o-Y Growth (%) Projections by Claim, 2025-2035
  • Figure 242: South Asia & Pacific Market Value (USD Million) Analysis by End User, 2020-2035
  • Figure 243: South Asia & Pacific Market Volume (Units) Analysis by End User, 2020-2035
  • Figure 244: South Asia & Pacific Market Value Share (%) and BPS Analysis by End User, 2025-2035
  • Figure 245: South Asia & Pacific Market Y-o-Y Growth (%) Projections by End User, 2025-2035
  • Figure 246: South Asia & Pacific Market Attractiveness by Source, 2025-2035
  • Figure 247: South Asia & Pacific Market Attractiveness by Function, 2025-2035
  • Figure 248: South Asia & Pacific Market Attractiveness by Product Type, 2025-2035
  • Figure 249: South Asia & Pacific Market Attractiveness by Channel, 2025-2035
  • Figure 250: South Asia & Pacific Market Attractiveness by Claim, 2025-2035
  • Figure 251: South Asia & Pacific Market Attractiveness by End User, 2025-2035
  • Figure 252: South Asia & Pacific Market Attractiveness by Country, 2025-2035
  • Figure 253: Middle East and Africa Market Value (USD Million) by Source, 2025-2035
  • Figure 254: Middle East and Africa Market Value (USD Million) by Function, 2025-2035
  • Figure 255: Middle East and Africa Market Value (USD Million) by Product Type, 2025-2035
  • Figure 256: Middle East and Africa Market Value (USD Million) by Channel, 2025-2035
  • Figure 257: Middle East and Africa Market Value (USD Million) by Claim, 2025-2035
  • Figure 258: Middle East and Africa Market Value (USD Million) by End User, 2025-2035
  • Figure 259: Middle East and Africa Market Value (USD Million) by Country, 2025-2035
  • Figure 260: Middle East and Africa Market Value (USD Million) Analysis by Country, 2020-2035
  • Figure 261: Middle East and Africa Market Volume (Units) Analysis by Country, 2020-2035
  • Figure 262: Middle East and Africa Market Value Share (%) and BPS Analysis by Country, 2025-2035
  • Figure 263: Middle East and Africa Market Y-o-Y Growth (%) Projections by Country, 2025-2035
  • Figure 264: Middle East and Africa Market Value (USD Million) Analysis by Source, 2020-2035
  • Figure 265: Middle East and Africa Market Volume (Units) Analysis by Source, 2020-2035
  • Figure 266: Middle East and Africa Market Value Share (%) and BPS Analysis by Source, 2025-2035
  • Figure 267: Middle East and Africa Market Y-o-Y Growth (%) Projections by Source, 2025-2035
  • Figure 268: Middle East and Africa Market Value (USD Million) Analysis by Function, 2020-2035
  • Figure 269: Middle East and Africa Market Volume (Units) Analysis by Function, 2020-2035
  • Figure 270: Middle East and Africa Market Value Share (%) and BPS Analysis by Function, 2025-2035
  • Figure 271: Middle East and Africa Market Y-o-Y Growth (%) Projections by Function, 2025-2035
  • Figure 272: Middle East and Africa Market Value (USD Million) Analysis by Product Type, 2020-2035
  • Figure 273: Middle East and Africa Market Volume (Units) Analysis by Product Type, 2020-2035
  • Figure 274: Middle East and Africa Market Value Share (%) and BPS Analysis by Product Type, 2025-2035
  • Figure 275: Middle East and Africa Market Y-o-Y Growth (%) Projections by Product Type, 2025-2035
  • Figure 276: Middle East and Africa Market Value (USD Million) Analysis by Channel, 2020-2035
  • Figure 277: Middle East and Africa Market Volume (Units) Analysis by Channel, 2020-2035
  • Figure 278: Middle East and Africa Market Value Share (%) and BPS Analysis by Channel, 2025-2035
  • Figure 279: Middle East and Africa Market Y-o-Y Growth (%) Projections by Channel, 2025-2035
  • Figure 280: Middle East and Africa Market Value (USD Million) Analysis by Claim, 2020-2035
  • Figure 281: Middle East and Africa Market Volume (Units) Analysis by Claim, 2020-2035
  • Figure 282: Middle East and Africa Market Value Share (%) and BPS Analysis by Claim, 2025-2035
  • Figure 283: Middle East and Africa Market Y-o-Y Growth (%) Projections by Claim, 2025-2035
  • Figure 284: Middle East and Africa Market Value (USD Million) Analysis by End User, 2020-2035
  • Figure 285: Middle East and Africa Market Volume (Units) Analysis by End User, 2020-2035
  • Figure 286: Middle East and Africa Market Value Share (%) and BPS Analysis by End User, 2025-2035
  • Figure 287: Middle East and Africa Market Y-o-Y Growth (%) Projections by End User, 2025-2035
  • Figure 288: Middle East and Africa Market Attractiveness by Source, 2025-2035
  • Figure 289: Middle East and Africa Market Attractiveness by Function, 2025-2035
  • Figure 290: Middle East and Africa Market Attractiveness by Product Type, 2025-2035
  • Figure 291: Middle East and Africa Market Attractiveness by Channel, 2025-2035
  • Figure 292: Middle East and Africa Market Attractiveness by Claim, 2025-2035
  • Figure 293: Middle East and Africa Market Attractiveness by End User, 2025-2035
  • Figure 294: Middle East and Africa Market Attractiveness by Country, 2025-2035

Explore Similar Insights

Future Market Insights

Vegan Hyaluronic Acid Market

Chat With

MaRIA

Hi There, I am MaRIA, Your Market Research Intelligence Assistant. How may I help you?