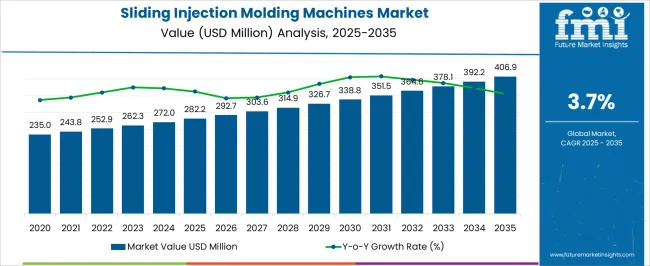
The Sliding Injection Molding Machines Market is estimated to be valued at USD 282.2 million in 2025 and is projected to reach USD 406.9 million by 2035, registering a compound annual growth rate (CAGR) of 3.7% over the forecast period.

| Metric | Value |
|---|---|
| Sliding Injection Molding Machines Market Estimated Value in (2025 E) | USD 282.2 million |
| Sliding Injection Molding Machines Market Forecast Value in (2035 F) | USD 406.9 million |
| Forecast CAGR (2025 to 2035) | 3.7% |
The sliding injection molding machines market is experiencing notable momentum supported by the rising demand for precision manufacturing, high productivity, and flexible production systems across diverse industries. The growing emphasis on cost efficiency and consistency in molded components is driving manufacturers to adopt machines with advanced automation and process optimization features.
Integration of digital monitoring, robotics, and energy efficient systems has further enhanced the appeal of sliding injection molding machines. Expanding applications in automotive, consumer goods, packaging, and electronics are reinforcing their adoption.
Regulatory focus on sustainability and energy efficiency is also influencing purchasing decisions, as companies seek machines that align with reduced waste generation and lower operational costs. The market outlook remains optimistic as technological innovations and greater penetration in developing economies continue to strengthen growth opportunities.

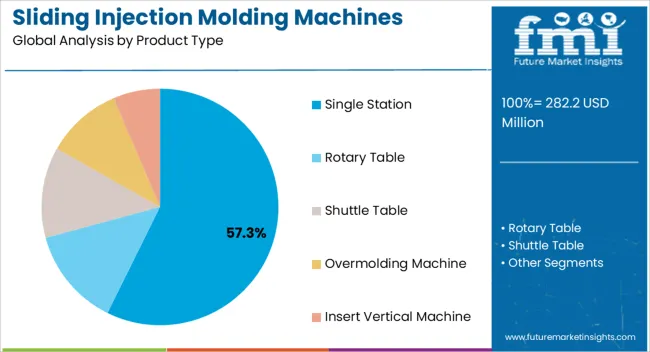
The single station product type segment is projected to account for 57.30% of total market revenue by 2025, making it the leading product category. This dominance is supported by its operational simplicity, cost effectiveness, and adaptability to a wide range of molding applications.
Manufacturers value single station configurations for their reliability in producing high quality molded parts while minimizing downtime. Their suitability for small to medium batch production and ease of integration into existing production lines have further increased adoption.
The balance of affordability, efficiency, and versatility has reinforced the prominence of single station machines in the market.

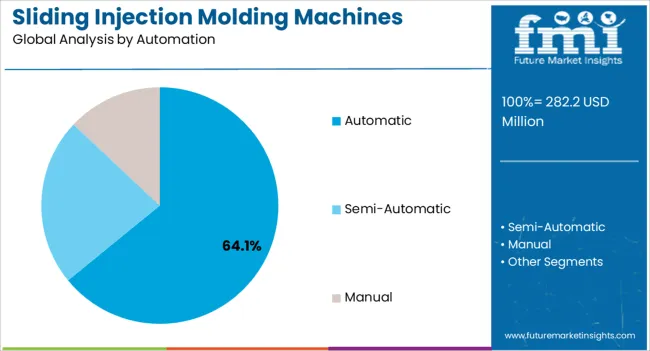
The automatic segment is expected to hold 64.10% of total revenue by 2025 within the automation category, positioning it as the most influential segment. This growth is being driven by the increasing need for precision, reduced labor dependence, and enhanced throughput in modern manufacturing.
Automatic systems enable consistent cycle times, higher output, and reduced defect rates. The adoption is also reinforced by their ability to integrate with digital control systems and robotics, improving traceability and productivity.
As industries continue to pursue efficiency and cost savings, automatic sliding injection molding machines remain the preferred choice.

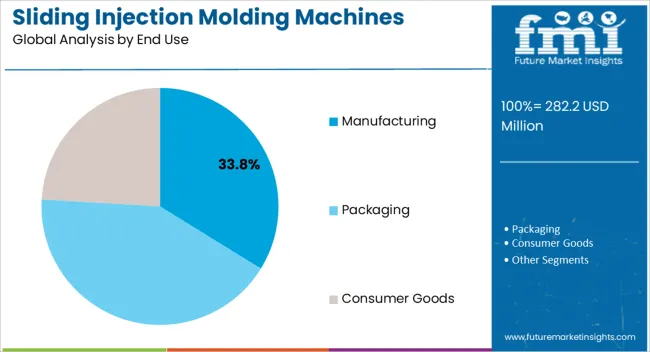
The manufacturing end use segment is projected to capture 33.80% of total market revenue by 2025, establishing it as the leading end use category. This is attributed to the strong demand for molded components across automotive, electronics, consumer goods, and industrial applications.
The sector values the precision, repeatability, and scalability offered by sliding injection molding machines. With growing emphasis on lean manufacturing practices and sustainability, manufacturers are increasingly relying on these machines to optimize material usage and improve energy efficiency.
The combination of performance benefits and compatibility with diverse product requirements has consolidated manufacturing as the primary end use segment in the market.
The historic outlook of the sliding injection molding machines industry showcases a journey of technological advancements and growing demand. Sliding injection molding machines introduced the innovative concept of sliding platens. These allowed for increased efficiency and versatility in the manufacturing process.
In the early stages, sliding injection molding machines faced a few challenges in terms of design and precision. However, continuous improvements and refinements in technology gradually addressed these issues, making them more reliable and efficient.
The progress significantly contributed to growing sliding injection molding machine demand, primarily driven by their exceptional capacity to manufacture intricate and complex parts. Incorporation of the sliding platen mechanism notably streamlined the manufacturing process by providing improved access to the mold.
It consequently reduced production time and enhanced operational efficiency.
The market further witnessed integration of automation and digitalization into sliding injection molding machines. This integration led to the rising adoption of computer numerical control (CNC) systems, robotics, and real-time monitoring across industries.
These technologies enabled precise control over the manufacturing process, improved quality control, and reduced downtime.
The future outlook for the sliding injection molding machines industry is poised to witness significant growth and transformation. One of the key drivers is increasing demand for lightweight and eco-friendly materials in various industries.
Need for these machines to mold complex and lightweight parts with high precision in industries such as automotive, aerospace, and electronics is set to aid demand. High focus on weight reduction and energy efficiency in these industries is also estimated to drive sales.
Advancements in technology, particularly in the fields of automation and digitalization, would shape the future of the industry. These advancements would not only optimize production processes but also minimize downtime and increase reliability & productivity.
Future outlook is set to be growing emphasis on sustainability and circular economy principles. Sliding injection molding machines are poised to play a pivotal role in supporting these initiatives.
These machines are set to empower manufacturers to embrace environmentally conscious practices while maintaining high-quality production standards.
Sliding Injection Molding Machines Market :
| Attributes | Sliding Injection Molding Machines Market |
|---|---|
| CAGR (2025 to 2035) | 3.9% |
| Market Value (2035) | USD 383.3 million |
| Opportunity | Integration of sliding injection molding machines with 3D printing and additive manufacturing technologies can unlock new possibilities. |
| Key Trends | Integration of additive manufacturing with sliding injection molding machines is an emerging trend. This combination allows for the production of molds with complex geometries, conformal cooling channels, and rapid prototyping capabilities. |
Stretch Blow Molding Machines Market :
| Attributes | Stretch Blow Molding Machines Market |
|---|---|
| CAGR (2025 to 2035) | 3.4% |
| Market Value (2035) | USD 1.2 billion |
| Opportunity | Continuous advancements in stretch blow molding technology have improved machine efficiency, productivity, and energy savings. These are expected to create new opportunities. |
| Key Trends | Stretch blow molding machines play a crucial role in producing plastic bottles, containers, and other packaging products. As demand for packaging continues to rise, need for stretch blow molding machines increases in tandem. |
Pulp Molding Machines Market :
| Attributes | Pulp Molding Machines Market |
|---|---|
| CAGR (2025 to 2035) | 3.7% |
| Market Value (2035) | USD 1.1 billion |
| Opportunity | Pulp molding machines offer flexibility in design and shape, allowing manufacturers to produce a wide range of packaging products tailored to their specific needs. |
| Key Trends | Pulp molding machines utilize recycled paper or agricultural waste fibers to create packaging items such as trays, containers, and cushioning materials, making them an attractive choice for those seeking environmentally responsible alternatives. |
Demand for Injection Press in India to Surge amid Increasing Research & Development Activities
| Country | India |
|---|---|
| Estimated Market Size (2035) | USD 21.3 million |
| Value-based CAGR (2025 to 2035) | 4.4% |
India is actively encouraging research and development activities in the field of sliding injection molding machines. The government has set up research grants and funding schemes to support academic institutions & research organizations in conducting innovative research. This emphasis on research promotes indigenous innovation, leading to the creation of unique and customized solutions.
Favorable Business Environment in China to Propel Demand for Plastic Injection Molding Machines
| Country | China |
|---|---|
| Estimated Market Size (2035) | USD 36.8 million |
| Value-based CAGR (2025 to 2035) | 4.1% |
China is poised to experience remarkable growth potential in the sliding injection molding machines market. China's robust industrial sector and extensive production capabilities have positioned it as a key player in the industry.
The country's favorable business environment, technological advancements, and abundant skilled labor force would contribute to its competitive edge in the market.
China's commitment to innovation, and research & development has enabled the emergence of cutting-edge sliding injection molding machines. Manufacturers in the country are projected to launch new machines with enhanced efficiency, precision, and automation capabilities.
Injection Molding Machine Manufacturers to Witness High Demand for Rotary Table
By product type, the single station and rotary table segments hold a leading sliding injection molding machines industry share due to their unique characteristics and advantages. The single station segment is expected to generate a share of 31% in 2035, while the rotary table category would hold 24% of share in the same year.
Distinctive feature of sliding injection molding machines lies in the incorporation of a rotary table. While one side of the rotary table is in operation, the other side can be prepared for the next molding process, minimizing idle time and maximizing output.
Manufacturers can hence effortlessly accommodate diverse product designs and configurations. The single station and rotary table segments are predicted to witness CAGRs of 4.5% and 3.2%, respectively in the next ten years.
Automatic Benchtop Injection Molding Machines to Experience Rising Demand
Demand for automatic and semi-automatic sliding injection molding machines is witnessing a steady rise in the market. Need to eliminate the requirement for manual intervention, reduce human error, and enhance production consistency is set to push demand for automatic machines.
Automatic and semi-automatic machines require fewer operators compared to their manual counterparts. This reduction in labor requirements translates into substantial cost savings for manufacturers, especially in the long run. Automation also allows for round-the-clock production, minimizing downtime and maximizing productivity, which would drive demand.
Automotive Companies to Look for Advanced Sliding Table Injection Machines by 2035
Automotive and packaging industries would play a vital role in driving sliding injection molding machine demand. Sliding injection molding machines are extensively used for the production of various automotive components.
Manufacturers are set to look for novel machines that can produce complex parts with precision and consistency. Their requirement also includes advanced machines that can meet stringent quality standards of the automotive sector. Components such as interior trim, dashboard panels, door handles, and exterior body parts can be efficiently produced by using sliding injection molding technology.
The packaging industry has a significant impact on the sliding injection molding machines market. Packaging plays a vital role in protecting and preserving products, as well as in marketing and branding efforts.
Sliding injection molding machines are set to be widely used in the production of packaging containers, caps, closures, and other packaging components. Ability to produce high-quality, consistent, and visually appealing packaging products is of utmost importance in this industry.
Integration of enhanced automation and industry principles is a unique strategy employed by market players. By incorporating robotic systems for material handling and parts removal, manufacturers would optimize production processes and improve quality control.
A few companies are adopting real-time monitoring and data analytics capabilities to expand their portfolios. This integration enables them to offer smart manufacturing solutions that maximize productivity, reduce labor costs, and ensure consistent product quality.
Customization:
Incorporation of multiple injection units and molds allow for simultaneous production of different components or even entirely distinct products. This capability enables manufacturers to respond swiftly to demands for personalized or unique designs.
Sustainability:
Sustainability is a paramount concern in modern manufacturing, and sliding injection molding machines offer unique features that promote environmentally friendly practices. Manufacturers are developing new machines that are equipped with energy-efficient heating and cooling systems to expand their portfolios.
Strategic Expansion:
Strategic expansion in the field of sliding injection molding machines presents exciting opportunities for manufacturers and the industry as a whole. Rising demand for innovative machines that offer smaller footprints and allow for easier integration into existing production lines is estimated to support manufacturers.
Acquisition:
Acquisitions in the field of sliding injection molding machines can lead to unique advancements and synergies within the industry. Through strategic acquisitions, the sliding injection molding machine industry can continuously innovate and deliver advanced solutions that meet evolving needs of manufacturers worldwide.
For instance,
Arburg GmbH + Co KG specializes in the production of high-quality sliding injection molding machines for a wide range of industries. A few of these include automotive, packaging, medical, and electronics industries.
Sumitomo (SHI) Demag Plastics Machinery GmbH offers a comprehensive range of sliding injection molding machines with advanced technologies and precise control systems. The company caters to various applications and production requirements.
| Attribute | Details |
|---|---|
| Estimated Market Size (2025) | USD 282.2 million |
| Projected Market Valuation (2035) | USD 406.9 million |
| Value-based CAGR (2025 to 2035) | 3.7% |
| Historical Data | 2020 to 2025 |
| Forecast Period | 2025 to 2035 |
| Quantitative Units | Value (USD million) |
| Segments Covered | Product Type, Automation, End Use, Region |
| Regions Covered | North America; Latin America; Western Europe; Eastern Europe; Russia & Belarus; Balkan & Baltic Countries; Central Asia; South Asia and the Pacific; East Asia; Middle East & Africa |
| Key Countries Covered | United States, Canada, Brazil, Mexico, Argentina, Germany, Italy, France, United Kingdom, Spain, BENELUX, Nordics, Czech Republic, Poland, Romania, Hungary, China, Japan, South Korea, India, Association of Southeast Asian Nations, Australia & New Zealand, Kingdom of Saudi Arabia, United Arab Emirates, Türkiye, Saudi Arabia, Algeria, Egypt, Morocco |
| Key Companies Profiled | Amrut Brothers Machinery Private Limited; Techno Machines India; Pratishna Engineers Ltd.; APSX LLC; Multiplas Enginery Co. Ltd; Krauss Maffei; Multitech Machinery Ltd.; Woojin Plaimm GmbH |
| Report Coverage | Revenue Forecast, Volume Forecast, Company Ranking, Competitive Landscape, Growth Factors, Trends and Pricing Analysis |
The global sliding injection molding machines market is estimated to be valued at USD 282.2 million in 2025.
The market size for the sliding injection molding machines market is projected to reach USD 406.9 million by 2035.
The sliding injection molding machines market is expected to grow at a 3.7% CAGR between 2025 and 2035.
The key product types in sliding injection molding machines market are single station, rotary table, shuttle table, overmolding machine and insert vertical machine.
In terms of automation, automatic segment to command 64.1% share in the sliding injection molding machines market in 2025.


Our Research Products

The "Full Research Suite" delivers actionable market intel, deep dives on markets or technologies, so clients act faster, cut risk, and unlock growth.

The Leaderboard benchmarks and ranks top vendors, classifying them as Established Leaders, Leading Challengers, or Disruptors & Challengers.

Locates where complements amplify value and substitutes erode it, forecasting net impact by horizon

We deliver granular, decision-grade intel: market sizing, 5-year forecasts, pricing, adoption, usage, revenue, and operational KPIs—plus competitor tracking, regulation, and value chains—across 60 countries broadly.

Spot the shifts before they hit your P&L. We track inflection points, adoption curves, pricing moves, and ecosystem plays to show where demand is heading, why it is changing, and what to do next across high-growth markets and disruptive tech

Real-time reads of user behavior. We track shifting priorities, perceptions of today’s and next-gen services, and provider experience, then pace how fast tech moves from trial to adoption, blending buyer, consumer, and channel inputs with social signals (#WhySwitch, #UX).

Partner with our analyst team to build a custom report designed around your business priorities. From analysing market trends to assessing competitors or crafting bespoke datasets, we tailor insights to your needs.
Supplier Intelligence
Discovery & Profiling
Capacity & Footprint
Performance & Risk
Compliance & Governance
Commercial Readiness
Who Supplies Whom
Scorecards & Shortlists
Playbooks & Docs
Category Intelligence
Definition & Scope
Demand & Use Cases
Cost Drivers
Market Structure
Supply Chain Map
Trade & Policy
Operating Norms
Deliverables
Buyer Intelligence
Account Basics
Spend & Scope
Procurement Model
Vendor Requirements
Terms & Policies
Entry Strategy
Pain Points & Triggers
Outputs
Pricing Analysis
Benchmarks
Trends
Should-Cost
Indexation
Landed Cost
Commercial Terms
Deliverables
Brand Analysis
Positioning & Value Prop
Share & Presence
Customer Evidence
Go-to-Market
Digital & Reputation
Compliance & Trust
KPIs & Gaps
Outputs
Full Research Suite comprises of:
Market outlook & trends analysis
Interviews & case studies
Strategic recommendations
Vendor profiles & capabilities analysis
5-year forecasts
8 regions and 60+ country-level data splits
Market segment data splits
12 months of continuous data updates
DELIVERED AS:
PDF EXCEL ONLINE
Injection Molding Machines Industry Analysis in India Size, Share & Forecast 2025 to 2035
Europe Injection Molding Machines Market Size and Share Forecast Outlook 2025 to 2035
Injection Molding Machine Market Size and Share Forecast Outlook 2025 to 2035
Injection Molding Polyamide 6 Market Growth – Trends & Forecast 2024-2034
Injection Molding Containers Market
Injection Blow Molding Machine Market Size and Share Forecast Outlook 2025 to 2035
Pulp Molding Machines Market Size and Share Forecast Outlook 2025 to 2035
Metal Injection Molding (MIM) Parts Market Size and Share Forecast Outlook 2025 to 2035
Powder Injection Molding Market Growth – Trends & Forecast 2025 to 2035
Lipstick Molding Machines Market Size and Share Forecast Outlook 2025 to 2035
Plastic Injection Molding Machine For Medtech Market Size and Share Forecast Outlook 2025 to 2035
Ceramic Injection Molding Market Size and Share Forecast Outlook 2025 to 2035
Stretch Blow Molding Machines Market Segmentation based on Technology Type, Orientation Type, End Use, and Region: A Forecast for 2025 and 2035
Market Share Insights of Leading Stretch Blow Molding Machines Providers
Particle Foam Molding Machines Market Size and Share Forecast Outlook 2025 to 2035
PET Stretch Blow Molding Machines Market Size and Share Forecast Outlook 2025 to 2035
Key Companies & Market Share in PET Stretch Blow Molding Machines Sector
Demand for Powder Injection Molding in USA Size and Share Forecast Outlook 2025 to 2035
Demand for Powder Injection Molding in Japan Size and Share Forecast Outlook 2025 to 2035
Sliding Patio Glass Door Market Size and Share Forecast Outlook 2025 to 2035

Thank you!
You will receive an email from our Business Development Manager. Please be sure to check your SPAM/JUNK folder too.
Chat With
MaRIA