Lightening / Whitening Agents Market Size and Share Forecast Outlook 2025 to 2035

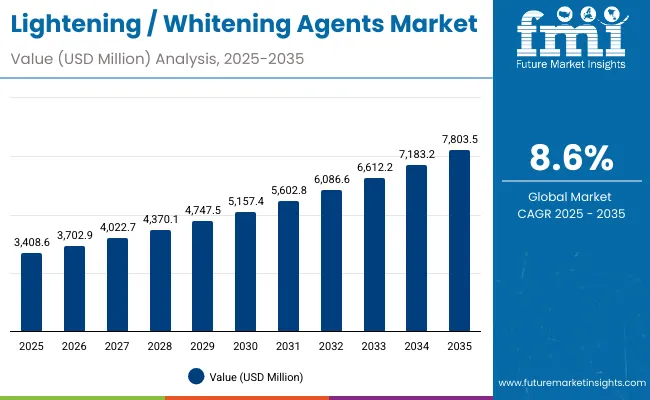
The Global Lightening / Whitening Agents Market is expected to record a valuation of USD 3,408.6 million in 2025 and USD 7,803.5 million in 2035, with an increase of USD 4,394.9 million, representing a total growth of 193% over the decade. The overall expansion reflects strong demand from skincare and dermocosmetic applications, underpinned by growing consumer preference for botanical brightening actives, biotechnology-derived whitening ingredients, and clinically validated tyrosinase inhibitors.
Quick Stats for Global Lightening / Whitening Agents Market

  • Global Lightening / Whitening Agents Market Value (2025): USD 3,408.6 million
  • Global Lightening / Whitening Agents Market Forecast Value (2035): USD 7,803.5 million
  • Global Lightening / Whitening Agents Market Forecast CAGR: 8.6%
  • Global Lightening / Whitening Agents Market Leading Segment in 2025: Tyrosinase Inhibitors (38.2%)
  • Global Lightening / Whitening Agents Market Key Growth Regions: Asia (China, India, Japan), Europe, North America
  • Top Key Players: BASF, Clariant, DSM-Firmenich, Givaudan, Symrise, Ashland, Croda, Seppic, Provital, Evonik

Lightening Whitening Agents Market

Global Lightening / Whitening Agents Market Key Takeaways

Metric Value
Estimated Value (2025E) USD 3,408.6 million
Forecast Value (2035F) USD 7,803.5 million
Forecast CAGR (2025 to 2035) 8.60%

During the first five-year period from 2025 to 2030, the market increases from USD 3,408.6 million to USD 5,157.4 million, adding USD 1,748.8 million, which accounts for nearly 40% of the total decade growth. This initial phase witnesses steady adoption across facial creams, serums, and spot correctors, driven by brands promoting active-based skin tone correction. Botanical and bio-fermented extracts such as arbutin, licorice root, and kojic acid dominate this phase, as natural-origin safety perception strengthens brand positioning.

The second half, from 2030 to 2035, contributes USD 2,646.1 million, equal to nearly 60% of the total decade growth, as the market jumps from USD 5,157.4 million to USD 7,803.5 million. This acceleration is powered by innovation in encapsulation technologies, sustained-release formulations, and biotechnology-derived actives that enable controlled delivery and enhanced skin compatibility. Long-term performance testing and integration of brightening actives into multifunctional products (such as anti-aging or moisturizing creams) reinforce the premiumization trend. The market also benefits from a rise in dermocosmetic and clinical-grade whitening formulations targeting hyperpigmentation and uneven skin tone across global markets.

From 2020 to 2024, the Global Lightening / Whitening Agents Market expanded significantly as the beauty industry shifted toward dermatologist-endorsed and efficacy-based brightening solutions. During this period, traditional whitening formulations evolved into scientifically backed products focusing on melanin pathway inhibition and cellular renewal. Market leadership was defined by raw material suppliers such as BASF, Clariant, and DSM-Firmenich, which together accounted for a substantial share of global value through their integrated portfolios of actives, peptides, and delivery technologies.

Competitive differentiation in this phase was primarily achieved through ingredient purity, safety, and bioavailability. Synthetic whitening agents like hydroquinone began losing ground due to tightening regulatory frameworks, while plant-based and biotechnology-derived actives gained favor among both consumers and brands. Between 2020 and 2024, most top cosmetic companies partnered with ingredient suppliers to introduce hybrid formulations combining antioxidants, tyrosinase inhibitors, and exfoliating renewal complexes.

By 2025, global demand for lightening and whitening actives is projected to reach USD 3,408.6 million, and the revenue mix is shifting as biotechnology and encapsulated delivery systems grow beyond 45% of total value. Traditional synthetic actives face competition from sustained-release botanical extracts with improved efficacy and minimal irritation profiles. Major ingredient manufacturers are repositioning toward sustainable production and clinically validated brightening peptides, while niche suppliers specialize in encapsulated beads and microemulsions designed for targeted release. The competitive advantage in the coming decade will hinge on scientific substantiation, bioactive stability, and global regulatory compliance rather than cost leadership alone.

Why the Global Lightening / Whitening Agents Market is Growing

Advancements in skin biology research and melanin pathway understanding have driven innovation in whitening actives. Modern formulations target multiple stages of melanin synthesis c from inhibition of tyrosinase enzyme activity to prevention of melanosome transfer enabling visible brightening without irritation. Among mechanisms, Tyrosinase inhibitors account for 38.2% share (USD 1,302.1 million) in 2025, led by actives like niacinamide, alpha-arbutin, and resorcinol derivatives, which are clinically proven to reduce pigmentation and even skin tone.

Rising consumer demand for natural and clean-label products has accelerated the adoption of Botanical actives, holding a 42.1% share (USD 1,435.0 million) in 2025. These include licorice, mulberry, bearberry, and green tea extracts, favored for their antioxidant and melanin-regulating properties. Meanwhile, Biotechnology-derived actives such as bio-fermented kojic acid, stabilized vitamin C derivatives, and recombinant peptides are setting new standards in efficacy.

Encapsulated / sustained-release systems command 46.2% market share (USD 1,574.8 million) in 2025, as encapsulation enhances stability and bioavailability, allowing longer-lasting effects and reduced irritation risk. The technology supports inclusion in high-end serums and professional-grade formulations. Furthermore, the expanding use of antioxidants like glutathione, vitamin C, and ascorbyl glucoside in brightening formulations promotes skin health while addressing environmental stressors such as UV exposure and pollution, strengthening market growth.

Regionally, Asia dominates demand, with China (CAGR 12.5%), India (CAGR 14.1%), and Japan (CAGR 10.1%) representing the fastest-growing markets due to strong consumer orientation toward whitening skincare. The USA market, valued at USD 679.8 million in 2025, will expand steadily to USD 1,383.4 million by 2035, supported by rising preference for tone-correcting and anti-dark-spot solutions. European markets such as the UK (CAGR 8.1%) and Germany (CAGR 6.1%) show consistent growth led by dermocosmetic product innovation and clinical-grade formulations.

Segmental Analysis

The Global Lightening / Whitening Agents Market demonstrates a structurally diverse segmentation across mechanisms, sources, delivery systems, physical forms, applications, and end uses, each playing a distinct role in shaping long-term value creation. Within mechanisms, Tyrosinase inhibitors dominate with a 38.2% share in 2025, as ingredients like niacinamide, alpha-arbutin, and resorcinol-based complexes remain central to both cosmetic and dermocosmetic formulations due to their clinically verified efficacy in suppressing melanin synthesis. By source, Botanical actives lead with 42.1% share, driven by rising consumer preference for clean-label, nature-derived ingredients sourced through sustainable extraction and biotechnology-based fermentation.

Encapsulated or sustained-release delivery systems with a commanding 46.2% market share are reshaping formulation stability and bioavailability by allowing controlled diffusion and enhanced skin tolerance, particularly in high-concentration brightening serums and professional-grade treatments. Across physical forms, liquid concentrates and microencapsulated beads are gaining traction in advanced skincare and clinical applications. In application terms, Face creams, serums, and spot correctors collectively account for the largest usage share, while professional peels represent a niche but high-growth opportunity in clinical settings. End-use analysis shows that Cosmetic and skincare brands continue to lead overall demand, followed by Dermocosmetic and clinical formulations, reflecting the increasing integration of brightening actives into medical-grade aesthetic care. Regionally, the market’s growth trajectory is anchored by Asiaespecially China, India, and Japan where cultural and beauty perceptions around luminosity continue to drive substantial product innovation and volume expansion, while mature markets such as the USA, UK, and Germany shift toward multifunctional, tone-correcting, and dermatologist-tested whitening products.
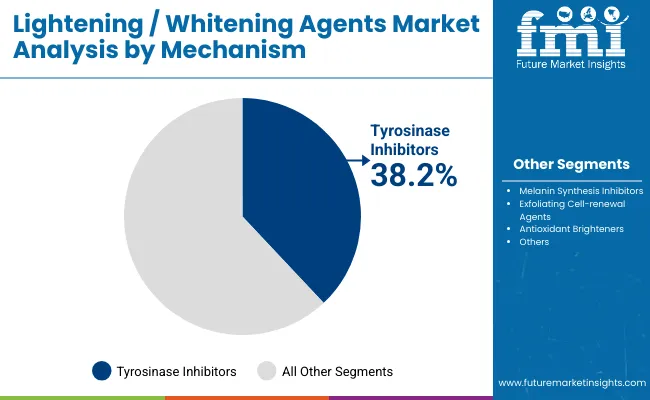
Insights into the Mechanism Segment with Tyrosinase Inhibitors Leading Market Share

Lightening Whitening Agents Market By Mechanism

Mechanism Value Share % 2025
Tyrosinase inhibitors 38.2%
Others 61.8%

The Tyrosinase inhibitors segment leads the market with 38.2% share in 2025, driven by active ingredients that interrupt melanin formation. Key molecules include niacinamide, alpha-arbutin, resorcinol derivatives, and stabilized vitamin C. Their clinical validation and compatibility with multiple formulations ensure wide acceptance across both premium and mass-market brands. Continuous innovation in molecular design is reducing irritation potential while enhancing efficacy, leading to high consumer trust and regulatory acceptance.

This segment’s dominance is further reinforced by strategic R&D collaborations between global ingredient suppliers and dermocosmetic brands, integrating tyrosinase-inhibiting complexes with antioxidant co-factors and cellular renewal boosters. As demand for safe and long-term brightening rises, the tyrosinase inhibitor category will continue to anchor the whitening ingredients portfolio through 2035.
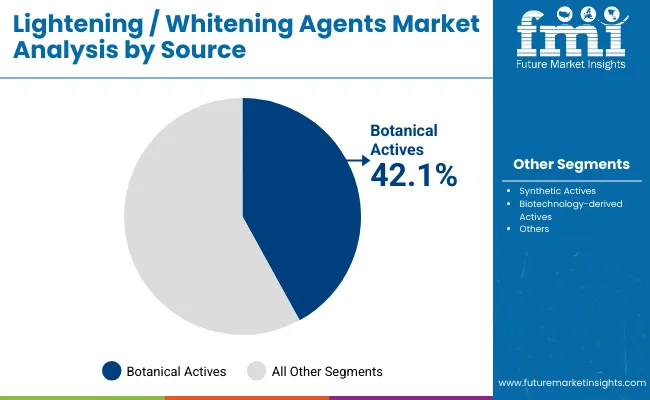
Insights into the Source Segment with Botanical Actives Gaining Momentum

Lightening Whitening Agents Market By Source

Source Value Share % 2025
Botanical actives 42.1%
Others 57.9%

The Botanical actives segment is expanding rapidly, supported by consumer preference for nature-derived formulations. Extracts like licorice, mulberry, and bearberry demonstrate strong tyrosinase inhibition while offering antioxidant and anti-inflammatory benefits. These actives are often used in synergy with peptides and vitamins to enhance visible skin tone improvement.

The rise of biotechnology-enabled cultivation and green extraction technologies is improving yield, purity, and reproducibility, helping brands meet sustainability and transparency expectations. As natural-origin ingredients become synonymous with skin safety and ethical sourcing, botanical actives are expected to maintain leadership across major skincare and dermocosmetic product lines.
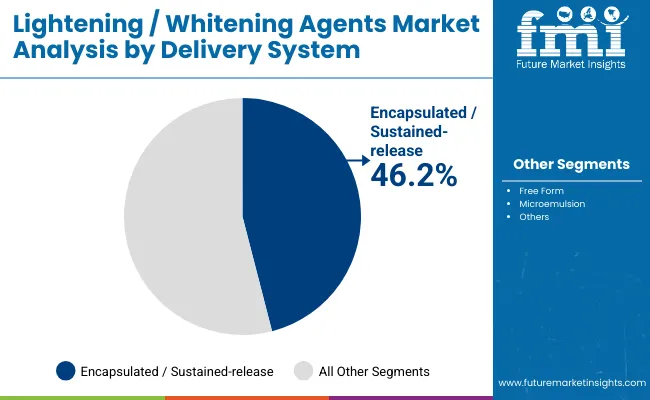
Insights into the Delivery System Segment with Encapsulated / Sustained-Release Dominating

Lightening Whitening Agents Market By Delivery System

Delivery System Value Share % 2025
Encapsulated / sustained-release 46.2%
Others 53.8%

Encapsulated and sustained-release systems represent the most technologically advanced delivery formats, commanding 46.2% share in 2025. These systems utilize liposomes, polymeric microspheres, and nanocarriers to stabilize actives and control their release over extended periods, improving bioavailability and efficacy.

Brands increasingly prefer encapsulated ingredients due to their compatibility with premium serums and clinical peels, offering enhanced stability against oxidation and degradation. This segment is pivotal in redefining formulation science, enabling ingredient houses like Croda, Seppic, and Evonik to lead through patented encapsulation platforms. As personalization and efficacy benchmarking evolve, encapsulated delivery is projected to remain central to next-generation brightening product innovation through 2035.

What are the Drivers, Restraints, and Key Trends of the Global Lightening / Whitening Agents Market?

Market Drivers

Biotechnology and Encapsulation Redefining Formulation Performance:

One of the strongest drivers of the Global Lightening / Whitening Agents Market is the integration of biotechnology and encapsulation science to achieve superior ingredient stability and efficacy. Ingredient leaders such as DSM-Firmenich, Evonik, and Croda are heavily investing in microencapsulation and sustained-release delivery platforms that stabilize actives like ascorbyl glucoside, resorcinol, and kojic acid against oxidation and degradation. These technologies enable prolonged release, deeper skin penetration, and lower irritation ratescritical advantages for regulatory compliance and sensitive-skin formulations. The result is a marked shift toward biotechnology-derived actives, offering consistent performance and eco-certifiable origins, strengthening brand differentiation in premium dermocosmetic lines.

Rising Clinical and Regulatory Standardization Driving Market Credibility:

Another key growth driver is the increasing clinical validation and standardization of brightening ingredients, which enhances global consumer confidence. Regulatory tightening in the USA, EU, and East Asia against hydroquinone and high-dose corticosteroids has accelerated the replacement with clinically backed alternatives like niacinamide, alpha-arbutin, and resorcinol derivatives. This shift has encouraged brands to pursue transparent efficacy data and peer-reviewed studies, often conducted in collaboration with dermatological institutions. As a result, ingredient suppliers with ISO-certified laboratories and strong regulatory documentation pipelines are capturing higher-value contracts with both multinational beauty houses and emerging clinical skincare brands.

Market Restraints

Stringent Global Regulations and Ingredient Bans Impacting Formulation Agility:

Despite the market’s expansion, regulatory volatility remains a critical restraint, particularly in regions enforcing bans or concentration limits on traditional whitening actives such as hydroquinone, mercury derivatives, and untested botanical blends. In the EU and ASEAN regions, stricter cosmetic safety directives require extensive testing and dossier submissions, prolonging product launch cycles. Smaller ingredient suppliers lacking toxicological or clinical data often face commercialization barriers. This results in a fragmented compliance environment where only major players with global regulatory infrastructure like BASF and Givaudan can scale consistently.

Growing Backlash Against ‘Skin Whitening’ Terminology and Shifting Beauty Narratives:

A rising socio-cultural restraint stems from evolving beauty narratives rejecting the concept of “skin whitening.” Global consumers increasingly favor terms like “brightening,” “radiance,” or “tone-evening”, leading to reformulations and rebranding costs for major manufacturers. This perception shift, while positive in inclusivity terms, challenges product messaging and marketing strategies across regions like North America and Western Europe. Companies must navigate a delicate balance between promoting luminosity and avoiding tone-based hierarchies, influencing both product labeling and regulatory claims frameworks.

Key Market Trends

Hybridization of Brightening with Anti-Aging and Barrier-Repair Functions:

A defining trend shaping the global landscape is the fusion of brightening agents with anti-aging and barrier-repair actives to form multifunctional skincare solutions. Consumers now expect visible brightening coupled with hydration, protection, and rejuvenation. Brands are combining actives such as niacinamide, peptides, and ceramide complexes within single formulations, promoting comprehensive skin health. This hybridization trend not only supports higher price realization but also drives ingredient diversification, with suppliers developing synergistic complexes that target both pigmentation and inflammation pathways simultaneously.

East Asia’s Leadership in Innovation Pipelines and Ingredient Diversification:

East Asiaparticularly China, Japan, and South Koreacontinues to set global innovation standards in the lightening and whitening segment. The region’s high R&D intensity and rapid commercialization cycles result in the fastest CAGR globally (China 12.5%, India 14.1%, Japan 10.1%). Local brands are adopting biotech-fermented brightening actives, enzyme inhibitors, and encapsulated vitamin C analogs to enhance product sophistication. Furthermore, the regulatory openness toward new fermentation-based actives gives East Asian manufacturers a competitive advantage, leading to early adoption of next-generation brightening molecules that later diffuse into Western markets.
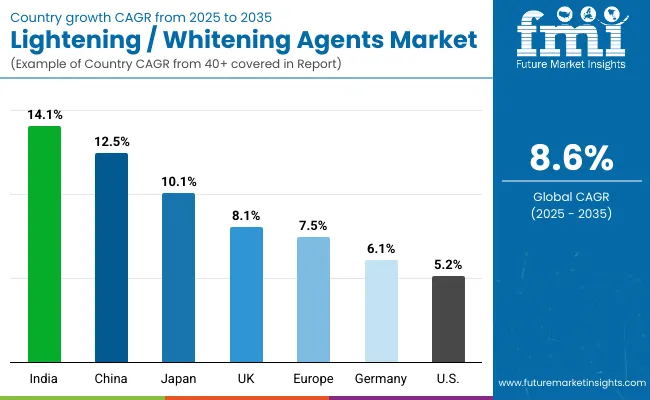
Analysis of Global Lightening / Whitening Agents Market By Key Countries

Lightening Whitening Agents Market By Country

Country Estimated CAGR (2025 to 2035)
China 12.5%
USA 5.2%
India 14.1%
UK 8.1%
Germany 6.1%
Japan 10.1%
Europe 7.5%

The Global Lightening / Whitening Agents Market exhibits strong regional contrasts in growth patterns between emerging and mature economies, reflecting differences in consumer preferences, cultural attitudes toward skin tone, and product innovation intensity. India leads globally with a CAGR of 14.1% from 2025 to 2035, supported by high consumer demand for brightening formulations across mass-market and premium skincare categories. The increasing adoption of herbal, Ayurvedic, and bio-fermented whitening ingredients combined with aggressive brand diversification by both domestic and multinational playerscontinues to fuel expansion. China, following closely with a 12.5% CAGR, benefits from deep-rooted skin-brightening traditions and a thriving cosmeceutical ecosystem, where biotech-derived actives and encapsulated vitamin C complexes are driving rapid innovation. Japan, with a 10.1% CAGR, remains a global benchmark for dermocosmetic precision, focusing on mild yet effective whitening formulations integrating peptides, hyaluronic acid, and antioxidant complexes that align with its “moist-whitening” skincare philosophy.

In contrast, mature Western markets are advancing at moderate yet steady rates, characterized by shifts from traditional whitening to tone-evening and luminosity-enhancing claims. The USA, expanding at 5.2% CAGR, shows rising consumer interest in dark spot correctors, hyperpigmentation serums, and dermatologist-recommended brightening creams, driven by the premium skincare and clinical aesthetic segments. In Europe, the market grows at 7.5% CAGR, led by regulatory-compliant formulations emphasizing safety, clean beauty, and bioactive transparency. Within Europe, the UK (8.1%) shows resilience through growing consumer awareness of niacinamide- and vitamin C-based brightening skincare, while Germany (6.1%) maintains steady progress through its strong dermocosmetic industry, focusing on hypoallergenic and clinically tested whitening products. Overall, Asia’s rapid innovation pace and consumer-led ingredient diversity continue to outstrip Western regions, positioning it as the global growth engine for lightening and whitening actives through 2035.

Sales Outlook for Lightening / Whitening Agents in the United States

Year USA Lightening / Whitening Agents Market (USD Million)
2025 679.80
2026 729.86
2027 783.60
2028 841.30
2029 903.24
2030 969.75
2031 1041.16
2032 1117.82
2033 1200.13
2034 1288.50
2035 1383.38

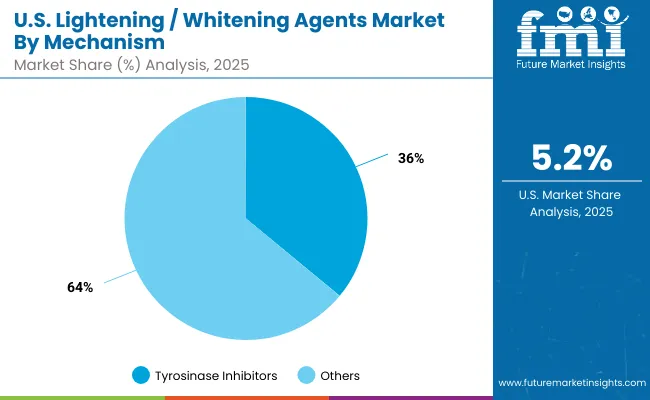
The Lightening / Whitening Agents Market in the United States is projected to grow at a CAGR of 5.2% between 2025 and 2035, supported by increasing adoption of clinical-grade brightening formulations and rising demand for dermatologist-endorsed tone-correcting products. The market is transitioning from traditional whitening concepts to scientifically validated brightening and anti-dark-spot solutions, as consumer awareness shifts toward skin health, radiance, and even tone. The strong performance of Tyrosinase inhibitors, contributing 36.1% of value share in 2025 (USD 245.4 Mn), reflects ongoing interest in efficacious ingredients like niacinamide, alpha-arbutin, and stabilized vitamin C.

Innovation is concentrated among dermocosmetic and cosmeceutical brands, which are expanding portfolios with products that combine brightening with barrier-repair and UV-defense benefits. USA-based skincare companies are integrating sustained-release encapsulation and antioxidant complexes into serums and spot correctors, increasing clinical efficacy and minimizing irritation. The rise of online retail channels and professional skin clinics offering customized brightening treatments has enhanced accessibility. Furthermore, USA consumers’ growing acceptance of biotechnology-derived actives and clean-label transparency continues to fuel product diversification.

  • Clinical and OTC brands are reformulating with niacinamide, resorcinol, and encapsulated vitamin C.
  • Skincare clinics are driving professional use of brightening peels and antioxidant serums.
  • Digital retail and D2C brands are enabling personalized solutions for hyperpigmentation and uneven tone.

Growth and Expansion Outlook for Lightening / Whitening Agents in the United Kingdom

The Lightening / Whitening Agents Market in the United Kingdom is expected to expand at a CAGR of 8.1% through 2035, led by increasing integration of brightening complexes in premium skincare and cosmeceutical products. The market’s evolution is shaped by consumer demand for non-irritating, clinically tested ingredients aligned with regulatory standards of the EU and UK cosmetic safety framework. Local and European manufacturers are emphasizing “radiance-enhancing” and “tone-evening” formulations over whitening claims, reflecting a shift toward inclusivity and transparency. The country’s strong network of dermocosmetic laboratories and aesthetic clinics fuels innovation in peptide-based and antioxidant-supported formulations.

UK-based skincare startups and established pharmaceutical-backed beauty brands are prioritizing encapsulated delivery systems for active stabilization. The inclusion of actives such as stabilized ascorbic acid, glutathione, and ferulic acid is reshaping the brightening segment. The retail sector, particularly specialty pharmacy chains and e-commerce platforms, has amplified awareness around skin-brightening routines as part of anti-aging and daily care regimens. Government initiatives encouraging sustainability in cosmetics production also support botanical and biotechnology-derived actives.

  • Cosmeceutical laboratories are pioneering stabilized vitamin C and peptide complexes.
  • Aesthetic clinics are promoting evidence-based “radiance” treatments and post-procedure brightening serums.
  • Sustainability policies are reinforcing demand for natural-origin brightening actives sourced through green chemistry.

Growth and Expansion Outlook for Lightening / Whitening Agents in India

India is witnessing the fastest growth globally, with the Lightening / Whitening Agents Market projected to record a CAGR of 14.1% from 2025 to 2035. Rapid urbanization, expanding middle-class consumption, and cultural emphasis on skin tone enhancement continue to drive robust demand across both mass and premium product tiers. Domestic skincare brands are adopting Ayurvedic, botanical, and bio-fermented actives such as turmeric, sandalwood, and kojic acid blends, while multinational players are introducing hybrid formulations combining herbal extracts with clinically validated brightening molecules. The penetration of brightening creams and serums into tier-2 and tier-3 cities has accelerated as pricing becomes more competitive and consumer awareness rises.

Educational marketing, celebrity endorsements, and influencer-led digital campaigns have further normalized brightening products within daily skincare routines. Pharmaceutical companies are collaborating with beauty brands to develop prescription-grade formulations addressing hyperpigmentation, melasma, and post-acne discoloration. This clinicalization of whitening formulations distinguishes India’s market from other Asian peers. Moreover, innovations in microencapsulation and pH-balanced delivery systems are improving the performance of natural actives, allowing local brands to compete with imported premium products.

  • Ayurveda-inspired brightening actives are merging with biotech-validated peptides and vitamins.
  • Local formulators are emphasizing affordability and clinical safety for mass-market penetration.
  • Pharma cosmetic partnerships are emerging for pigmentation-corrective topical treatments.

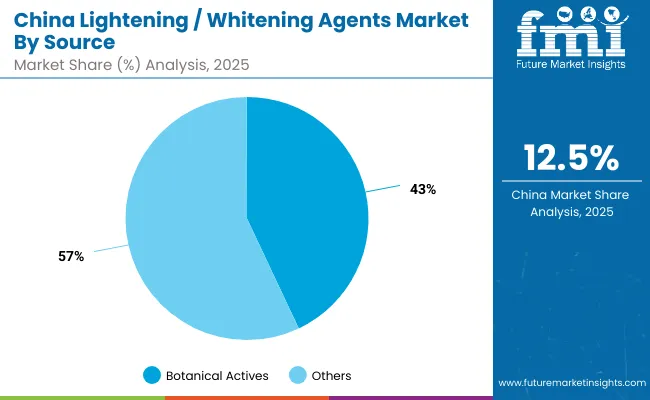
Sales Outlook for Lightening / Whitening Agents in China

The Lightening / Whitening Agents Market in China is expected to grow at a CAGR of 12.5%, the highest among major global economies, driven by the country’s strong consumer affinity for radiant, even-toned skin and its expanding ecosystem of cosmeceutical innovation and biotech manufacturing. In 2025, Botanical actives account for 43.2% of total value (USD 150.1 Mn), reflecting rapid adoption of herbal and fermentation-based whitening ingredients such as arbutin, licorice, and ginseng derivatives. The increasing popularity of hybrid formulations combining whitening, anti-aging, and hydration further accelerates market performance.

China’s domestic ingredient manufacturers are scaling up bio-fermentation platforms and peptide synthesis for local supply, reducing dependence on imports from Europe and Japan. Municipal and regional R&D clusters in Shanghai, Guangzhou, and Hangzhou are enabling faster ingredient commercialization and consumer testing. E-commerce-driven skincare consumption and influencer-led brand ecosystems have elevated brightening serums and facial essences to top-selling categories. Local brands are emphasizing translucency and glow over whitening, aligning with global inclusivity trends while retaining cultural emphasis on luminosity and youthfulness.

  • Biotech-based ingredient firms are producing cost-effective, high-purity whitening actives domestically.
  • E-commerce channels are dominating distribution through influencer-led skincare promotions.
  • Innovation in hybrid “brightening + hydrating + anti-aging” formulations continues to define market leadership.
Country 2025 Share (%)
USA 19.9%
China 10.2%
Japan 5.9%
Germany 13.1%
UK 6.9%
India 4.2%
Europe 18.8%
Country 2035 Share (%)
USA 17.7%
China 11.0%
Japan 7.2%
Germany 11.4%
UK 6.2%
India 5.1%
Europe 17.2%

Growth Outlook for Lightening / Whitening Agents Market in the United States

Usa Lightening Whitening Agents Market

Mechanism Segment Market Value Share, 2025
Tyrosinase inhibitors 36.10%
Others 63.90%

The Lightening / Whitening Agents Market in the United States is projected at USD 679.8 million in 2025, driven by advanced dermocosmetic innovation, rising adoption of antioxidant-based brightening agents, and increased consumer awareness of hyperpigmentation management. Tyrosinase inhibitors contribute 36.1% of total value, underscoring the dominance of clinically verified actives such as niacinamide, alpha-arbutin, and stabilized vitamin C derivatives. The remaining 63.9% represents a growing mix of exfoliating and antioxidant brighteners incorporated into high-performance facial serums and spot-correcting formulations.

The USA market exhibits a distinct transition from “whitening” to tone-correction and radiance-enhancement, shaped by cultural inclusivity and dermatological efficacy standards. Demand is shifting from traditional hydroquinone-based products toward multifunctional brightening complexes combining melanin inhibition, cell renewal, and barrier repair. A surge in encapsulated and microemulsion delivery systems is reinforcing long-term efficacy, aligning with clinical skincare trends across professional and OTC categories. The dermatology channel, supported by the American Academy of Dermatology’s advocacy for evidence-based pigmentation control, continues to be a key growth driver. Major global suppliers such as BASF, DSM-Firmenich, and Croda are collaborating with USA skincare brands to co-develop safe, sustainable brightening actives that meet FDA and EU standards.
  • The USA accounts for 19.9% of the global market in 2025, valued at USD 679.8 million.
  • Tyrosinase inhibitors lead mechanism demand with 36.1% share, reflecting medical-grade formulation uptake.
  • Growth is supported by encapsulation technology, clean-label actives, and dermocosmetic brand partnerships.

Growth Outlook for Lightening / Whitening Agents Market in China

South Korea Lightening Whitening Agents Market

China By Source Value Share % 2025
Botanical actives 43.2%
Others 56.8%

The Lightening / Whitening Agents Market in China is projected at USD 347.5 million in 2025, representing one of the most dynamic and fastest-expanding segments globally. Botanical actives contribute 43.2% of total value, led by natural-origin ingredients such as licorice extract, arbutin, and ginseng derivatives, which are integral to the cultural preference for holistic and herbal skincare. The remaining 56.8% comprises synthetic and biotechnology-derived actives, increasingly used in professional-grade and high-efficiency formulations.

China’s rapid market growthestimated at a CAGR of 12.5% through 2035is driven by a blend of cultural demand for luminous skin and high domestic innovation capacity. Local biotech firms are scaling up fermentation-based brightening actives such as stabilized kojic acid and recombinant peptides, while cosmetic conglomerates are investing heavily in encapsulated delivery systems that enhance stability and absorption. Cross-border e-commerce platforms are facilitating widespread access to advanced formulations, and government-backed R&D zones in Shanghai and Guangzhou are fostering innovation pipelines that rival Japan and South Korea. As Chinese consumers increasingly prefer transparent, clinical-grade ingredients, the country is becoming a production and innovation hub for global whitening actives.
  • China represents 10.2% of the global market in 2025, valued at USD 347.5 million.
  • Botanical actives lead with 43.2% share, supported by domestic sourcing and fermentation-driven innovation.
  • Growth is propelled by biotechnology-derived actives, R&D investments, and e-commerce-led skincare consumption.

Competitive Landscape of Global Lightening / Whitening Agents Market

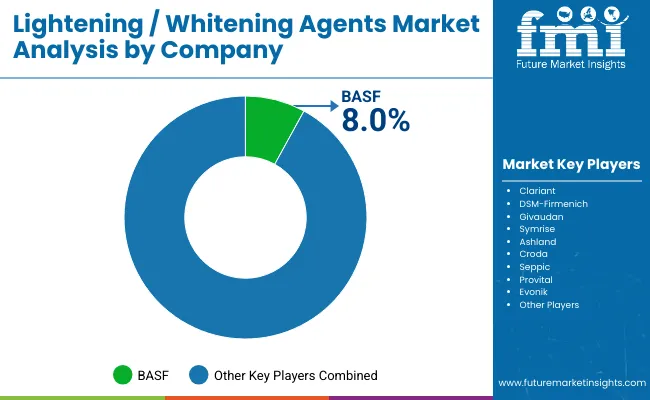
Lightening Whitening Agents Market By Company

Company Global Value Share 2025
BASF 8.0%
Others 92.0%

The Global Lightening / Whitening Agents Market is moderately fragmented, comprising multinational ingredient suppliers, dermocosmetic innovators, and niche botanical specialists competing across a broad spectrum of skincare and cosmetic applications. Global leaders such as BASF, DSM-Firmenich, and Givaudan maintain significant value share through their diversified ingredient portfolios, scientific validation platforms, and vertically integrated R&D ecosystems. Their leadership is driven by investments in biotechnology-derived actives, sustainable extraction methods, and encapsulation technologies that enhance ingredient efficacy and formulation stability. These companies are also strengthening partnerships with top skincare and cosmetic brands to co-develop next-generation brightening complexes that address both pigmentation and overall skin health.

Established mid-sized players such as Clariant, Symrise, and Croda are rapidly expanding their dermocosmetic actives portfolio to include botanical brightening agents, stabilized vitamin C derivatives, and biodegradable delivery systems. Their strategies center on green chemistry, skin microbiome safety, and multifunctional formulation design to cater to evolving regulatory and consumer demands. Mid-tier suppliers are also leveraging their global technical centers to support local formulation customization for markets in Asia-Pacific, Europe, and North America.

Niche-focused companies including Seppic, Provital, and Ashland focus on high-performance specialty actives and emulsifiers derived from plant-based or fermentation sources. Their expertise lies in ingredient traceability, sensory innovation, and synergistic formulation capabilities that allow customization for luxury skincare and clinical-grade products. These players are differentiating themselves through skin-friendly, irritation-free actives, designed for sensitive and inclusive skin tones, emphasizing performance validated by in-vitro and clinical studies.

Overall, competitive differentiation in the market is shifting from single-ingredient efficacy to integrated ecosystem innovationwhere sustainability, bioavailability, and digital formulation platforms define long-term leadership. Companies are moving beyond traditional whitening actives toward holistic brightening, combining melanin regulation, antioxidant protection, and barrier restoration within one formulation. Strategic collaborations between ingredient suppliers and beauty brands are becoming more prominent, especially for co-branded ingredient marketing and regulatory transparency. This transition signals a move toward science-backed, inclusive, and sustainability-driven brightening portfolios that reflect modern consumer expectations across both premium and mass-market skincare segments.

Key Developments in Global Lightening / Whitening Agents Market

  • On April 11, 2024, BASF launched a new digital service called “Ingredients Revealed” as part of its D’lite platform, which allows skincare formulators to upload or assemble formulations and instantly see criteria like sustainability, regulatory compliance, and labelsoffering real-time transparency in
  • On April 3, 2025, BASF unveiled three natural-based innovations at in-cosmetics Global: Verdessence® Maize, Lamesoft® OP Plus, and Dehyton® PK45 GA/RA, strengthening its portfolio of biodegradable and sustainably sourced ingredients aligned with consumer demand for cleaner beauty.

Scope of the Report

Item Value
Quantitative Units USD Million
Mechanism Melanin synthesis inhibitors, Tyrosinase inhibitors, Exfoliating cell-renewal agents, and Antioxidant brighteners
Source Synthetic actives, Botanical actives, Biotechnology-derived actives
Delivery System Encapsulated / sustained-release, Free form, and Microemulsion
Physical Form Liquid concentrates, Powders, and Encapsulated beads
Application Face creams & serums, Spot correctors, Body lotions, and Professional peels
End Use Cosmetic & skincare brands, Dermocosmetic & clinical, and OTC brightening products
Regions Covered North America, Europe, East Asia, South Asia & Pacific, Latin America, Middle East & Africa
Countries Covered United States, China, India, Japan, Germany, United Kingdom, France, Brazil, South Korea, and United Arab Emirates
Key Companies Profiled BASF, Clariant, DSM- Firmenich, Givaudan, Symrise, Ashland, Croda, Seppic, Provital, and Evonik
Additional Attributes Dollar sales by mechanism, source, delivery system, and application; rising demand for biotechnology-derived and encapsulated whitening actives; increased preference for botanical and natural-origin brighteners; innovations in sustained-release formulations and antioxidant-infused whitening solutions; growing integration of brightening actives in anti-aging and multifunctional skincare; market expansion in Asia driven by local biotech manufacturing and e-commerce; and global regulatory transitions favoring hydroquinone-free, clinically validated ingredients.

Key Segments

By Mechanism:

  • Melanin synthesis inhibitors
  • Tyrosinase inhibitors
  • Exfoliating cell-renewal agents
  • Antioxidant brighteners

By Source:

  • Synthetic actives
  • Botanical actives
  • Biotechnology-derived actives

By Delivery System:

  • Encapsulated / sustained-release
  • Free form
  • Microemulsion

By Physical Form:

  • Liquid concentrates
  • Powders
  • Encapsulated beads

By Application:

  • Face creams & serums
  • Spot correctors
  • Body lotions
  • Professional peels

By End Use:

  • Cosmetic & skincare brands
  • Dermocosmetic & clinical
  • OTC brightening products

By Region:

  • North America
  • Latin America
  • Europe
  • East Asia
  • South Asia & Pacific
  • Middle East and Africa

Table of Content

  1. Executive Summary
    • Global Market Outlook
    • Demand-side Trends
    • Supply-side Trends
    • Technology Roadmap Analysis
    • Analysis and Recommendations
  2. Market Overview
    • Market Coverage / Taxonomy
    • Market Definition / Scope / Limitations
  3. Market Background
    • Market Dynamics
      • Drivers
      • Restraints
      • Opportunity
      • Trends
    • Scenario Forecast
      • Demand in Optimistic Scenario
      • Demand in Likely Scenario
      • Demand in Conservative Scenario
    • Opportunity Map Analysis
    • Product Life Cycle Analysis
    • Supply Chain Analysis
      • Supply Side Participants and their Roles
        • Producers
        • Mid-Level Participants (Traders/ Agents/ Brokers)
        • Wholesalers and Distributors
      • Value Added and Value Created at Node in the Supply Chain
      • List of Raw Material Suppliers
      • List of Existing and Potential Buyer’s
    • Investment Feasibility Matrix
    • Value Chain Analysis
      • Profit Margin Analysis
      • Wholesalers and Distributors
      • Retailers
    • PESTLE and Porter’s Analysis
    • Regulatory Landscape
      • By Key Regions
      • By Key Countries
    • Regional Parent Market Outlook
    • Production and Consumption Statistics
    • Import and Export Statistics
  4. Global Market Analysis 2020 to 2024 and Forecast, 2025 to 2035
    • Historical Market Size Value (USD Million) & Volume (Units) Analysis, 2020 to 2024
    • Current and Future Market Size Value (USD Million) & Volume (Units) Projections, 2025 to 2035
      • Y-o-Y Growth Trend Analysis
      • Absolute $ Opportunity Analysis
  5. Global Market Analysis 2020 to 2024 and Forecast 2025 to 2035, By Mechanism
    • Introduction / Key Findings
    • Historical Market Size Value (USD Million) & Volume (Units) Analysis By Mechanism, 2020 to 2024
    • Current and Future Market Size Value (USD Million) & Volume (Units) Analysis and Forecast By Mechanism, 2025 to 2035
      • Melanin synthesis inhibitors
      • Tyrosinase inhibitors
      • Exfoliating cell-renewal agents
      • Antioxidant brighteners
    • Y-o-Y Growth Trend Analysis By Mechanism, 2020 to 2024
    • Absolute $ Opportunity Analysis By Mechanism, 2025 to 2035
  6. Global Market Analysis 2020 to 2024 and Forecast 2025 to 2035, By Source
    • Introduction / Key Findings
    • Historical Market Size Value (USD Million) & Volume (Units) Analysis By Source, 2020 to 2024
    • Current and Future Market Size Value (USD Million) & Volume (Units) Analysis and Forecast By Source, 2025 to 2035
      • Synthetic actives
      • Botanical actives
      • Biotechnology-derived actives
    • Y-o-Y Growth Trend Analysis By Source, 2020 to 2024
    • Absolute $ Opportunity Analysis By Source, 2025 to 2035
  7. Global Market Analysis 2020 to 2024 and Forecast 2025 to 2035, By Delivery System
    • Introduction / Key Findings
    • Historical Market Size Value (USD Million) & Volume (Units) Analysis By Delivery System, 2020 to 2024
    • Current and Future Market Size Value (USD Million) & Volume (Units) Analysis and Forecast By Delivery System, 2025 to 2035
      • Encapsulated / sustained-release
      • Free form
      • Microemulsion
    • Y-o-Y Growth Trend Analysis By Delivery System, 2020 to 2024
    • Absolute $ Opportunity Analysis By Delivery System, 2025 to 2035
  8. Global Market Analysis 2020 to 2024 and Forecast 2025 to 2035, By Physical Form
    • Introduction / Key Findings
    • Historical Market Size Value (USD Million) & Volume (Units) Analysis By Physical Form, 2020 to 2024
    • Current and Future Market Size Value (USD Million) & Volume (Units) Analysis and Forecast By Physical Form, 2025 to 2035
      • Liquid concentrates
      • Powders
      • Encapsulated beads
    • Y-o-Y Growth Trend Analysis By Physical Form, 2020 to 2024
    • Absolute $ Opportunity Analysis By Physical Form, 2025 to 2035
  9. Global Market Analysis 2020 to 2024 and Forecast 2025 to 2035, By Application
    • Introduction / Key Findings
    • Historical Market Size Value (USD Million) & Volume (Units) Analysis By Application, 2020 to 2024
    • Current and Future Market Size Value (USD Million) & Volume (Units) Analysis and Forecast By Application, 2025 to 2035
      • Face creams & serums
      • Spot correctors
      • Body lotions
      • Professional peels
    • Y-o-Y Growth Trend Analysis By Application, 2020 to 2024
    • Absolute $ Opportunity Analysis By Application, 2025 to 2035
  10. Global Market Analysis 2020 to 2024 and Forecast 2025 to 2035, By End Use
    • Introduction / Key Findings
    • Historical Market Size Value (USD Million) & Volume (Units) Analysis By End Use, 2020 to 2024
    • Current and Future Market Size Value (USD Million) & Volume (Units) Analysis and Forecast By End Use, 2025 to 2035
      • Cosmetic & skincare brands
      • Dermocosmetic & clinical
      • OTC brightening products
    • Y-o-Y Growth Trend Analysis By End Use, 2020 to 2024
    • Absolute $ Opportunity Analysis By End Use, 2025 to 2035
  11. Global Market Analysis 2020 to 2024 and Forecast 2025 to 2035, By Region
    • Introduction
    • Historical Market Size Value (USD Million) & Volume (Units) Analysis By Region, 2020 to 2024
    • Current Market Size Value (USD Million) & Volume (Units) Analysis and Forecast By Region, 2025 to 2035
      • North America
      • Latin America
      • Europe
      • East Asia
      • South Asia & Pacific
      • Middle East and Africa
    • Market Attractiveness Analysis By Region
  12. North America Market Analysis 2020 to 2024 and Forecast 2025 to 2035, By Country
    • Historical Market Size Value (USD Million) & Volume (Units) Trend Analysis By Market Taxonomy, 2020 to 2024
    • Market Size Value (USD Million) & Volume (Units) Forecast By Market Taxonomy, 2025 to 2035
      • By Country
        • USA
        • Canada
      • By Mechanism
      • By Source
      • By Delivery System
      • By Physical Form
      • By Application
      • By End Use
    • Market Attractiveness Analysis
      • By Country
      • By Mechanism
      • By Source
      • By Delivery System
      • By Physical Form
      • By Application
      • By End Use
    • Key Takeaways
  13. Latin America Market Analysis 2020 to 2024 and Forecast 2025 to 2035, By Country
    • Historical Market Size Value (USD Million) & Volume (Units) Trend Analysis By Market Taxonomy, 2020 to 2024
    • Market Size Value (USD Million) & Volume (Units) Forecast By Market Taxonomy, 2025 to 2035
      • By Country
        • Brazil
        • Mexico
        • Colombia
        • Rest of Latin America
      • By Mechanism
      • By Source
      • By Delivery System
      • By Physical Form
      • By Application
      • By End Use
    • Market Attractiveness Analysis
      • By Country
      • By Mechanism
      • By Source
      • By Delivery System
      • By Physical Form
      • By Application
      • By End Use
    • Key Takeaways
  14. Europe Market Analysis 2020 to 2024 and Forecast 2025 to 2035, By Country
    • Historical Market Size Value (USD Million) & Volume (Units) Trend Analysis By Market Taxonomy, 2020 to 2024
    • Market Size Value (USD Million) & Volume (Units) Forecast By Market Taxonomy, 2025 to 2035
      • By Country
        • Germany
        • UK
        • France
        • Italy
        • Spain
        • Belgium
        • Netherlands
        • Nordic
        • Switzerland
        • Russia
        • Poland
        • Rest of Europe
      • By Mechanism
      • By Source
      • By Delivery System
      • By Physical Form
      • By Application
      • By End Use
    • Market Attractiveness Analysis
      • By Country
      • By Mechanism
      • By Source
      • By Delivery System
      • By Physical Form
      • By Application
      • By End Use
    • Key Takeaways
  15. East Asia Market Analysis 2020 to 2024 and Forecast 2025 to 2035, By Country
    • Historical Market Size Value (USD Million) & Volume (Units) Trend Analysis By Market Taxonomy, 2020 to 2024
    • Market Size Value (USD Million) & Volume (Units) Forecast By Market Taxonomy, 2025 to 2035
      • By Country
        • China
        • Japan
        • South Korea
      • By Mechanism
      • By Source
      • By Delivery System
      • By Physical Form
      • By Application
      • By End Use
    • Market Attractiveness Analysis
      • By Country
      • By Mechanism
      • By Source
      • By Delivery System
      • By Physical Form
      • By Application
      • By End Use
    • Key Takeaways
  16. South Asia & Pacific Market Analysis 2020 to 2024 and Forecast 2025 to 2035, By Country
    • Historical Market Size Value (USD Million) & Volume (Units) Trend Analysis By Market Taxonomy, 2020 to 2024
    • Market Size Value (USD Million) & Volume (Units) Forecast By Market Taxonomy, 2025 to 2035
      • By Country
        • India
        • Thailand
        • Malaysia
        • Indonesia
        • Singapore
        • Vietnam
        • Australia
        • New Zealand
        • Rest of South Asia
      • By Mechanism
      • By Source
      • By Delivery System
      • By Physical Form
      • By Application
      • By End Use
    • Market Attractiveness Analysis
      • By Country
      • By Mechanism
      • By Source
      • By Delivery System
      • By Physical Form
      • By Application
      • By End Use
    • Key Takeaways
  17. Middle East and Africa Market Analysis 2020 to 2024 and Forecast 2025 to 2035, By Country
    • Historical Market Size Value (USD Million) & Volume (Units) Trend Analysis By Market Taxonomy, 2020 to 2024
    • Market Size Value (USD Million) & Volume (Units) Forecast By Market Taxonomy, 2025 to 2035
      • By Country
        • Turkey
        • UAE
        • Saudi Arabia
        • Israel
        • Other GCC Countries
        • North Africa
        • South Africa
      • By Mechanism
      • By Source
      • By Delivery System
      • By Physical Form
      • By Application
      • By End Use
    • Market Attractiveness Analysis
      • By Country
      • By Mechanism
      • By Source
      • By Delivery System
      • By Physical Form
      • By Application
      • By End Use
    • Key Takeaways
  18. Key Countries Market Analysis
    • USA
      • Pricing Analysis
      • Market Share Analysis, 2024
        • By Mechanism
        • By Source
        • By Delivery System
        • By Physical Form
        • By Application
        • By End Use
    • Canada
      • Pricing Analysis
      • Market Share Analysis, 2024
        • By Mechanism
        • By Source
        • By Delivery System
        • By Physical Form
        • By Application
        • By End Use
    • Brazil
      • Pricing Analysis
      • Market Share Analysis, 2024
        • By Mechanism
        • By Source
        • By Delivery System
        • By Physical Form
        • By Application
        • By End Use
    • Mexico
      • Pricing Analysis
      • Market Share Analysis, 2024
        • By Mechanism
        • By Source
        • By Delivery System
        • By Physical Form
        • By Application
        • By End Use
    • Colombia
      • Pricing Analysis
      • Market Share Analysis, 2024
        • By Mechanism
        • By Source
        • By Delivery System
        • By Physical Form
        • By Application
        • By End Use
    • Germany
      • Pricing Analysis
      • Market Share Analysis, 2024
        • By Mechanism
        • By Source
        • By Delivery System
        • By Physical Form
        • By Application
        • By End Use
    • UK
      • Pricing Analysis
      • Market Share Analysis, 2024
        • By Mechanism
        • By Source
        • By Delivery System
        • By Physical Form
        • By Application
        • By End Use
    • France
      • Pricing Analysis
      • Market Share Analysis, 2024
        • By Mechanism
        • By Source
        • By Delivery System
        • By Physical Form
        • By Application
        • By End Use
    • Italy
      • Pricing Analysis
      • Market Share Analysis, 2024
        • By Mechanism
        • By Source
        • By Delivery System
        • By Physical Form
        • By Application
        • By End Use
    • Spain
      • Pricing Analysis
      • Market Share Analysis, 2024
        • By Mechanism
        • By Source
        • By Delivery System
        • By Physical Form
        • By Application
        • By End Use
    • Belgium
      • Pricing Analysis
      • Market Share Analysis, 2024
        • By Mechanism
        • By Source
        • By Delivery System
        • By Physical Form
        • By Application
        • By End Use
    • Netherlands
      • Pricing Analysis
      • Market Share Analysis, 2024
        • By Mechanism
        • By Source
        • By Delivery System
        • By Physical Form
        • By Application
        • By End Use
    • Nordic
      • Pricing Analysis
      • Market Share Analysis, 2024
        • By Mechanism
        • By Source
        • By Delivery System
        • By Physical Form
        • By Application
        • By End Use
    • Switzerland
      • Pricing Analysis
      • Market Share Analysis, 2024
        • By Mechanism
        • By Source
        • By Delivery System
        • By Physical Form
        • By Application
        • By End Use
    • Russia
      • Pricing Analysis
      • Market Share Analysis, 2024
        • By Mechanism
        • By Source
        • By Delivery System
        • By Physical Form
        • By Application
        • By End Use
    • Poland
      • Pricing Analysis
      • Market Share Analysis, 2024
        • By Mechanism
        • By Source
        • By Delivery System
        • By Physical Form
        • By Application
        • By End Use
    • China
      • Pricing Analysis
      • Market Share Analysis, 2024
        • By Mechanism
        • By Source
        • By Delivery System
        • By Physical Form
        • By Application
        • By End Use
    • Japan
      • Pricing Analysis
      • Market Share Analysis, 2024
        • By Mechanism
        • By Source
        • By Delivery System
        • By Physical Form
        • By Application
        • By End Use
    • South Korea
      • Pricing Analysis
      • Market Share Analysis, 2024
        • By Mechanism
        • By Source
        • By Delivery System
        • By Physical Form
        • By Application
        • By End Use
    • India
      • Pricing Analysis
      • Market Share Analysis, 2024
        • By Mechanism
        • By Source
        • By Delivery System
        • By Physical Form
        • By Application
        • By End Use
    • Thailand
      • Pricing Analysis
      • Market Share Analysis, 2024
        • By Mechanism
        • By Source
        • By Delivery System
        • By Physical Form
        • By Application
        • By End Use
    • Indonesia
      • Pricing Analysis
      • Market Share Analysis, 2024
        • By Mechanism
        • By Source
        • By Delivery System
        • By Physical Form
        • By Application
        • By End Use
    • Australia
      • Pricing Analysis
      • Market Share Analysis, 2024
        • By Mechanism
        • By Source
        • By Delivery System
        • By Physical Form
        • By Application
        • By End Use
    • New Zealand
      • Pricing Analysis
      • Market Share Analysis, 2024
        • By Mechanism
        • By Source
        • By Delivery System
        • By Physical Form
        • By Application
        • By End Use
    • Turkey
      • Pricing Analysis
      • Market Share Analysis, 2024
        • By Mechanism
        • By Source
        • By Delivery System
        • By Physical Form
        • By Application
        • By End Use
    • UAE
      • Pricing Analysis
      • Market Share Analysis, 2024
        • By Mechanism
        • By Source
        • By Delivery System
        • By Physical Form
        • By Application
        • By End Use
    • Saudi Arabia
      • Pricing Analysis
      • Market Share Analysis, 2024
        • By Mechanism
        • By Source
        • By Delivery System
        • By Physical Form
        • By Application
        • By End Use
    • Israel
      • Pricing Analysis
      • Market Share Analysis, 2024
        • By Mechanism
        • By Source
        • By Delivery System
        • By Physical Form
        • By Application
        • By End Use
    • North Africa
      • Pricing Analysis
      • Market Share Analysis, 2024
        • By Mechanism
        • By Source
        • By Delivery System
        • By Physical Form
        • By Application
        • By End Use
    • South Africa
      • Pricing Analysis
      • Market Share Analysis, 2024
        • By Mechanism
        • By Source
        • By Delivery System
        • By Physical Form
        • By Application
        • By End Use
  19. Market Structure Analysis
    • Competition Dashboard
    • Competition Benchmarking
    • Market Share Analysis of Top Players
      • By Regional
      • By Mechanism
      • By Source
      • By Delivery System
      • By Physical Form
      • By Application
      • By End Use
  20. Competition Analysis
    • Competition Deep Dive
      • BASF
        • Overview
        • Product Portfolio
        • Profitability by Market Segments (Product/Age /Sales Channel/Region)
        • Sales Footprint
        • Strategy Overview
          • Marketing Strategy
          • Product Strategy
          • Channel Strategy
      • Clariant
        • Overview
        • Product Portfolio
        • Profitability by Market Segments (Product/Age /Sales Channel/Region)
        • Sales Footprint
        • Strategy Overview
          • Marketing Strategy
          • Product Strategy
          • Channel Strategy
      • DSM-Firmenich
        • Overview
        • Product Portfolio
        • Profitability by Market Segments (Product/Age /Sales Channel/Region)
        • Sales Footprint
        • Strategy Overview
          • Marketing Strategy
          • Product Strategy
          • Channel Strategy
      • Givaudan
        • Overview
        • Product Portfolio
        • Profitability by Market Segments (Product/Age /Sales Channel/Region)
        • Sales Footprint
        • Strategy Overview
          • Marketing Strategy
          • Product Strategy
          • Channel Strategy
      • Symrise
        • Overview
        • Product Portfolio
        • Profitability by Market Segments (Product/Age /Sales Channel/Region)
        • Sales Footprint
        • Strategy Overview
          • Marketing Strategy
          • Product Strategy
          • Channel Strategy
      • Ashland
        • Overview
        • Product Portfolio
        • Profitability by Market Segments (Product/Age /Sales Channel/Region)
        • Sales Footprint
        • Strategy Overview
          • Marketing Strategy
          • Product Strategy
          • Channel Strategy
      • Croda
        • Overview
        • Product Portfolio
        • Profitability by Market Segments (Product/Age /Sales Channel/Region)
        • Sales Footprint
        • Strategy Overview
          • Marketing Strategy
          • Product Strategy
          • Channel Strategy
      • Seppic
        • Overview
        • Product Portfolio
        • Profitability by Market Segments (Product/Age /Sales Channel/Region)
        • Sales Footprint
        • Strategy Overview
          • Marketing Strategy
          • Product Strategy
          • Channel Strategy
      • Provital
        • Overview
        • Product Portfolio
        • Profitability by Market Segments (Product/Age /Sales Channel/Region)
        • Sales Footprint
        • Strategy Overview
          • Marketing Strategy
          • Product Strategy
          • Channel Strategy
      • Evonik
        • Overview
        • Product Portfolio
        • Profitability by Market Segments (Product/Age /Sales Channel/Region)
        • Sales Footprint
        • Strategy Overview
          • Marketing Strategy
          • Product Strategy
          • Channel Strategy
      • Others
        • Overview
        • Product Portfolio
        • Profitability by Market Segments (Product/Age /Sales Channel/Region)
        • Sales Footprint
        • Strategy Overview
          • Marketing Strategy
          • Product Strategy
          • Channel Strategy
  21. Assumptions & Acronyms Used
  22. Research Methodology

List of Tables

  • Table 1: Global Market Value (USD Million) Forecast by Region, 2020-2035
  • Table 2: Global Market Volume (Units) Forecast by Region, 2020-2035
  • Table 3: Global Market Value (USD Million) Forecast by Mechanism, 2020-2035
  • Table 4: Global Market Volume (Units) Forecast by Mechanism, 2020-2035
  • Table 5: Global Market Value (USD Million) Forecast by Source, 2020-2035
  • Table 6: Global Market Volume (Units) Forecast by Source, 2020-2035
  • Table 7: Global Market Value (USD Million) Forecast by Delivery System, 2020-2035
  • Table 8: Global Market Volume (Units) Forecast by Delivery System, 2020-2035
  • Table 9: Global Market Value (USD Million) Forecast by Physical Form, 2020-2035
  • Table 10: Global Market Volume (Units) Forecast by Physical Form, 2020-2035
  • Table 11: Global Market Value (USD Million) Forecast by Application, 2020-2035
  • Table 12: Global Market Volume (Units) Forecast by Application, 2020-2035
  • Table 13: Global Market Value (USD Million) Forecast by End Use, 2020-2035
  • Table 14: Global Market Volume (Units) Forecast by End Use, 2020-2035
  • Table 15: North America Market Value (USD Million) Forecast by Country, 2020-2035
  • Table 16: North America Market Volume (Units) Forecast by Country, 2020-2035
  • Table 17: North America Market Value (USD Million) Forecast by Mechanism, 2020-2035
  • Table 18: North America Market Volume (Units) Forecast by Mechanism, 2020-2035
  • Table 19: North America Market Value (USD Million) Forecast by Source, 2020-2035
  • Table 20: North America Market Volume (Units) Forecast by Source, 2020-2035
  • Table 21: North America Market Value (USD Million) Forecast by Delivery System, 2020-2035
  • Table 22: North America Market Volume (Units) Forecast by Delivery System, 2020-2035
  • Table 23: North America Market Value (USD Million) Forecast by Physical Form, 2020-2035
  • Table 24: North America Market Volume (Units) Forecast by Physical Form, 2020-2035
  • Table 25: North America Market Value (USD Million) Forecast by Application, 2020-2035
  • Table 26: North America Market Volume (Units) Forecast by Application, 2020-2035
  • Table 27: North America Market Value (USD Million) Forecast by End Use, 2020-2035
  • Table 28: North America Market Volume (Units) Forecast by End Use, 2020-2035
  • Table 29: Latin America Market Value (USD Million) Forecast by Country, 2020-2035
  • Table 30: Latin America Market Volume (Units) Forecast by Country, 2020-2035
  • Table 31: Latin America Market Value (USD Million) Forecast by Mechanism, 2020-2035
  • Table 32: Latin America Market Volume (Units) Forecast by Mechanism, 2020-2035
  • Table 33: Latin America Market Value (USD Million) Forecast by Source, 2020-2035
  • Table 34: Latin America Market Volume (Units) Forecast by Source, 2020-2035
  • Table 35: Latin America Market Value (USD Million) Forecast by Delivery System, 2020-2035
  • Table 36: Latin America Market Volume (Units) Forecast by Delivery System, 2020-2035
  • Table 37: Latin America Market Value (USD Million) Forecast by Physical Form, 2020-2035
  • Table 38: Latin America Market Volume (Units) Forecast by Physical Form, 2020-2035
  • Table 39: Latin America Market Value (USD Million) Forecast by Application, 2020-2035
  • Table 40: Latin America Market Volume (Units) Forecast by Application, 2020-2035
  • Table 41: Latin America Market Value (USD Million) Forecast by End Use, 2020-2035
  • Table 42: Latin America Market Volume (Units) Forecast by End Use, 2020-2035
  • Table 43: Europe Market Value (USD Million) Forecast by Country, 2020-2035
  • Table 44: Europe Market Volume (Units) Forecast by Country, 2020-2035
  • Table 45: Europe Market Value (USD Million) Forecast by Mechanism, 2020-2035
  • Table 46: Europe Market Volume (Units) Forecast by Mechanism, 2020-2035
  • Table 47: Europe Market Value (USD Million) Forecast by Source, 2020-2035
  • Table 48: Europe Market Volume (Units) Forecast by Source, 2020-2035
  • Table 49: Europe Market Value (USD Million) Forecast by Delivery System, 2020-2035
  • Table 50: Europe Market Volume (Units) Forecast by Delivery System, 2020-2035
  • Table 51: Europe Market Value (USD Million) Forecast by Physical Form, 2020-2035
  • Table 52: Europe Market Volume (Units) Forecast by Physical Form, 2020-2035
  • Table 53: Europe Market Value (USD Million) Forecast by Application, 2020-2035
  • Table 54: Europe Market Volume (Units) Forecast by Application, 2020-2035
  • Table 55: Europe Market Value (USD Million) Forecast by End Use, 2020-2035
  • Table 56: Europe Market Volume (Units) Forecast by End Use, 2020-2035
  • Table 57: East Asia Market Value (USD Million) Forecast by Country, 2020-2035
  • Table 58: East Asia Market Volume (Units) Forecast by Country, 2020-2035
  • Table 59: East Asia Market Value (USD Million) Forecast by Mechanism, 2020-2035
  • Table 60: East Asia Market Volume (Units) Forecast by Mechanism, 2020-2035
  • Table 61: East Asia Market Value (USD Million) Forecast by Source, 2020-2035
  • Table 62: East Asia Market Volume (Units) Forecast by Source, 2020-2035
  • Table 63: East Asia Market Value (USD Million) Forecast by Delivery System, 2020-2035
  • Table 64: East Asia Market Volume (Units) Forecast by Delivery System, 2020-2035
  • Table 65: East Asia Market Value (USD Million) Forecast by Physical Form, 2020-2035
  • Table 66: East Asia Market Volume (Units) Forecast by Physical Form, 2020-2035
  • Table 67: East Asia Market Value (USD Million) Forecast by Application, 2020-2035
  • Table 68: East Asia Market Volume (Units) Forecast by Application, 2020-2035
  • Table 69: East Asia Market Value (USD Million) Forecast by End Use, 2020-2035
  • Table 70: East Asia Market Volume (Units) Forecast by End Use, 2020-2035
  • Table 71: South Asia & Pacific Market Value (USD Million) Forecast by Country, 2020-2035
  • Table 72: South Asia & Pacific Market Volume (Units) Forecast by Country, 2020-2035
  • Table 73: South Asia & Pacific Market Value (USD Million) Forecast by Mechanism, 2020-2035
  • Table 74: South Asia & Pacific Market Volume (Units) Forecast by Mechanism, 2020-2035
  • Table 75: South Asia & Pacific Market Value (USD Million) Forecast by Source, 2020-2035
  • Table 76: South Asia & Pacific Market Volume (Units) Forecast by Source, 2020-2035
  • Table 77: South Asia & Pacific Market Value (USD Million) Forecast by Delivery System, 2020-2035
  • Table 78: South Asia & Pacific Market Volume (Units) Forecast by Delivery System, 2020-2035
  • Table 79: South Asia & Pacific Market Value (USD Million) Forecast by Physical Form, 2020-2035
  • Table 80: South Asia & Pacific Market Volume (Units) Forecast by Physical Form, 2020-2035
  • Table 81: South Asia & Pacific Market Value (USD Million) Forecast by Application, 2020-2035
  • Table 82: South Asia & Pacific Market Volume (Units) Forecast by Application, 2020-2035
  • Table 83: South Asia & Pacific Market Value (USD Million) Forecast by End Use, 2020-2035
  • Table 84: South Asia & Pacific Market Volume (Units) Forecast by End Use, 2020-2035
  • Table 85: Middle East and Africa Market Value (USD Million) Forecast by Country, 2020-2035
  • Table 86: Middle East and Africa Market Volume (Units) Forecast by Country, 2020-2035
  • Table 87: Middle East and Africa Market Value (USD Million) Forecast by Mechanism, 2020-2035
  • Table 88: Middle East and Africa Market Volume (Units) Forecast by Mechanism, 2020-2035
  • Table 89: Middle East and Africa Market Value (USD Million) Forecast by Source, 2020-2035
  • Table 90: Middle East and Africa Market Volume (Units) Forecast by Source, 2020-2035
  • Table 91: Middle East and Africa Market Value (USD Million) Forecast by Delivery System, 2020-2035
  • Table 92: Middle East and Africa Market Volume (Units) Forecast by Delivery System, 2020-2035
  • Table 93: Middle East and Africa Market Value (USD Million) Forecast by Physical Form, 2020-2035
  • Table 94: Middle East and Africa Market Volume (Units) Forecast by Physical Form, 2020-2035
  • Table 95: Middle East and Africa Market Value (USD Million) Forecast by Application, 2020-2035
  • Table 96: Middle East and Africa Market Volume (Units) Forecast by Application, 2020-2035
  • Table 97: Middle East and Africa Market Value (USD Million) Forecast by End Use, 2020-2035
  • Table 98: Middle East and Africa Market Volume (Units) Forecast by End Use, 2020-2035

List of Figures

  • Figure 1: Global Market Value (USD Million) by Mechanism, 2025-2035
  • Figure 2: Global Market Value (USD Million) by Source, 2025-2035
  • Figure 3: Global Market Value (USD Million) by Delivery System, 2025-2035
  • Figure 4: Global Market Value (USD Million) by Physical Form, 2025-2035
  • Figure 5: Global Market Value (USD Million) by Application, 2025-2035
  • Figure 6: Global Market Value (USD Million) by End Use, 2025-2035
  • Figure 7: Global Market Value (USD Million) by Region, 2025-2035
  • Figure 8: Global Market Value (USD Million) Analysis by Region, 2020-2035
  • Figure 9: Global Market Volume (Units) Analysis by Region, 2020-2035
  • Figure 10: Global Market Value Share (%) and BPS Analysis by Region, 2025-2035
  • Figure 11: Global Market Y-o-Y Growth (%) Projections by Region, 2025-2035
  • Figure 12: Global Market Value (USD Million) Analysis by Mechanism, 2020-2035
  • Figure 13: Global Market Volume (Units) Analysis by Mechanism, 2020-2035
  • Figure 14: Global Market Value Share (%) and BPS Analysis by Mechanism, 2025-2035
  • Figure 15: Global Market Y-o-Y Growth (%) Projections by Mechanism, 2025-2035
  • Figure 16: Global Market Value (USD Million) Analysis by Source, 2020-2035
  • Figure 17: Global Market Volume (Units) Analysis by Source, 2020-2035
  • Figure 18: Global Market Value Share (%) and BPS Analysis by Source, 2025-2035
  • Figure 19: Global Market Y-o-Y Growth (%) Projections by Source, 2025-2035
  • Figure 20: Global Market Value (USD Million) Analysis by Delivery System, 2020-2035
  • Figure 21: Global Market Volume (Units) Analysis by Delivery System, 2020-2035
  • Figure 22: Global Market Value Share (%) and BPS Analysis by Delivery System, 2025-2035
  • Figure 23: Global Market Y-o-Y Growth (%) Projections by Delivery System, 2025-2035
  • Figure 24: Global Market Value (USD Million) Analysis by Physical Form, 2020-2035
  • Figure 25: Global Market Volume (Units) Analysis by Physical Form, 2020-2035
  • Figure 26: Global Market Value Share (%) and BPS Analysis by Physical Form, 2025-2035
  • Figure 27: Global Market Y-o-Y Growth (%) Projections by Physical Form, 2025-2035
  • Figure 28: Global Market Value (USD Million) Analysis by Application, 2020-2035
  • Figure 29: Global Market Volume (Units) Analysis by Application, 2020-2035
  • Figure 30: Global Market Value Share (%) and BPS Analysis by Application, 2025-2035
  • Figure 31: Global Market Y-o-Y Growth (%) Projections by Application, 2025-2035
  • Figure 32: Global Market Value (USD Million) Analysis by End Use, 2020-2035
  • Figure 33: Global Market Volume (Units) Analysis by End Use, 2020-2035
  • Figure 34: Global Market Value Share (%) and BPS Analysis by End Use, 2025-2035
  • Figure 35: Global Market Y-o-Y Growth (%) Projections by End Use, 2025-2035
  • Figure 36: Global Market Attractiveness by Mechanism, 2025-2035
  • Figure 37: Global Market Attractiveness by Source, 2025-2035
  • Figure 38: Global Market Attractiveness by Delivery System, 2025-2035
  • Figure 39: Global Market Attractiveness by Physical Form, 2025-2035
  • Figure 40: Global Market Attractiveness by Application, 2025-2035
  • Figure 41: Global Market Attractiveness by End Use, 2025-2035
  • Figure 42: Global Market Attractiveness by Region, 2025-2035
  • Figure 43: North America Market Value (USD Million) by Mechanism, 2025-2035
  • Figure 44: North America Market Value (USD Million) by Source, 2025-2035
  • Figure 45: North America Market Value (USD Million) by Delivery System, 2025-2035
  • Figure 46: North America Market Value (USD Million) by Physical Form, 2025-2035
  • Figure 47: North America Market Value (USD Million) by Application, 2025-2035
  • Figure 48: North America Market Value (USD Million) by End Use, 2025-2035
  • Figure 49: North America Market Value (USD Million) by Country, 2025-2035
  • Figure 50: North America Market Value (USD Million) Analysis by Country, 2020-2035
  • Figure 51: North America Market Volume (Units) Analysis by Country, 2020-2035
  • Figure 52: North America Market Value Share (%) and BPS Analysis by Country, 2025-2035
  • Figure 53: North America Market Y-o-Y Growth (%) Projections by Country, 2025-2035
  • Figure 54: North America Market Value (USD Million) Analysis by Mechanism, 2020-2035
  • Figure 55: North America Market Volume (Units) Analysis by Mechanism, 2020-2035
  • Figure 56: North America Market Value Share (%) and BPS Analysis by Mechanism, 2025-2035
  • Figure 57: North America Market Y-o-Y Growth (%) Projections by Mechanism, 2025-2035
  • Figure 58: North America Market Value (USD Million) Analysis by Source, 2020-2035
  • Figure 59: North America Market Volume (Units) Analysis by Source, 2020-2035
  • Figure 60: North America Market Value Share (%) and BPS Analysis by Source, 2025-2035
  • Figure 61: North America Market Y-o-Y Growth (%) Projections by Source, 2025-2035
  • Figure 62: North America Market Value (USD Million) Analysis by Delivery System, 2020-2035
  • Figure 63: North America Market Volume (Units) Analysis by Delivery System, 2020-2035
  • Figure 64: North America Market Value Share (%) and BPS Analysis by Delivery System, 2025-2035
  • Figure 65: North America Market Y-o-Y Growth (%) Projections by Delivery System, 2025-2035
  • Figure 66: North America Market Value (USD Million) Analysis by Physical Form, 2020-2035
  • Figure 67: North America Market Volume (Units) Analysis by Physical Form, 2020-2035
  • Figure 68: North America Market Value Share (%) and BPS Analysis by Physical Form, 2025-2035
  • Figure 69: North America Market Y-o-Y Growth (%) Projections by Physical Form, 2025-2035
  • Figure 70: North America Market Value (USD Million) Analysis by Application, 2020-2035
  • Figure 71: North America Market Volume (Units) Analysis by Application, 2020-2035
  • Figure 72: North America Market Value Share (%) and BPS Analysis by Application, 2025-2035
  • Figure 73: North America Market Y-o-Y Growth (%) Projections by Application, 2025-2035
  • Figure 74: North America Market Value (USD Million) Analysis by End Use, 2020-2035
  • Figure 75: North America Market Volume (Units) Analysis by End Use, 2020-2035
  • Figure 76: North America Market Value Share (%) and BPS Analysis by End Use, 2025-2035
  • Figure 77: North America Market Y-o-Y Growth (%) Projections by End Use, 2025-2035
  • Figure 78: North America Market Attractiveness by Mechanism, 2025-2035
  • Figure 79: North America Market Attractiveness by Source, 2025-2035
  • Figure 80: North America Market Attractiveness by Delivery System, 2025-2035
  • Figure 81: North America Market Attractiveness by Physical Form, 2025-2035
  • Figure 82: North America Market Attractiveness by Application, 2025-2035
  • Figure 83: North America Market Attractiveness by End Use, 2025-2035
  • Figure 84: North America Market Attractiveness by Country, 2025-2035
  • Figure 85: Latin America Market Value (USD Million) by Mechanism, 2025-2035
  • Figure 86: Latin America Market Value (USD Million) by Source, 2025-2035
  • Figure 87: Latin America Market Value (USD Million) by Delivery System, 2025-2035
  • Figure 88: Latin America Market Value (USD Million) by Physical Form, 2025-2035
  • Figure 89: Latin America Market Value (USD Million) by Application, 2025-2035
  • Figure 90: Latin America Market Value (USD Million) by End Use, 2025-2035
  • Figure 91: Latin America Market Value (USD Million) by Country, 2025-2035
  • Figure 92: Latin America Market Value (USD Million) Analysis by Country, 2020-2035
  • Figure 93: Latin America Market Volume (Units) Analysis by Country, 2020-2035
  • Figure 94: Latin America Market Value Share (%) and BPS Analysis by Country, 2025-2035
  • Figure 95: Latin America Market Y-o-Y Growth (%) Projections by Country, 2025-2035
  • Figure 96: Latin America Market Value (USD Million) Analysis by Mechanism, 2020-2035
  • Figure 97: Latin America Market Volume (Units) Analysis by Mechanism, 2020-2035
  • Figure 98: Latin America Market Value Share (%) and BPS Analysis by Mechanism, 2025-2035
  • Figure 99: Latin America Market Y-o-Y Growth (%) Projections by Mechanism, 2025-2035
  • Figure 100: Latin America Market Value (USD Million) Analysis by Source, 2020-2035
  • Figure 101: Latin America Market Volume (Units) Analysis by Source, 2020-2035
  • Figure 102: Latin America Market Value Share (%) and BPS Analysis by Source, 2025-2035
  • Figure 103: Latin America Market Y-o-Y Growth (%) Projections by Source, 2025-2035
  • Figure 104: Latin America Market Value (USD Million) Analysis by Delivery System, 2020-2035
  • Figure 105: Latin America Market Volume (Units) Analysis by Delivery System, 2020-2035
  • Figure 106: Latin America Market Value Share (%) and BPS Analysis by Delivery System, 2025-2035
  • Figure 107: Latin America Market Y-o-Y Growth (%) Projections by Delivery System, 2025-2035
  • Figure 108: Latin America Market Value (USD Million) Analysis by Physical Form, 2020-2035
  • Figure 109: Latin America Market Volume (Units) Analysis by Physical Form, 2020-2035
  • Figure 110: Latin America Market Value Share (%) and BPS Analysis by Physical Form, 2025-2035
  • Figure 111: Latin America Market Y-o-Y Growth (%) Projections by Physical Form, 2025-2035
  • Figure 112: Latin America Market Value (USD Million) Analysis by Application, 2020-2035
  • Figure 113: Latin America Market Volume (Units) Analysis by Application, 2020-2035
  • Figure 114: Latin America Market Value Share (%) and BPS Analysis by Application, 2025-2035
  • Figure 115: Latin America Market Y-o-Y Growth (%) Projections by Application, 2025-2035
  • Figure 116: Latin America Market Value (USD Million) Analysis by End Use, 2020-2035
  • Figure 117: Latin America Market Volume (Units) Analysis by End Use, 2020-2035
  • Figure 118: Latin America Market Value Share (%) and BPS Analysis by End Use, 2025-2035
  • Figure 119: Latin America Market Y-o-Y Growth (%) Projections by End Use, 2025-2035
  • Figure 120: Latin America Market Attractiveness by Mechanism, 2025-2035
  • Figure 121: Latin America Market Attractiveness by Source, 2025-2035
  • Figure 122: Latin America Market Attractiveness by Delivery System, 2025-2035
  • Figure 123: Latin America Market Attractiveness by Physical Form, 2025-2035
  • Figure 124: Latin America Market Attractiveness by Application, 2025-2035
  • Figure 125: Latin America Market Attractiveness by End Use, 2025-2035
  • Figure 126: Latin America Market Attractiveness by Country, 2025-2035
  • Figure 127: Europe Market Value (USD Million) by Mechanism, 2025-2035
  • Figure 128: Europe Market Value (USD Million) by Source, 2025-2035
  • Figure 129: Europe Market Value (USD Million) by Delivery System, 2025-2035
  • Figure 130: Europe Market Value (USD Million) by Physical Form, 2025-2035
  • Figure 131: Europe Market Value (USD Million) by Application, 2025-2035
  • Figure 132: Europe Market Value (USD Million) by End Use, 2025-2035
  • Figure 133: Europe Market Value (USD Million) by Country, 2025-2035
  • Figure 134: Europe Market Value (USD Million) Analysis by Country, 2020-2035
  • Figure 135: Europe Market Volume (Units) Analysis by Country, 2020-2035
  • Figure 136: Europe Market Value Share (%) and BPS Analysis by Country, 2025-2035
  • Figure 137: Europe Market Y-o-Y Growth (%) Projections by Country, 2025-2035
  • Figure 138: Europe Market Value (USD Million) Analysis by Mechanism, 2020-2035
  • Figure 139: Europe Market Volume (Units) Analysis by Mechanism, 2020-2035
  • Figure 140: Europe Market Value Share (%) and BPS Analysis by Mechanism, 2025-2035
  • Figure 141: Europe Market Y-o-Y Growth (%) Projections by Mechanism, 2025-2035
  • Figure 142: Europe Market Value (USD Million) Analysis by Source, 2020-2035
  • Figure 143: Europe Market Volume (Units) Analysis by Source, 2020-2035
  • Figure 144: Europe Market Value Share (%) and BPS Analysis by Source, 2025-2035
  • Figure 145: Europe Market Y-o-Y Growth (%) Projections by Source, 2025-2035
  • Figure 146: Europe Market Value (USD Million) Analysis by Delivery System, 2020-2035
  • Figure 147: Europe Market Volume (Units) Analysis by Delivery System, 2020-2035
  • Figure 148: Europe Market Value Share (%) and BPS Analysis by Delivery System, 2025-2035
  • Figure 149: Europe Market Y-o-Y Growth (%) Projections by Delivery System, 2025-2035
  • Figure 150: Europe Market Value (USD Million) Analysis by Physical Form, 2020-2035
  • Figure 151: Europe Market Volume (Units) Analysis by Physical Form, 2020-2035
  • Figure 152: Europe Market Value Share (%) and BPS Analysis by Physical Form, 2025-2035
  • Figure 153: Europe Market Y-o-Y Growth (%) Projections by Physical Form, 2025-2035
  • Figure 154: Europe Market Value (USD Million) Analysis by Application, 2020-2035
  • Figure 155: Europe Market Volume (Units) Analysis by Application, 2020-2035
  • Figure 156: Europe Market Value Share (%) and BPS Analysis by Application, 2025-2035
  • Figure 157: Europe Market Y-o-Y Growth (%) Projections by Application, 2025-2035
  • Figure 158: Europe Market Value (USD Million) Analysis by End Use, 2020-2035
  • Figure 159: Europe Market Volume (Units) Analysis by End Use, 2020-2035
  • Figure 160: Europe Market Value Share (%) and BPS Analysis by End Use, 2025-2035
  • Figure 161: Europe Market Y-o-Y Growth (%) Projections by End Use, 2025-2035
  • Figure 162: Europe Market Attractiveness by Mechanism, 2025-2035
  • Figure 163: Europe Market Attractiveness by Source, 2025-2035
  • Figure 164: Europe Market Attractiveness by Delivery System, 2025-2035
  • Figure 165: Europe Market Attractiveness by Physical Form, 2025-2035
  • Figure 166: Europe Market Attractiveness by Application, 2025-2035
  • Figure 167: Europe Market Attractiveness by End Use, 2025-2035
  • Figure 168: Europe Market Attractiveness by Country, 2025-2035
  • Figure 169: East Asia Market Value (USD Million) by Mechanism, 2025-2035
  • Figure 170: East Asia Market Value (USD Million) by Source, 2025-2035
  • Figure 171: East Asia Market Value (USD Million) by Delivery System, 2025-2035
  • Figure 172: East Asia Market Value (USD Million) by Physical Form, 2025-2035
  • Figure 173: East Asia Market Value (USD Million) by Application, 2025-2035
  • Figure 174: East Asia Market Value (USD Million) by End Use, 2025-2035
  • Figure 175: East Asia Market Value (USD Million) by Country, 2025-2035
  • Figure 176: East Asia Market Value (USD Million) Analysis by Country, 2020-2035
  • Figure 177: East Asia Market Volume (Units) Analysis by Country, 2020-2035
  • Figure 178: East Asia Market Value Share (%) and BPS Analysis by Country, 2025-2035
  • Figure 179: East Asia Market Y-o-Y Growth (%) Projections by Country, 2025-2035
  • Figure 180: East Asia Market Value (USD Million) Analysis by Mechanism, 2020-2035
  • Figure 181: East Asia Market Volume (Units) Analysis by Mechanism, 2020-2035
  • Figure 182: East Asia Market Value Share (%) and BPS Analysis by Mechanism, 2025-2035
  • Figure 183: East Asia Market Y-o-Y Growth (%) Projections by Mechanism, 2025-2035
  • Figure 184: East Asia Market Value (USD Million) Analysis by Source, 2020-2035
  • Figure 185: East Asia Market Volume (Units) Analysis by Source, 2020-2035
  • Figure 186: East Asia Market Value Share (%) and BPS Analysis by Source, 2025-2035
  • Figure 187: East Asia Market Y-o-Y Growth (%) Projections by Source, 2025-2035
  • Figure 188: East Asia Market Value (USD Million) Analysis by Delivery System, 2020-2035
  • Figure 189: East Asia Market Volume (Units) Analysis by Delivery System, 2020-2035
  • Figure 190: East Asia Market Value Share (%) and BPS Analysis by Delivery System, 2025-2035
  • Figure 191: East Asia Market Y-o-Y Growth (%) Projections by Delivery System, 2025-2035
  • Figure 192: East Asia Market Value (USD Million) Analysis by Physical Form, 2020-2035
  • Figure 193: East Asia Market Volume (Units) Analysis by Physical Form, 2020-2035
  • Figure 194: East Asia Market Value Share (%) and BPS Analysis by Physical Form, 2025-2035
  • Figure 195: East Asia Market Y-o-Y Growth (%) Projections by Physical Form, 2025-2035
  • Figure 196: East Asia Market Value (USD Million) Analysis by Application, 2020-2035
  • Figure 197: East Asia Market Volume (Units) Analysis by Application, 2020-2035
  • Figure 198: East Asia Market Value Share (%) and BPS Analysis by Application, 2025-2035
  • Figure 199: East Asia Market Y-o-Y Growth (%) Projections by Application, 2025-2035
  • Figure 200: East Asia Market Value (USD Million) Analysis by End Use, 2020-2035
  • Figure 201: East Asia Market Volume (Units) Analysis by End Use, 2020-2035
  • Figure 202: East Asia Market Value Share (%) and BPS Analysis by End Use, 2025-2035
  • Figure 203: East Asia Market Y-o-Y Growth (%) Projections by End Use, 2025-2035
  • Figure 204: East Asia Market Attractiveness by Mechanism, 2025-2035
  • Figure 205: East Asia Market Attractiveness by Source, 2025-2035
  • Figure 206: East Asia Market Attractiveness by Delivery System, 2025-2035
  • Figure 207: East Asia Market Attractiveness by Physical Form, 2025-2035
  • Figure 208: East Asia Market Attractiveness by Application, 2025-2035
  • Figure 209: East Asia Market Attractiveness by End Use, 2025-2035
  • Figure 210: East Asia Market Attractiveness by Country, 2025-2035
  • Figure 211: South Asia & Pacific Market Value (USD Million) by Mechanism, 2025-2035
  • Figure 212: South Asia & Pacific Market Value (USD Million) by Source, 2025-2035
  • Figure 213: South Asia & Pacific Market Value (USD Million) by Delivery System, 2025-2035
  • Figure 214: South Asia & Pacific Market Value (USD Million) by Physical Form, 2025-2035
  • Figure 215: South Asia & Pacific Market Value (USD Million) by Application, 2025-2035
  • Figure 216: South Asia & Pacific Market Value (USD Million) by End Use, 2025-2035
  • Figure 217: South Asia & Pacific Market Value (USD Million) by Country, 2025-2035
  • Figure 218: South Asia & Pacific Market Value (USD Million) Analysis by Country, 2020-2035
  • Figure 219: South Asia & Pacific Market Volume (Units) Analysis by Country, 2020-2035
  • Figure 220: South Asia & Pacific Market Value Share (%) and BPS Analysis by Country, 2025-2035
  • Figure 221: South Asia & Pacific Market Y-o-Y Growth (%) Projections by Country, 2025-2035
  • Figure 222: South Asia & Pacific Market Value (USD Million) Analysis by Mechanism, 2020-2035
  • Figure 223: South Asia & Pacific Market Volume (Units) Analysis by Mechanism, 2020-2035
  • Figure 224: South Asia & Pacific Market Value Share (%) and BPS Analysis by Mechanism, 2025-2035
  • Figure 225: South Asia & Pacific Market Y-o-Y Growth (%) Projections by Mechanism, 2025-2035
  • Figure 226: South Asia & Pacific Market Value (USD Million) Analysis by Source, 2020-2035
  • Figure 227: South Asia & Pacific Market Volume (Units) Analysis by Source, 2020-2035
  • Figure 228: South Asia & Pacific Market Value Share (%) and BPS Analysis by Source, 2025-2035
  • Figure 229: South Asia & Pacific Market Y-o-Y Growth (%) Projections by Source, 2025-2035
  • Figure 230: South Asia & Pacific Market Value (USD Million) Analysis by Delivery System, 2020-2035
  • Figure 231: South Asia & Pacific Market Volume (Units) Analysis by Delivery System, 2020-2035
  • Figure 232: South Asia & Pacific Market Value Share (%) and BPS Analysis by Delivery System, 2025-2035
  • Figure 233: South Asia & Pacific Market Y-o-Y Growth (%) Projections by Delivery System, 2025-2035
  • Figure 234: South Asia & Pacific Market Value (USD Million) Analysis by Physical Form, 2020-2035
  • Figure 235: South Asia & Pacific Market Volume (Units) Analysis by Physical Form, 2020-2035
  • Figure 236: South Asia & Pacific Market Value Share (%) and BPS Analysis by Physical Form, 2025-2035
  • Figure 237: South Asia & Pacific Market Y-o-Y Growth (%) Projections by Physical Form, 2025-2035
  • Figure 238: South Asia & Pacific Market Value (USD Million) Analysis by Application, 2020-2035
  • Figure 239: South Asia & Pacific Market Volume (Units) Analysis by Application, 2020-2035
  • Figure 240: South Asia & Pacific Market Value Share (%) and BPS Analysis by Application, 2025-2035
  • Figure 241: South Asia & Pacific Market Y-o-Y Growth (%) Projections by Application, 2025-2035
  • Figure 242: South Asia & Pacific Market Value (USD Million) Analysis by End Use, 2020-2035
  • Figure 243: South Asia & Pacific Market Volume (Units) Analysis by End Use, 2020-2035
  • Figure 244: South Asia & Pacific Market Value Share (%) and BPS Analysis by End Use, 2025-2035
  • Figure 245: South Asia & Pacific Market Y-o-Y Growth (%) Projections by End Use, 2025-2035
  • Figure 246: South Asia & Pacific Market Attractiveness by Mechanism, 2025-2035
  • Figure 247: South Asia & Pacific Market Attractiveness by Source, 2025-2035
  • Figure 248: South Asia & Pacific Market Attractiveness by Delivery System, 2025-2035
  • Figure 249: South Asia & Pacific Market Attractiveness by Physical Form, 2025-2035
  • Figure 250: South Asia & Pacific Market Attractiveness by Application, 2025-2035
  • Figure 251: South Asia & Pacific Market Attractiveness by End Use, 2025-2035
  • Figure 252: South Asia & Pacific Market Attractiveness by Country, 2025-2035
  • Figure 253: Middle East and Africa Market Value (USD Million) by Mechanism, 2025-2035
  • Figure 254: Middle East and Africa Market Value (USD Million) by Source, 2025-2035
  • Figure 255: Middle East and Africa Market Value (USD Million) by Delivery System, 2025-2035
  • Figure 256: Middle East and Africa Market Value (USD Million) by Physical Form, 2025-2035
  • Figure 257: Middle East and Africa Market Value (USD Million) by Application, 2025-2035
  • Figure 258: Middle East and Africa Market Value (USD Million) by End Use, 2025-2035
  • Figure 259: Middle East and Africa Market Value (USD Million) by Country, 2025-2035
  • Figure 260: Middle East and Africa Market Value (USD Million) Analysis by Country, 2020-2035
  • Figure 261: Middle East and Africa Market Volume (Units) Analysis by Country, 2020-2035
  • Figure 262: Middle East and Africa Market Value Share (%) and BPS Analysis by Country, 2025-2035
  • Figure 263: Middle East and Africa Market Y-o-Y Growth (%) Projections by Country, 2025-2035
  • Figure 264: Middle East and Africa Market Value (USD Million) Analysis by Mechanism, 2020-2035
  • Figure 265: Middle East and Africa Market Volume (Units) Analysis by Mechanism, 2020-2035
  • Figure 266: Middle East and Africa Market Value Share (%) and BPS Analysis by Mechanism, 2025-2035
  • Figure 267: Middle East and Africa Market Y-o-Y Growth (%) Projections by Mechanism, 2025-2035
  • Figure 268: Middle East and Africa Market Value (USD Million) Analysis by Source, 2020-2035
  • Figure 269: Middle East and Africa Market Volume (Units) Analysis by Source, 2020-2035
  • Figure 270: Middle East and Africa Market Value Share (%) and BPS Analysis by Source, 2025-2035
  • Figure 271: Middle East and Africa Market Y-o-Y Growth (%) Projections by Source, 2025-2035
  • Figure 272: Middle East and Africa Market Value (USD Million) Analysis by Delivery System, 2020-2035
  • Figure 273: Middle East and Africa Market Volume (Units) Analysis by Delivery System, 2020-2035
  • Figure 274: Middle East and Africa Market Value Share (%) and BPS Analysis by Delivery System, 2025-2035
  • Figure 275: Middle East and Africa Market Y-o-Y Growth (%) Projections by Delivery System, 2025-2035
  • Figure 276: Middle East and Africa Market Value (USD Million) Analysis by Physical Form, 2020-2035
  • Figure 277: Middle East and Africa Market Volume (Units) Analysis by Physical Form, 2020-2035
  • Figure 278: Middle East and Africa Market Value Share (%) and BPS Analysis by Physical Form, 2025-2035
  • Figure 279: Middle East and Africa Market Y-o-Y Growth (%) Projections by Physical Form, 2025-2035
  • Figure 280: Middle East and Africa Market Value (USD Million) Analysis by Application, 2020-2035
  • Figure 281: Middle East and Africa Market Volume (Units) Analysis by Application, 2020-2035
  • Figure 282: Middle East and Africa Market Value Share (%) and BPS Analysis by Application, 2025-2035
  • Figure 283: Middle East and Africa Market Y-o-Y Growth (%) Projections by Application, 2025-2035
  • Figure 284: Middle East and Africa Market Value (USD Million) Analysis by End Use, 2020-2035
  • Figure 285: Middle East and Africa Market Volume (Units) Analysis by End Use, 2020-2035
  • Figure 286: Middle East and Africa Market Value Share (%) and BPS Analysis by End Use, 2025-2035
  • Figure 287: Middle East and Africa Market Y-o-Y Growth (%) Projections by End Use, 2025-2035
  • Figure 288: Middle East and Africa Market Attractiveness by Mechanism, 2025-2035
  • Figure 289: Middle East and Africa Market Attractiveness by Source, 2025-2035
  • Figure 290: Middle East and Africa Market Attractiveness by Delivery System, 2025-2035
  • Figure 291: Middle East and Africa Market Attractiveness by Physical Form, 2025-2035
  • Figure 292: Middle East and Africa Market Attractiveness by Application, 2025-2035
  • Figure 293: Middle East and Africa Market Attractiveness by End Use, 2025-2035
  • Figure 294: Middle East and Africa Market Attractiveness by Country, 2025-2035

Frequently Asked Questions

How big is the Global Lightening / Whitening Agents Market in 2025?

The Global Lightening / Whitening Agents Market is estimated to be valued at USD 3,408.6 million in 2025.

What will be the size of the Global Lightening / Whitening Agents Market in 2035?

The market size for the Global Lightening / Whitening Agents Market is projected to reach USD 7,803.5 million by 2035.

How much will the Global Lightening / Whitening Agents Market grow between 2025 and 2035?

The Global Lightening / Whitening Agents Market is expected to grow at a CAGR of 8.6% between 2025 and 2035.

What are the key segments in the Global Lightening / Whitening Agents Market?

Key segments include Mechanism (Tyrosinase inhibitors, Melanin synthesis inhibitors, Exfoliating agents, and Antioxidant brighteners) and Source (Botanical, Synthetic, and Biotechnology-derived actives).

Which delivery system will contribute the most significant share in the Global Lightening / Whitening Agents Market in 2025?

The Encapsulated / sustained-release segment is expected to command a 46.2% share in the Global Lightening / Whitening Agents Market in 2025, supported by rising adoption of microencapsulation and controlled-release technologies for brightening actives.

Explore Similar Insights

Future Market Insights

Lightening Witening Agents Market

Chat With MaRIA

Chat With

MaRIA

Hi There, I am MaRIA, Your Market Research Intelligence Assistant. How may I help you?