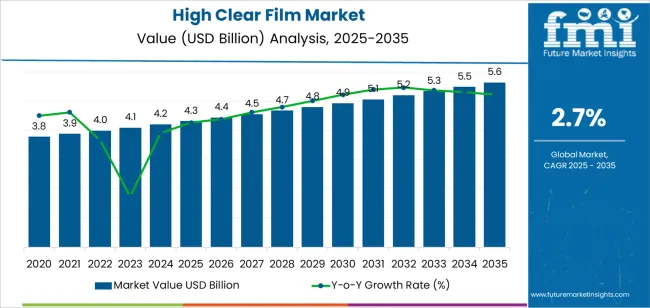
The high clear film market is expected to be valued at USD 4.2 billion by 2024 and is likely to reach USD 5.5 billion by 2034. The high clear films are predicted to rise at a sluggish CAGR of 2.7% from 2024 to 2034.
Attributes | Key Insights |
---|---|
Estimated Market Size in 2024 | USD 4.2 billion |
Projected Market Value in 2034 | USD 5.5 billion |
Value-based CAGR from 2024 to 2034 | 2.7% |
The high clear film market from 2019 to 2023 validated a growth trajectory characterized by a CAGR of 1.7%. During this period, the market witnessed several factors influencing technological advancements, evolvement of consumer preferences, and shifts in industry regulations.
The need for better optical qualities and improved product performance propelled a spike in demand from the electronics, automotive, and packaging sectors.
From 2024 to 2034, the film market is projected to experience a notable acceleration in growth, with a forecasted CAGR of 2.7%. This expected surge reflects various factors that help to shape the market landscape. The expansion of applications across diverse industries and boom in consumer awareness regarding the benefits of high-quality films.
With major advancements such as thinner and more flexible materials and enhanced sustainability features, manufacturers are thus expected to capitalize on emerging opportunities and cater to evolving customer demands.
Historical CAGR 2019 to 2023 | 1.7% |
---|---|
Forecast CAGR 2024 to 2034 | 2.7% |
The table presented showcases the top five countries based on revenue, with India occupying a significant CAGRs of the market.
Packaging and pharmaceutical industries are the main users of the high-clarity film market in India. High-clear films are essential for packaging materials because they offer superior printability, barrier qualities, and clarity for various goods.
In the pharmaceutical business, they are widely used in blister packs, strip packs, and sachet pharmaceutical packaging to guarantee product integrity and regulatory compliance.
Countries | Forecast CAGRs from 2024 to 2034 |
---|---|
The United States | 1.6% |
Canada | 1.2% |
Italy | 1.6% |
China | 4.7% |
India | 6.4% |
In the United States, high clear films are extensively used in the electronics industry. They are applied in display screens, touch panels, and optical components, enhancing the visual clarity and functionality of electronic devices such as smartphones, tablets, and televisions. High clear films improve user experience and heightened aesthetics in electronic products.
Within the automotive sector, high clear films find significant utilization in the United States. They are employed in automotive applications such as heads-up displays (HUDs), instrument panels, and window films.
These films enhance the visibility, durability, and safety features of automotive components, contributing to the overall performance and appearance of vehicles on American roads.
In Canada, the market is predominantly driven by the packaging industry. High clear films are widely used in packaging materials to enhance product visibility, protect goods from external factors such as moisture and UV radiation, and improve shelf appeal.
They find applications in food packaging, consumer goods packaging, and pharmaceutical packaging, meeting the diverse packaging requirements of Canadian industries.
High-clarity films are widely used in the Italian textile and fashion sectors. These films are used to coat clothing, shield fragile materials, and give clothes a shiny appearance.
The premium appearance and feel of fashion merchandise is enhanced by high-clarity films, which lend a touch of luxury to branded products in the Italian fashion sector.
In China, the market is characterized by its multifaceted application across various industries. High clear films are widely utilized in electronics, automotive, packaging, and construction sectors. In the electronics industry, they contribute to the visual clarity and functionality of electronic devices.
In automotive applications, they enhance the aesthetics and performance of automotive components. High clear films play a crucial role in the packaging industry, offering superior optical properties and versatility for diverse packaging needs in the rapidly growing consumer market in China.
The packaging and pharmaceutical sectors primarily drive the market in India. High clear films are extensively used in packaging materials, offering excellent clarity, barrier properties, and printability for various products.
High clear films are utilized in the pharmaceutical sector for blister packaging, strip packaging, and sachets, ensuring product integrity, tamper resistance, and compliance with regulatory standards in the Indian pharmaceutical market.
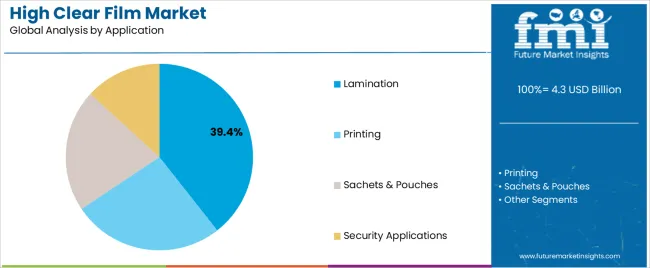
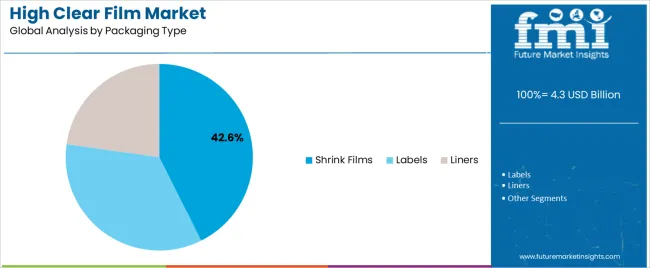
The below section shows the leading segment. Based on packaging type, the shrink films segment is accounted to hold a market share of 36.1% in 2024. Based on the application, the sachets and pouches segment is anticipated to hold a market share of 31.4% in 2024.
The enhanced display and protection that shrink films offer packaged goods drive their use. The growing need from consumers for packaging formats that are portable and easy to use is driving the growth of sachets and pouches.
Category | Market Share in 2024 |
---|---|
Shrink Films | 36.1% |
Sachets and Pouches | 31.4% |
Based on packaging type, the shrink films category is predicted to have a 36.1% market share in 2024. Because shrink films can shape themselves to fit the product when heated, they are a popular choice for safe and aesthetically pleasing packaging solutions for various items.
This segmental dominance demonstrates the industry-wide acceptance and adaptability of shrink films in the food and beverage, cosmetics, and pharmaceutical sectors.
Application-based projections indicate that the sachets and pouches segment will account for 31.4% of the market in 2024. Sachets and pouches provide practical packaging options for single-use or small products. Their mobility, simplicity of usage, and capacity to preserve food freshness make them popular.
The expansion of this market reflects the growing demand in the consumer products sectors of food, personal care, and healthcare for portable and easy-to-transport package formats.
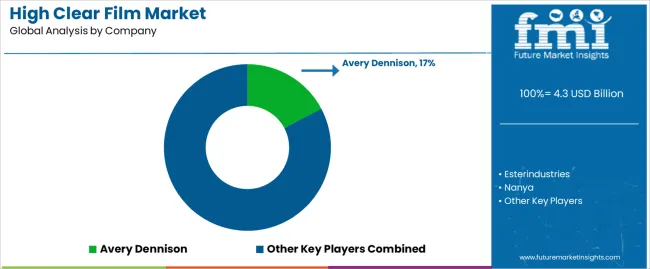
A number of significant players compete for market share worldwide in the highly competitive high clear film market structure. Regional companies are important since they provide specialized market niches and specific demand.
Generally, the market is distinguished by a blend of well-established titans and agile contenders, propelling innovation and cultivating competitiveness. Some of the key developments are:
Attributes | Details |
---|---|
Estimated Market Size in 2024 | USD 4.2 billion |
Projected Market Valuation in 2034 | USD 5.5 billion |
Value-based CAGR 2024 to 2034 | 2.7% |
Forecast Period | 2024 to 2034 |
Historical Data Available for | 2019 to 2023 |
Market Analysis | Value in USD billion |
Key Regions Covered | North America; Latin America; Western Europe; Eastern Europe; South Asia and Pacific; East Asia; The Middle East and Africa |
Key Market Segments Covered | Material, Application, Packaging Type, Region |
Key Countries Profiled | The United States, Canada, Brazil, Mexico, Germany, The United Kingdom, France, Spain, Italy, Russia, Poland, Czech Republic, Romania, India, Bangladesh, Australia, New Zealand, China, Japan, South Korea, GCC countries, South Africa, Israel |
Key Companies Profiled | Esterindustries; Nanya; Duratarps; Dehui Film; Avery Dennison; Eastman Performance Films; REEDEE Co. Ltd; Sino Vinyl; GSWF |
Table 1: Global Market Value (US$ Million) Forecast by Region, 2019 to 2034
Table 2: Global Market Volume (Tons) Forecast by Region, 2019 to 2034
Table 3: Global Market Value (US$ Million) Forecast by Material, 2019 to 2034
Table 4: Global Market Volume (Tons) Forecast by Material, 2019 to 2034
Table 5: Global Market Value (US$ Million) Forecast by Application, 2019 to 2034
Table 6: Global Market Volume (Tons) Forecast by Application, 2019 to 2034
Table 7: Global Market Value (US$ Million) Forecast by Packaging Type, 2019 to 2034
Table 8: Global Market Volume (Tons) Forecast by Packaging Type, 2019 to 2034
Table 9: North America Market Value (US$ Million) Forecast by Country, 2019 to 2034
Table 10: North America Market Volume (Tons) Forecast by Country, 2019 to 2034
Table 11: North America Market Value (US$ Million) Forecast by Material, 2019 to 2034
Table 12: North America Market Volume (Tons) Forecast by Material, 2019 to 2034
Table 13: North America Market Value (US$ Million) Forecast by Application, 2019 to 2034
Table 14: North America Market Volume (Tons) Forecast by Application, 2019 to 2034
Table 15: North America Market Value (US$ Million) Forecast by Packaging Type, 2019 to 2034
Table 16: North America Market Volume (Tons) Forecast by Packaging Type, 2019 to 2034
Table 17: Latin America Market Value (US$ Million) Forecast by Country, 2019 to 2034
Table 18: Latin America Market Volume (Tons) Forecast by Country, 2019 to 2034
Table 19: Latin America Market Value (US$ Million) Forecast by Material, 2019 to 2034
Table 20: Latin America Market Volume (Tons) Forecast by Material, 2019 to 2034
Table 21: Latin America Market Value (US$ Million) Forecast by Application, 2019 to 2034
Table 22: Latin America Market Volume (Tons) Forecast by Application, 2019 to 2034
Table 23: Latin America Market Value (US$ Million) Forecast by Packaging Type, 2019 to 2034
Table 24: Latin America Market Volume (Tons) Forecast by Packaging Type, 2019 to 2034
Table 25: Western Europe Market Value (US$ Million) Forecast by Country, 2019 to 2034
Table 26: Western Europe Market Volume (Tons) Forecast by Country, 2019 to 2034
Table 27: Western Europe Market Value (US$ Million) Forecast by Material, 2019 to 2034
Table 28: Western Europe Market Volume (Tons) Forecast by Material, 2019 to 2034
Table 29: Western Europe Market Value (US$ Million) Forecast by Application, 2019 to 2034
Table 30: Western Europe Market Volume (Tons) Forecast by Application, 2019 to 2034
Table 31: Western Europe Market Value (US$ Million) Forecast by Packaging Type, 2019 to 2034
Table 32: Western Europe Market Volume (Tons) Forecast by Packaging Type, 2019 to 2034
Table 33: Eastern Europe Market Value (US$ Million) Forecast by Country, 2019 to 2034
Table 34: Eastern Europe Market Volume (Tons) Forecast by Country, 2019 to 2034
Table 35: Eastern Europe Market Value (US$ Million) Forecast by Material, 2019 to 2034
Table 36: Eastern Europe Market Volume (Tons) Forecast by Material, 2019 to 2034
Table 37: Eastern Europe Market Value (US$ Million) Forecast by Application, 2019 to 2034
Table 38: Eastern Europe Market Volume (Tons) Forecast by Application, 2019 to 2034
Table 39: Eastern Europe Market Value (US$ Million) Forecast by Packaging Type, 2019 to 2034
Table 40: Eastern Europe Market Volume (Tons) Forecast by Packaging Type, 2019 to 2034
Table 41: South Asia and Pacific Market Value (US$ Million) Forecast by Country, 2019 to 2034
Table 42: South Asia and Pacific Market Volume (Tons) Forecast by Country, 2019 to 2034
Table 43: South Asia and Pacific Market Value (US$ Million) Forecast by Material, 2019 to 2034
Table 44: South Asia and Pacific Market Volume (Tons) Forecast by Material, 2019 to 2034
Table 45: South Asia and Pacific Market Value (US$ Million) Forecast by Application, 2019 to 2034
Table 46: South Asia and Pacific Market Volume (Tons) Forecast by Application, 2019 to 2034
Table 47: South Asia and Pacific Market Value (US$ Million) Forecast by Packaging Type, 2019 to 2034
Table 48: South Asia and Pacific Market Volume (Tons) Forecast by Packaging Type, 2019 to 2034
Table 49: East Asia Market Value (US$ Million) Forecast by Country, 2019 to 2034
Table 50: East Asia Market Volume (Tons) Forecast by Country, 2019 to 2034
Table 51: East Asia Market Value (US$ Million) Forecast by Material, 2019 to 2034
Table 52: East Asia Market Volume (Tons) Forecast by Material, 2019 to 2034
Table 53: East Asia Market Value (US$ Million) Forecast by Application, 2019 to 2034
Table 54: East Asia Market Volume (Tons) Forecast by Application, 2019 to 2034
Table 55: East Asia Market Value (US$ Million) Forecast by Packaging Type, 2019 to 2034
Table 56: East Asia Market Volume (Tons) Forecast by Packaging Type, 2019 to 2034
Table 57: Middle East and Africa Market Value (US$ Million) Forecast by Country, 2019 to 2034
Table 58: Middle East and Africa Market Volume (Tons) Forecast by Country, 2019 to 2034
Table 59: Middle East and Africa Market Value (US$ Million) Forecast by Material, 2019 to 2034
Table 60: Middle East and Africa Market Volume (Tons) Forecast by Material, 2019 to 2034
Table 61: Middle East and Africa Market Value (US$ Million) Forecast by Application, 2019 to 2034
Table 62: Middle East and Africa Market Volume (Tons) Forecast by Application, 2019 to 2034
Table 63: Middle East and Africa Market Value (US$ Million) Forecast by Packaging Type, 2019 to 2034
Table 64: Middle East and Africa Market Volume (Tons) Forecast by Packaging Type, 2019 to 2034
Figure 1: Global Market Value (US$ Million) by Material, 2024 to 2034
Figure 2: Global Market Value (US$ Million) by Application, 2024 to 2034
Figure 3: Global Market Value (US$ Million) by Packaging Type, 2024 to 2034
Figure 4: Global Market Value (US$ Million) by Region, 2024 to 2034
Figure 5: Global Market Value (US$ Million) Analysis by Region, 2019 to 2034
Figure 6: Global Market Volume (Tons) Analysis by Region, 2019 to 2034
Figure 7: Global Market Value Share (%) and BPS Analysis by Region, 2024 to 2034
Figure 8: Global Market Y-o-Y Growth (%) Projections by Region, 2024 to 2034
Figure 9: Global Market Value (US$ Million) Analysis by Material, 2019 to 2034
Figure 10: Global Market Volume (Tons) Analysis by Material, 2019 to 2034
Figure 11: Global Market Value Share (%) and BPS Analysis by Material, 2024 to 2034
Figure 12: Global Market Y-o-Y Growth (%) Projections by Material, 2024 to 2034
Figure 13: Global Market Value (US$ Million) Analysis by Application, 2019 to 2034
Figure 14: Global Market Volume (Tons) Analysis by Application, 2019 to 2034
Figure 15: Global Market Value Share (%) and BPS Analysis by Application, 2024 to 2034
Figure 16: Global Market Y-o-Y Growth (%) Projections by Application, 2024 to 2034
Figure 17: Global Market Value (US$ Million) Analysis by Packaging Type, 2019 to 2034
Figure 18: Global Market Volume (Tons) Analysis by Packaging Type, 2019 to 2034
Figure 19: Global Market Value Share (%) and BPS Analysis by Packaging Type, 2024 to 2034
Figure 20: Global Market Y-o-Y Growth (%) Projections by Packaging Type, 2024 to 2034
Figure 21: Global Market Attractiveness by Material, 2024 to 2034
Figure 22: Global Market Attractiveness by Application, 2024 to 2034
Figure 23: Global Market Attractiveness by Packaging Type, 2024 to 2034
Figure 24: Global Market Attractiveness by Region, 2024 to 2034
Figure 25: North America Market Value (US$ Million) by Material, 2024 to 2034
Figure 26: North America Market Value (US$ Million) by Application, 2024 to 2034
Figure 27: North America Market Value (US$ Million) by Packaging Type, 2024 to 2034
Figure 28: North America Market Value (US$ Million) by Country, 2024 to 2034
Figure 29: North America Market Value (US$ Million) Analysis by Country, 2019 to 2034
Figure 30: North America Market Volume (Tons) Analysis by Country, 2019 to 2034
Figure 31: North America Market Value Share (%) and BPS Analysis by Country, 2024 to 2034
Figure 32: North America Market Y-o-Y Growth (%) Projections by Country, 2024 to 2034
Figure 33: North America Market Value (US$ Million) Analysis by Material, 2019 to 2034
Figure 34: North America Market Volume (Tons) Analysis by Material, 2019 to 2034
Figure 35: North America Market Value Share (%) and BPS Analysis by Material, 2024 to 2034
Figure 36: North America Market Y-o-Y Growth (%) Projections by Material, 2024 to 2034
Figure 37: North America Market Value (US$ Million) Analysis by Application, 2019 to 2034
Figure 38: North America Market Volume (Tons) Analysis by Application, 2019 to 2034
Figure 39: North America Market Value Share (%) and BPS Analysis by Application, 2024 to 2034
Figure 40: North America Market Y-o-Y Growth (%) Projections by Application, 2024 to 2034
Figure 41: North America Market Value (US$ Million) Analysis by Packaging Type, 2019 to 2034
Figure 42: North America Market Volume (Tons) Analysis by Packaging Type, 2019 to 2034
Figure 43: North America Market Value Share (%) and BPS Analysis by Packaging Type, 2024 to 2034
Figure 44: North America Market Y-o-Y Growth (%) Projections by Packaging Type, 2024 to 2034
Figure 45: North America Market Attractiveness by Material, 2024 to 2034
Figure 46: North America Market Attractiveness by Application, 2024 to 2034
Figure 47: North America Market Attractiveness by Packaging Type, 2024 to 2034
Figure 48: North America Market Attractiveness by Country, 2024 to 2034
Figure 49: Latin America Market Value (US$ Million) by Material, 2024 to 2034
Figure 50: Latin America Market Value (US$ Million) by Application, 2024 to 2034
Figure 51: Latin America Market Value (US$ Million) by Packaging Type, 2024 to 2034
Figure 52: Latin America Market Value (US$ Million) by Country, 2024 to 2034
Figure 53: Latin America Market Value (US$ Million) Analysis by Country, 2019 to 2034
Figure 54: Latin America Market Volume (Tons) Analysis by Country, 2019 to 2034
Figure 55: Latin America Market Value Share (%) and BPS Analysis by Country, 2024 to 2034
Figure 56: Latin America Market Y-o-Y Growth (%) Projections by Country, 2024 to 2034
Figure 57: Latin America Market Value (US$ Million) Analysis by Material, 2019 to 2034
Figure 58: Latin America Market Volume (Tons) Analysis by Material, 2019 to 2034
Figure 59: Latin America Market Value Share (%) and BPS Analysis by Material, 2024 to 2034
Figure 60: Latin America Market Y-o-Y Growth (%) Projections by Material, 2024 to 2034
Figure 61: Latin America Market Value (US$ Million) Analysis by Application, 2019 to 2034
Figure 62: Latin America Market Volume (Tons) Analysis by Application, 2019 to 2034
Figure 63: Latin America Market Value Share (%) and BPS Analysis by Application, 2024 to 2034
Figure 64: Latin America Market Y-o-Y Growth (%) Projections by Application, 2024 to 2034
Figure 65: Latin America Market Value (US$ Million) Analysis by Packaging Type, 2019 to 2034
Figure 66: Latin America Market Volume (Tons) Analysis by Packaging Type, 2019 to 2034
Figure 67: Latin America Market Value Share (%) and BPS Analysis by Packaging Type, 2024 to 2034
Figure 68: Latin America Market Y-o-Y Growth (%) Projections by Packaging Type, 2024 to 2034
Figure 69: Latin America Market Attractiveness by Material, 2024 to 2034
Figure 70: Latin America Market Attractiveness by Application, 2024 to 2034
Figure 71: Latin America Market Attractiveness by Packaging Type, 2024 to 2034
Figure 72: Latin America Market Attractiveness by Country, 2024 to 2034
Figure 73: Western Europe Market Value (US$ Million) by Material, 2024 to 2034
Figure 74: Western Europe Market Value (US$ Million) by Application, 2024 to 2034
Figure 75: Western Europe Market Value (US$ Million) by Packaging Type, 2024 to 2034
Figure 76: Western Europe Market Value (US$ Million) by Country, 2024 to 2034
Figure 77: Western Europe Market Value (US$ Million) Analysis by Country, 2019 to 2034
Figure 78: Western Europe Market Volume (Tons) Analysis by Country, 2019 to 2034
Figure 79: Western Europe Market Value Share (%) and BPS Analysis by Country, 2024 to 2034
Figure 80: Western Europe Market Y-o-Y Growth (%) Projections by Country, 2024 to 2034
Figure 81: Western Europe Market Value (US$ Million) Analysis by Material, 2019 to 2034
Figure 82: Western Europe Market Volume (Tons) Analysis by Material, 2019 to 2034
Figure 83: Western Europe Market Value Share (%) and BPS Analysis by Material, 2024 to 2034
Figure 84: Western Europe Market Y-o-Y Growth (%) Projections by Material, 2024 to 2034
Figure 85: Western Europe Market Value (US$ Million) Analysis by Application, 2019 to 2034
Figure 86: Western Europe Market Volume (Tons) Analysis by Application, 2019 to 2034
Figure 87: Western Europe Market Value Share (%) and BPS Analysis by Application, 2024 to 2034
Figure 88: Western Europe Market Y-o-Y Growth (%) Projections by Application, 2024 to 2034
Figure 89: Western Europe Market Value (US$ Million) Analysis by Packaging Type, 2019 to 2034
Figure 90: Western Europe Market Volume (Tons) Analysis by Packaging Type, 2019 to 2034
Figure 91: Western Europe Market Value Share (%) and BPS Analysis by Packaging Type, 2024 to 2034
Figure 92: Western Europe Market Y-o-Y Growth (%) Projections by Packaging Type, 2024 to 2034
Figure 93: Western Europe Market Attractiveness by Material, 2024 to 2034
Figure 94: Western Europe Market Attractiveness by Application, 2024 to 2034
Figure 95: Western Europe Market Attractiveness by Packaging Type, 2024 to 2034
Figure 96: Western Europe Market Attractiveness by Country, 2024 to 2034
Figure 97: Eastern Europe Market Value (US$ Million) by Material, 2024 to 2034
Figure 98: Eastern Europe Market Value (US$ Million) by Application, 2024 to 2034
Figure 99: Eastern Europe Market Value (US$ Million) by Packaging Type, 2024 to 2034
Figure 100: Eastern Europe Market Value (US$ Million) by Country, 2024 to 2034
Figure 101: Eastern Europe Market Value (US$ Million) Analysis by Country, 2019 to 2034
Figure 102: Eastern Europe Market Volume (Tons) Analysis by Country, 2019 to 2034
Figure 103: Eastern Europe Market Value Share (%) and BPS Analysis by Country, 2024 to 2034
Figure 104: Eastern Europe Market Y-o-Y Growth (%) Projections by Country, 2024 to 2034
Figure 105: Eastern Europe Market Value (US$ Million) Analysis by Material, 2019 to 2034
Figure 106: Eastern Europe Market Volume (Tons) Analysis by Material, 2019 to 2034
Figure 107: Eastern Europe Market Value Share (%) and BPS Analysis by Material, 2024 to 2034
Figure 108: Eastern Europe Market Y-o-Y Growth (%) Projections by Material, 2024 to 2034
Figure 109: Eastern Europe Market Value (US$ Million) Analysis by Application, 2019 to 2034
Figure 110: Eastern Europe Market Volume (Tons) Analysis by Application, 2019 to 2034
Figure 111: Eastern Europe Market Value Share (%) and BPS Analysis by Application, 2024 to 2034
Figure 112: Eastern Europe Market Y-o-Y Growth (%) Projections by Application, 2024 to 2034
Figure 113: Eastern Europe Market Value (US$ Million) Analysis by Packaging Type, 2019 to 2034
Figure 114: Eastern Europe Market Volume (Tons) Analysis by Packaging Type, 2019 to 2034
Figure 115: Eastern Europe Market Value Share (%) and BPS Analysis by Packaging Type, 2024 to 2034
Figure 116: Eastern Europe Market Y-o-Y Growth (%) Projections by Packaging Type, 2024 to 2034
Figure 117: Eastern Europe Market Attractiveness by Material, 2024 to 2034
Figure 118: Eastern Europe Market Attractiveness by Application, 2024 to 2034
Figure 119: Eastern Europe Market Attractiveness by Packaging Type, 2024 to 2034
Figure 120: Eastern Europe Market Attractiveness by Country, 2024 to 2034
Figure 121: South Asia and Pacific Market Value (US$ Million) by Material, 2024 to 2034
Figure 122: South Asia and Pacific Market Value (US$ Million) by Application, 2024 to 2034
Figure 123: South Asia and Pacific Market Value (US$ Million) by Packaging Type, 2024 to 2034
Figure 124: South Asia and Pacific Market Value (US$ Million) by Country, 2024 to 2034
Figure 125: South Asia and Pacific Market Value (US$ Million) Analysis by Country, 2019 to 2034
Figure 126: South Asia and Pacific Market Volume (Tons) Analysis by Country, 2019 to 2034
Figure 127: South Asia and Pacific Market Value Share (%) and BPS Analysis by Country, 2024 to 2034
Figure 128: South Asia and Pacific Market Y-o-Y Growth (%) Projections by Country, 2024 to 2034
Figure 129: South Asia and Pacific Market Value (US$ Million) Analysis by Material, 2019 to 2034
Figure 130: South Asia and Pacific Market Volume (Tons) Analysis by Material, 2019 to 2034
Figure 131: South Asia and Pacific Market Value Share (%) and BPS Analysis by Material, 2024 to 2034
Figure 132: South Asia and Pacific Market Y-o-Y Growth (%) Projections by Material, 2024 to 2034
Figure 133: South Asia and Pacific Market Value (US$ Million) Analysis by Application, 2019 to 2034
Figure 134: South Asia and Pacific Market Volume (Tons) Analysis by Application, 2019 to 2034
Figure 135: South Asia and Pacific Market Value Share (%) and BPS Analysis by Application, 2024 to 2034
Figure 136: South Asia and Pacific Market Y-o-Y Growth (%) Projections by Application, 2024 to 2034
Figure 137: South Asia and Pacific Market Value (US$ Million) Analysis by Packaging Type, 2019 to 2034
Figure 138: South Asia and Pacific Market Volume (Tons) Analysis by Packaging Type, 2019 to 2034
Figure 139: South Asia and Pacific Market Value Share (%) and BPS Analysis by Packaging Type, 2024 to 2034
Figure 140: South Asia and Pacific Market Y-o-Y Growth (%) Projections by Packaging Type, 2024 to 2034
Figure 141: South Asia and Pacific Market Attractiveness by Material, 2024 to 2034
Figure 142: South Asia and Pacific Market Attractiveness by Application, 2024 to 2034
Figure 143: South Asia and Pacific Market Attractiveness by Packaging Type, 2024 to 2034
Figure 144: South Asia and Pacific Market Attractiveness by Country, 2024 to 2034
Figure 145: East Asia Market Value (US$ Million) by Material, 2024 to 2034
Figure 146: East Asia Market Value (US$ Million) by Application, 2024 to 2034
Figure 147: East Asia Market Value (US$ Million) by Packaging Type, 2024 to 2034
Figure 148: East Asia Market Value (US$ Million) by Country, 2024 to 2034
Figure 149: East Asia Market Value (US$ Million) Analysis by Country, 2019 to 2034
Figure 150: East Asia Market Volume (Tons) Analysis by Country, 2019 to 2034
Figure 151: East Asia Market Value Share (%) and BPS Analysis by Country, 2024 to 2034
Figure 152: East Asia Market Y-o-Y Growth (%) Projections by Country, 2024 to 2034
Figure 153: East Asia Market Value (US$ Million) Analysis by Material, 2019 to 2034
Figure 154: East Asia Market Volume (Tons) Analysis by Material, 2019 to 2034
Figure 155: East Asia Market Value Share (%) and BPS Analysis by Material, 2024 to 2034
Figure 156: East Asia Market Y-o-Y Growth (%) Projections by Material, 2024 to 2034
Figure 157: East Asia Market Value (US$ Million) Analysis by Application, 2019 to 2034
Figure 158: East Asia Market Volume (Tons) Analysis by Application, 2019 to 2034
Figure 159: East Asia Market Value Share (%) and BPS Analysis by Application, 2024 to 2034
Figure 160: East Asia Market Y-o-Y Growth (%) Projections by Application, 2024 to 2034
Figure 161: East Asia Market Value (US$ Million) Analysis by Packaging Type, 2019 to 2034
Figure 162: East Asia Market Volume (Tons) Analysis by Packaging Type, 2019 to 2034
Figure 163: East Asia Market Value Share (%) and BPS Analysis by Packaging Type, 2024 to 2034
Figure 164: East Asia Market Y-o-Y Growth (%) Projections by Packaging Type, 2024 to 2034
Figure 165: East Asia Market Attractiveness by Material, 2024 to 2034
Figure 166: East Asia Market Attractiveness by Application, 2024 to 2034
Figure 167: East Asia Market Attractiveness by Packaging Type, 2024 to 2034
Figure 168: East Asia Market Attractiveness by Country, 2024 to 2034
Figure 169: Middle East and Africa Market Value (US$ Million) by Material, 2024 to 2034
Figure 170: Middle East and Africa Market Value (US$ Million) by Application, 2024 to 2034
Figure 171: Middle East and Africa Market Value (US$ Million) by Packaging Type, 2024 to 2034
Figure 172: Middle East and Africa Market Value (US$ Million) by Country, 2024 to 2034
Figure 173: Middle East and Africa Market Value (US$ Million) Analysis by Country, 2019 to 2034
Figure 174: Middle East and Africa Market Volume (Tons) Analysis by Country, 2019 to 2034
Figure 175: Middle East and Africa Market Value Share (%) and BPS Analysis by Country, 2024 to 2034
Figure 176: Middle East and Africa Market Y-o-Y Growth (%) Projections by Country, 2024 to 2034
Figure 177: Middle East and Africa Market Value (US$ Million) Analysis by Material, 2019 to 2034
Figure 178: Middle East and Africa Market Volume (Tons) Analysis by Material, 2019 to 2034
Figure 179: Middle East and Africa Market Value Share (%) and BPS Analysis by Material, 2024 to 2034
Figure 180: Middle East and Africa Market Y-o-Y Growth (%) Projections by Material, 2024 to 2034
Figure 181: Middle East and Africa Market Value (US$ Million) Analysis by Application, 2019 to 2034
Figure 182: Middle East and Africa Market Volume (Tons) Analysis by Application, 2019 to 2034
Figure 183: Middle East and Africa Market Value Share (%) and BPS Analysis by Application, 2024 to 2034
Figure 184: Middle East and Africa Market Y-o-Y Growth (%) Projections by Application, 2024 to 2034
Figure 185: Middle East and Africa Market Value (US$ Million) Analysis by Packaging Type, 2019 to 2034
Figure 186: Middle East and Africa Market Volume (Tons) Analysis by Packaging Type, 2019 to 2034
Figure 187: Middle East and Africa Market Value Share (%) and BPS Analysis by Packaging Type, 2024 to 2034
Figure 188: Middle East and Africa Market Y-o-Y Growth (%) Projections by Packaging Type, 2024 to 2034
Figure 189: Middle East and Africa Market Attractiveness by Material, 2024 to 2034
Figure 190: Middle East and Africa Market Attractiveness by Application, 2024 to 2034
Figure 191: Middle East and Africa Market Attractiveness by Packaging Type, 2024 to 2034
Figure 192: Middle East and Africa Market Attractiveness by Country, 2024 to 2034
As of 2024, the market for high clear film is expected to be valued at USD 4.2 billion.
By 2034, the market value of the high clear film is expected to reach USD 5.5 billion.
From 2024 to 2034, the high clear film market is expected to flourish at a CAGR of 2.7%
The shrink films segment is accounted to hold a market share of 36.1% in 2024.
India is likely the top-performing market, with a CAGR of 6.4%.
Explore Similar Insights
Thank you!
You will receive an email from our Business Development Manager. Please be sure to check your SPAM/JUNK folder too.