Head-Up Display Market
Safety Concerns are rising demand for Head-up Display Market as the automotive sector further expands. FMI provides data-driven insights into Heads-Up Display and technologies for 30+ Countries.
Head-Up Display Market by Component, Technology, Application, Type & Region – Forecast 2023–2033
Head-Up Display Market Outlook
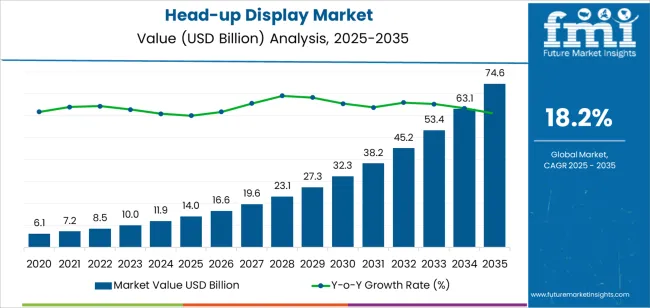
The head-up display market size is projected to be valued at US$ 8.6 Bn in 2023 and is expected to rise to US$ 46.0 Bn by 2033. The sales of head-up display are expected to grow at a significant CAGR of 18.3% over the forecast period. Various factors propelling the demand for head-up display are:
- In the automotive industry, digitalization is a major trend. Over the last few decades, the industry has seen numerous technological advancements in the digital field. One such example is the technological advancement of HUD.
- One of the key elements influencing the adoption of HUD in the automotive sector is the escalating demand for safety and user comfort. Moreover, the necessity for HUD is being fueled by the rise of traffic accidents. For instance, the World Health Organization estimates that over 1.35 million individuals worldwide die every year as a result of traffic accidents.
- Luxury vehicle manufacturers such as Audi, BMW, Porsche, Land Rover, and Mercedes-Benz, among others, offer a HUD system as a standard or optional add-on feature. Nevertheless, Automakers have been thinking about making them standard, even in low-cost or budget vehicles.
- Furthermore, the use of AR has made HUD an important component of Advanced Driver Assistance Systems (ADAS). Over the next decade, OEMs are expected to incorporate more ADAS applications into their vehicles.
Attributes |
Details |
Head-Up Display Market CAGR |
18.3% |
Head-Up Display Market Valuation (2023) |
US$ 8.6 Bn |
Head-Up Display Market Valuation (2033) |
US$ 46.0 Bn |
Let us know your requirement to get
100% FREE customization
How The Market Progressed till June 2022?
Market Statistics |
Details |
H1,2021 (A) |
20.5% |
H1,2022 Projected (P) |
21.3% |
H1,2022 Outlook (O) |
22.5% |
BPS Change: H1,2022 (O) - H1,2022 (P) |
(+) 120 ↑ |
BPS Change: H1,2022 (O) - H1,2021 (A) |
(+) 200 ↑ |
As per Future Market Insights, the increase in awareness about vehicle safety and also advancements in technology like AR-based head-up displays which help to make driving comfortable and safe by displaying real-time traffic condition to the driver is helping to boost the head-up display market growth.
According to the FMI analysis, the BPS values analyzed in the head-up display market in H1,2022 (O) - H1,2022 (P) are projected to witness a spike of around 120 units. The increase in demand for electric vehicles and semi-autonomous vehicles across the globe is accelerating the demand for head-up displays.
The BPS change for the assessment period H1, 2022 (O) - H1,2021 (A) has witnessed an increase of 200 units. This growth is driven by the rising customer demands for luxury and premium cars that are outfitted with cutting-edge display and safety features, such as head-up display systems.
Head-Up Display Market Outlook 2017-2022 in Comparison to 2023-2033 Growth Forecast
The global head-up display has witnessed an absolute dollar growth of US$ 37.4 billion in comparison to 2017-2022 with a whooping CAGR of 18.3% by 2033.
Sales of semi-autonomous and electric vehicles have increased considerably in recent years. Semi-autonomous vehicles can sense the environment and help drivers navigate through potential hazards by using voice commands.
These vehicles are equipped with features such as collision avoidance, park assist, and cruise control to offer optimal security and convenience to the drive. Growing demand and sales of semi-autonomous vehicles are expected to boost the market for HUDs.
In the aviation sector, HUDs are primarily used as information displayers in large aircraft including civil aviation and military/defense aviation. Most commercial aircraft are equipped with advanced HUDs, enabling pilots to receive and access critical information without looking away from the windscreen.
Ongoing investments in the military and defense sector to deploy technologically advanced systems will continue enabling sales in this sector. Demand in North America and Europe is expected to remain high as manufacturers are aiming to enhance aircraft visibility. Besides this, the growing replacement rate of older HUDs with new and advanced systems in fighter jets will continue boosting the market over the assessment period.
Find your sweet spots for generating winning opportunities in this market.
Talk to AnalystHow Will the Integration of Connective Technology Influence Head-Up Display Sales?
Augmented reality (AR) is a developing area of technology, which is attracting interest in its ability to overlay digital objects in the surroundings at the consumer’s disposal. To improve the safety features and visibility in autonomous vehicles, manufacturers are getting inclined towards the integration of augmented reality (AR) and artificial intelligence (AI) in HUDs.
When combined with existing holographic HUDs, AR potentially enhances functionality by overlaying navigation indications and other obstacles with color-coded strips and other indicative features.
As automakers strive to create a better driving experience, the integration of AR in HUDs is likely to gain traction in the forthcoming years. Growing awareness regarding advanced safety features and control modules in cars is also expected to boost this trend, and more manufacturers are expected to adopt this technology as installation costs fall.
For instance, Volvo has invested in Spectralics, an Israel-based tech firm to offer a highly advanced display solution by transforming the entire windshield into a dynamic display. Spectralics' technology works by overlaying the windshield with a thin film known as a multi-layer thin combiner.
This turns the entire windshield into a transparent display, allowing Volvo to show graphics and other visual elements by using AR. Such developments are expected to continue pushing sales of HUDs in the forthcoming years, opines FMI.
Will the Penetration of Head-Up Displays in Military and Defense Boost the Market?
Growing investments in the military and defense sector in various countries are propelling the adoption of smart and advanced HUDs in aircraft, thereby fueling sales in the market. Proper visibility, effective control, and timely indication of danger or hazards are optimal for pilots operating fighter jets and official airplanes. This is encouraging manufacturers to launch advanced HUDs for the military and defense sectors.
As per statistics availed by the Stockholm International Peace Research Institute, world military spending rose to 2 trillion in 2020. In the same year, the U.S. military expenditure recorded an uptick by 4.4% over 2019. These investments are enabling countries to deploy effective safety and control measures in defense vehicles and aircraft, which is expected to bode well for the market.
Further, in October 2021, the Government of India cleared projects worth US$ 7.21 Bn to enhance the military capabilities with locally produced systems and weapons, including tanks, helicopters, transport plans, and warning systems. This is expected to create a conducive environment for the growth of the market over the forecast period.

A unified Market Research Subscription Platform, built for today's disparate research needs.
Comparative view of Head-Up Display Market
Head-Up Display Market:
Attributes |
Head-Up Display Market |
CAGR (2022-2032) |
18.3% |
Market Value (2026) |
US$ 14.24 Bn |
Growth Factor |
One of the key elements influencing the adoption of HUD in the automotive sector is the escalating demand for safety and user comfort. |
Opportunity |
Growing awareness regarding advanced safety features and control modules in cars is also expected to boost this trend, and more manufacturers are expected to adopt this technology as installation costs fall. |
Automotive Display Units Market:
Attributes |
Automotive Display Units Market |
CAGR (2022-2032) |
6.2% |
Market Value (2026) |
US$ 19,853.62 Mn |
Growth Factor |
The market for automotive display units is going to be driven by the rising demand for passenger automobiles on the global market. |
Opportunity |
The demand for display technology, such as TFT-LCD and OLED display panels, which are used to display 4K videos and the electronic rear-view mirror, is likely to increase, leading to further market growth. |
Head Mounted Display Market:
Attributes |
Head Mounted Display Market |
CAGR (2022-2032) |
16.1% |
Market Value (2026) |
US$ 79.32 Bn |
Growth Factor |
The game industry's increasing requirement for augmented reality/virtual reality (AR/VR) technology is supporting the demand for head-mounted displays and other solutions. |
Opportunity |
To improve the user experience for their AR/VR technologies, various technology providers are creating advanced head mounted displays. These considerations will certainly lead to a rise in the demand for helmet mounted displays. |
Head-Up Display Market - Country-wise Insight
“U.S. to witness an absolute dollar growth of US$ 13.5 Bn from 2023-2033”
As per FMI, sales in the U.S. market are projected to grow at a stupendous 18.1% CAGR through 2033 and obtain a market share of US$ 16.6 Bn by 2033. Ongoing investments in the military and defense sector are spurring demand in the market, which is expected to continue pushing sales in the forthcoming years.
In addition to this, the U.S. is one of the biggest automotive hubs in the world. The presence of leading automakers such as General Motors, Chevrolet, Tesla and Cadillac, and Buick, and various OEMs is expected to boost the market.
US Market Size (US$Mn/Bn) by End of Forecast Period (2033) |
US$ 16.6 Bn |
US Market Absolute Dollar Growth (US$ Mn/Bn) |
US$ 13.5 Bn |
CAGR % 2017 to 2022 |
23.5% |
CAGR % 2023 to End of Forecast (2033) |
18.1% |
Besides this, increasing demand for advanced safety features in semi-autonomous and commercial vehicles in the country is anticipated to push sales over the forecast period.
“U.K. to contribute US$ 1.9 Bn by 2033”
Increasing adoption of advanced technological systems in the automotive sector in the U.K. is placing it as an attractive pocket in the Europe market. As per the report, demand in the U.K. head-up display market is projected to increase at a 17.3% CAGR over the assessment period.
Consumers are widely preferring vehicles with advanced safety features and driver assistance systems to improve their on-road experience. In response to this, various carmakers in the U.K. are investing in research and development to improve their product offerings.
For instance, U.K.-based start-up Envisics raised US$ 500 million in Series B funding to improve the holographic technology for HUDs in the automotive sector. In addition to this, automotive giant Mercedes Benz has recently announced that it will be the first automaker to include AR HUD in its 2021 S-Class series.
UK Market Size (US$Mn/Bn) by End of Forecast Period (2033) |
US$ 1.9 Bn |
UK Market Absolute Dollar Growth (US$ Mn/Bn) |
US$ 1.5 Bn |
CAGR % 2017 to 2022 |
21.5% |
CAGR % 2023 to End of Forecast (2033) |
17.3% |
Will the China Head-Up Display Market Continue Witnessing High Demand?
China is projected to account for a dominant share in the East Asia head-up display market. Sales in the country are forecast to grow at 17.9% and hold a revenue share of 3.3Bn by 2033.
Growing investments in the defense and military sector in China will continue boosting the market. These investments are enabling the deployment of technologically advanced navigation and control systems in defense aircraft and commercial jets, resulting in higher sales.
Besides this, increasing sales of semi-autonomous vehicles favored by rising disposable income, coupled with increasing investments in the automotive sector will continue fueling the growth of the market over the forecast period. Besides this, increasing sales of semi-autonomous vehicles favored by rising disposable income, coupled with increasing investments in the automotive sector will continue fueling the growth of the market over the forecast period.
China Market Size (US$Mn/Bn) by End of Forecast Period (2033) |
US$ 3.3 Bn |
China Market Absolute Dollar Growth (US$ Mn/Bn) |
US$ 2.7 Bn |
CAGR % 2017 to 2022 |
23.0% |
CAGR % 2023 to End of Forecast (2033) |
17.9% |
“Hyundai to drive South Korea market”
The company wants to sell its HUD products through agreements with major automakers throughout the world and develop HUD into a significant export good. Hyundai Motor Co.'s independent Genesis brand recently introduced the GV80, a luxury sport utility vehicle, and Hyundai Mobis began supplying their 12-inch windshield HUD for it. According to the release, the GV80 is the first vehicle with Hyundai Mobis' larger windshield HUD.
South Korea Market Size (US$Mn/Bn) by End of Forecast Period (2033) |
US$ 1.5 Bn |
South Korea Market Absolute Dollar Growth (US$ Mn/Bn) |
US$ 1.2 Bn |
CAGR % 2017 to 2022 |
18.1% |
CAGR % 2023 to End of Forecast (2033) |
16.3% |
Head-Up Display Market - Category-wise Insights
Which is the Dominant Component Type?
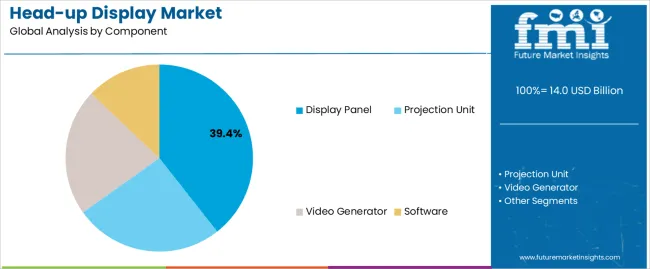
The component with the biggest sales volume in 2022 was the projection unit, which generated US$ 891.6 million in revenue. This is due to its great degree of transparency and eco-friendliness. During the forecast period, the market is expected to have a CAGR of about 17.6%. A processed image is displayed via the display unit on the combiner or the windshield of the car. Additionally, compared to LEDs and LCDs, this technology is more effective and environmentally sustainable.
Why is Demand for Cathode Ray Tube (CRT) Rising?
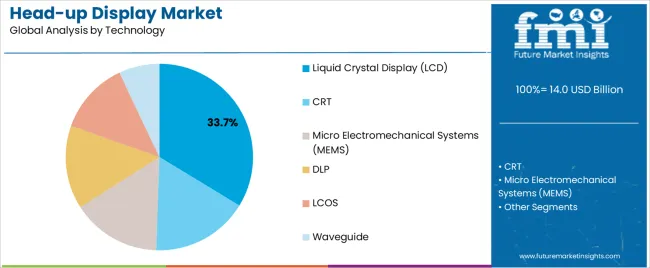
It is commonly known that CRT technology has advantages over contemporary flat screens due to this it would gradually grow with a rate of 17.1% by 2033. In contrast to LCDs, which use a set pixel grid to work, CRTs use three "guns" to guide light onto the tube. As a result, there is no upscaling blur and no requirement to run at a particular native resolution. Due to its straightforward operating principle, this sort of HUD is also the most popular one among after-market HUD accessories. Some of these devices even use a smartphone and an app to generate the reflection.
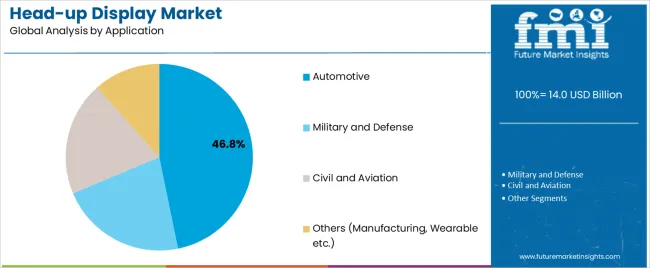
“Automotive segment is anticipated to grow at 24.2% through 2023-2033“
Applications of HUDs in the automotive sector are anticipated to gain momentum over the forecast period. Leading carmakers are deploying advanced HUDs in premium and exclusive vehicle ranges to improve the driving experience.
In response to the growing demand, manufacturers are also deploying HUDs in luxury cars and commercial vehicles to improve sales. OEMs are launching cost-effective HUD models to enable their deployment in electric and passenger vehicles to make them affordable for consumers in developing regions. This will also enable manufacturers to integrate HUDs in inexpensive car models, further fueling the growth of the market.
Why are Windshield Head-Up Displays Highly Sought-After?
As per FMI, the windshield HUDs segment is projected to expand at a considerable pace in the forthcoming years. Windshield HUDs show relevant information directly on the screen of the windshield, enabling the driver to access this information in the line of sight. In case of special events, the driver is warned about collisions and hazards without causing any distractions.
These systems are offered as a standard feature in luxury cars and premium car models. However, manufacturers are developing cost-effective system variants to enable their deployment in mid-variant vehicles and commercial vehicles. Against this backdrop, demand for windshield HUDs is expected to gain traction over the forecast period.
Competitive Landscape
Leading companies in the worldwide head-up display market are concentrating on research and development to incorporate connective technologies like augmented reality and artificial intelligence (AI) (AR). Players want to diversify their product portfolios with this. In order to obtain a competitive edge in the market, firms are also engaging in mergers, acquisitions, and collaborations.
- In January 2022, CY Vision introduced 3D augmented reality head-up displays for automobiles. (3D AR-HUD). It offers the broadest field of view in augmented displays now available for all kinds of weather and distances.
- In September 2021, For its A320 family of aircraft, Airbus is creating a newly improved flight vision system (EFVS). The sophisticated vision sensor needed to create head-up displays will be provided by Collins Aerospace. The sensor, a system of many specialty cameras, a head-up display (HUD), and cockpit controls make up the EFVS now under development.
- June 2021 - Hyundai Mobis, a component branch of the South Korean carmaker, has developed a clusterless head-up display for both gas- and electricity-powered vehicles. A 15-inch screen is used to display information, which enhances the efficient use of interior space. The cutting-edge device includes four distinct display regions. At the top, the driver has access to fundamental information including speed, RPM, information on an advanced driver support system, and route direction. The bottom displays details including mileage, cooling water temperature, and shift mode. Additionally, turn signals and system information warning lights are displayed.
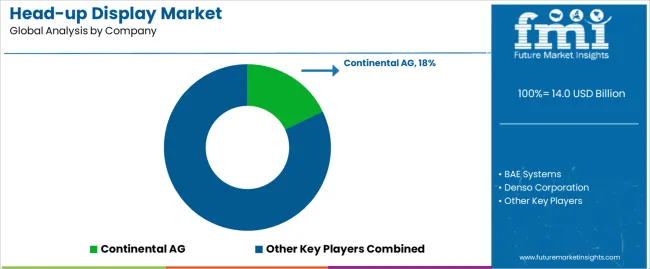
Some of the leading companies operating in the Head-Up Display Market are
- BAE Systems
- Continental AG
- Denso Corporation
- Honeywell Aerospace
- Microvision, Inc.
- Nippon Seiki Co., Ltd.
- Panasonic Automotive Systems
- Pioneer Corporation
- Robert Bosch
- Rockwell Collins
- Saab
- Thales Group
- Visteon Corporation
- Yazaki Corporation
Scope of Report
Attribute |
Details |
Forecast Period |
2023-2033 |
Historical Data Available for |
2018-2022 |
Market Analysis |
US$ Bn for Value |
Key Countries Covered |
US, Canada, Germany, U.K., France, Italy, Spain, Russia, China, Japan, South Korea, India, Thailand, Malaysia, Indonesia, Australia, New Zealand, GCC Countries, Turkey, Northern Africa, and South Africa |
Key Segments Covered |
|
Key Companies Profiled |
|
Report Coverage |
Market Forecast, Company Share Analysis, Competition Intelligence, DROT Analysis, Market Dynamics and Challenges, and Strategic Growth Initiatives |
Customization & Pricing |
Available upon Request |
Head-Up Display Market by Category
Head-Up Display Market Component:
- Projection Unit
- Video Generator
- Display Panel
- Software
Technology:
- CRT
- Micro Electromechanical Systems (MEMS)
- Liquid Crystal Display (LCD)
- DLP
- LCOS
- Waveguide
Application:
- Military and Defense
- Civil and Aviation
- Automotive
- Others (Manufacturing, Wearable etc.)
Type:
- Windshield
- Combiner
- Head-Mounted
By Region:
- North America
- Latin America
- Europe
- South Asia & Pacific
- East Asia
- Middle East & Africa (MEA)
Frequently Asked Questions
The Head-Up Display market is predicted to grow at 18.3% CAGR through 2023-2033.
Rapidly expanding automotive industry
The Head-Up Display market is expected to surpass US$ 46.0 Bn by 2033.
The Head-Up Display market size is anticipated to be US$ 8.6 Bn in 2023.
Table of Content
1. Executive Summary
1.1. Global Market Outlook
1.2. Demand-side Trends
1.3. Supply-side Trends
1.4. Technology Roadmap Analysis
1.5. Analysis and Recommendations
2. Market Overview
2.1. Market Coverage / Taxonomy
2.2. Market Definition / Scope / Limitations
3. Market Background
3.1. Market Dynamics
3.1.1. Drivers
3.1.2. Restraints
3.1.3. Opportunity
3.1.4. Trends
3.2. Scenario Forecast
3.2.1. Demand in Optimistic Scenario
3.2.2. Demand in Likely Scenario
3.2.3. Demand in Conservative Scenario
3.3. Opportunity Map Analysis
3.4. Investment Feasibility Matrix
3.5. PESTLE and Porter’s Analysis
3.6. Regulatory Landscape
3.6.1. By Key Regions
3.6.2. By Key Countries
3.7. Regional Parent Market Outlook
4. Global Market Analysis 2017-2022 and Forecast, 2023-2033
4.1. Historical Market Size Value (US$ Mn) Analysis, 2017-2022
4.2. Current and Future Market Size Value (US$ Mn) Projections, 2023-2033
4.2.1. Y-o-Y Growth Trend Analysis
4.2.2. Absolute $ Opportunity Analysis
5. Global Market Analysis 2017-2022 and Forecast 2023-2033, By Component
5.1. Introduction / Key Findings
5.2. Historical Market Size Value (US$ Mn) Analysis By Component, 2017-2022
5.3. Current and Future Market Size Value (US$ Mn) Analysis and Forecast By Component, 2023-2033
5.3.1. Projection Value (US$ Mn)
5.3.2. Video Generator
5.3.3. Display Panel
5.3.4. Software
5.4. Y-o-Y Growth Trend Analysis By Component, 2017-2022
5.5. Absolute $ Opportunity Analysis By Component, 2023-2033
6. Global Market Analysis 2017-2022 and Forecast 2023-2033, By Technology
6.1. Introduction / Key Findings
6.2. Historical Market Size Value (US$ Mn) Analysis By Technology, 2017-2022
6.3. Current and Future Market Size Value (US$ Mn) Analysis and Forecast By Technology, 2023-2033
6.3.1. CRT
6.3.2. Micro Electromechanical Systems
6.3.3. Liquid Crystal Display
6.3.4. DLP
6.3.5. LCOS
6.3.6. Waveguide
6.4. Y-o-Y Growth Trend Analysis By Technology, 2017-2022
6.5. Absolute $ Opportunity Analysis By Technology, 2023-2033
7. Global Market Analysis 2017-2022 and Forecast 2023-2033, By Application
7.1. Introduction / Key Findings
7.2. Historical Market Size Value (US$ Mn) Analysis By Application , 2017-2022
7.3. Current and Future Market Size Value (US$ Mn) Analysis and Forecast By Application , 2023-2033
7.3.1. Military and Defense
7.3.2. Civil and Aviation
7.3.3. Automotive
7.3.4. Others
7.4. Y-o-Y Growth Trend Analysis By Application , 2017-2022
7.5. Absolute $ Opportunity Analysis By Application , 2023-2033
8. Global Market Analysis 2017-2022 and Forecast 2023-2033, By Type
8.1. Introduction / Key Findings
8.2. Historical Market Size Value (US$ Mn) Analysis By Type, 2017-2022
8.3. Current and Future Market Size Value (US$ Mn) Analysis and Forecast By Type, 2023-2033
8.3.1. Windshield
8.3.2. Combiner
8.3.3. Head-Mounted
8.4. Y-o-Y Growth Trend Analysis By Type, 2017-2022
8.5. Absolute $ Opportunity Analysis By Type, 2023-2033
9. Global Market Analysis 2017-2022 and Forecast 2023-2033, By Region
9.1. Introduction
9.2. Historical Market Size Value (US$ Mn) Analysis By Region, 2017-2022
9.3. Current Market Size Value (US$ Mn) Analysis and Forecast By Region, 2023-2033
9.3.1. North America
9.3.2. Latin America
9.3.3. Europe
9.3.4. East Asia
9.3.5. South Asia
9.3.6. Oceania
9.3.7. MEA
9.4. Market Attractiveness Analysis By Region
10. North America Market Analysis 2017-2022 and Forecast 2023-2033, By Country
10.1. Historical Market Size Value (US$ Mn) Trend Analysis By Market Taxonomy, 2017-2022
10.2. Market Size Value (US$ Mn) Forecast By Market Taxonomy, 2023-2033
10.2.1. By Country
10.2.1.1. U.S.
10.2.1.2. Canada
10.2.2. By Component
10.2.3. By Technology
10.2.4. By Application
10.2.5. By Type
10.3. Market Attractiveness Analysis
10.3.1. By Country
10.3.2. By Component
10.3.3. By Technology
10.3.4. By Application
10.3.5. By Type
10.4. Key Takeaways
11. Latin America Market Analysis 2017-2022 and Forecast 2023-2033, By Country
11.1. Historical Market Size Value (US$ Mn) Trend Analysis By Market Taxonomy, 2017-2022
11.2. Market Size Value (US$ Mn) Forecast By Market Taxonomy, 2023-2033
11.2.1. By Country
11.2.1.1. Brazil
11.2.1.2. Mexico
11.2.1.3. Rest of Latin America
11.2.2. By Component
11.2.3. By Technology
11.2.4. By Application
11.2.5. By Type
11.3. Market Attractiveness Analysis
11.3.1. By Country
11.3.2. By Component
11.3.3. By Technology
11.3.4. By Application
11.3.5. By Type
11.4. Key Takeaways
12. Europe Market Analysis 2017-2022 and Forecast 2023-2033, By Country
12.1. Historical Market Size Value (US$ Mn) Trend Analysis By Market Taxonomy, 2017-2022
12.2. Market Size Value (US$ Mn) Forecast By Market Taxonomy, 2023-2033
12.2.1. By Country
12.2.1.1. U.K.
12.2.1.2. France
12.2.1.3. Germany
12.2.1.4. Italy
12.2.1.5. Spain
12.2.1.6. Rest of Europe
12.2.2. By Component
12.2.3. By Technology
12.2.4. By Application
12.2.5. By Type
12.3. Market Attractiveness Analysis
12.3.1. By Country
12.3.2. By Component
12.3.3. By Technology
12.3.4. By Application
12.3.5. By Type
12.4. Key Takeaways
13. East Asia Market Analysis 2017-2022 and Forecast 2023-2033, By Country
13.1. Historical Market Size Value (US$ Mn) Trend Analysis By Market Taxonomy, 2017-2022
13.2. Market Size Value (US$ Mn) Forecast By Market Taxonomy, 2023-2033
13.2.1. By Country
13.2.1.1. China
13.2.1.2. Japan
13.2.1.3. South Korea
13.2.2. By Component
13.2.3. By Technology
13.2.4. By Application
13.2.5. By Type
13.3. Market Attractiveness Analysis
13.3.1. By Country
13.3.2. By Component
13.3.3. By Technology
13.3.4. By Application
13.3.5. By Type
13.4. Key Takeaways
14. South Asia Market Analysis 2017-2022 and Forecast 2023-2033, By Country
14.1. Historical Market Size Value (US$ Mn) Trend Analysis By Market Taxonomy, 2017-2022
14.2. Market Size Value (US$ Mn) Forecast By Market Taxonomy, 2023-2033
14.2.1. By Country
14.2.1.1. Malaysia
14.2.1.2. India
14.2.1.3. Indonesia
14.2.1.4. Rest of South Asia
14.2.2. By Component
14.2.3. By Technology
14.2.4. By Application
14.2.5. By Type
14.3. Market Attractiveness Analysis
14.3.1. By Country
14.3.2. By Component
14.3.3. By Technology
14.3.4. By Application
14.3.5. By Type
14.4. Key Takeaways
15. Oceania Market Analysis 2017-2022 and Forecast 2023-2033, By Country
15.1. Historical Market Size Value (US$ Mn) Trend Analysis By Market Taxonomy, 2017-2022
15.2. Market Size Value (US$ Mn) Forecast By Market Taxonomy, 2023-2033
15.2.1. By Country
15.2.1.1. Australia
15.2.1.2. New Zealand
15.2.2. By Component
15.2.3. By Technology
15.2.4. By Application
15.2.5. By Type
15.3. Market Attractiveness Analysis
15.3.1. By Country
15.3.2. By Component
15.3.3. By Technology
15.3.4. By Application
15.3.5. By Type
15.4. Key Takeaways
16. MEA Market Analysis 2017-2022 and Forecast 2023-2033, By Country
16.1. Historical Market Size Value (US$ Mn) Trend Analysis By Market Taxonomy, 2017-2022
16.2. Market Size Value (US$ Mn) Forecast By Market Taxonomy, 2023-2033
16.2.1. By Country
16.2.1.1. GCC Countries
16.2.1.2. South Africa
16.2.1.3. Rest of MEA
16.2.2. By Component
16.2.3. By Technology
16.2.4. By Application
16.2.5. By Type
16.3. Market Attractiveness Analysis
16.3.1. By Country
16.3.2. By Component
16.3.3. By Technology
16.3.4. By Application
16.3.5. By Type
16.4. Key Takeaways
17. Key Countries Market Analysis
17.1. U.S.
17.1.1. Pricing Analysis
17.1.2. Market Share Analysis, 2022
17.1.2.1. By Component
17.1.2.2. By Technology
17.1.2.3. By Application
17.1.2.4. By Type
17.2. Canada
17.2.1. Pricing Analysis
17.2.2. Market Share Analysis, 2022
17.2.2.1. By Component
17.2.2.2. By Technology
17.2.2.3. By Application
17.2.2.4. By Type
17.3. Brazil
17.3.1. Pricing Analysis
17.3.2. Market Share Analysis, 2022
17.3.2.1. By Component
17.3.2.2. By Technology
17.3.2.3. By Application
17.3.2.4. By Type
17.4. Mexico
17.4.1. Pricing Analysis
17.4.2. Market Share Analysis, 2022
17.4.2.1. By Component
17.4.2.2. By Technology
17.4.2.3. By Application
17.4.2.4. By Type
17.5. U.K.
17.5.1. Pricing Analysis
17.5.2. Market Share Analysis, 2022
17.5.2.1. By Component
17.5.2.2. By Technology
17.5.2.3. By Application
17.5.2.4. By Type
17.6. France
17.6.1. Pricing Analysis
17.6.2. Market Share Analysis, 2022
17.6.2.1. By Component
17.6.2.2. By Technology
17.6.2.3. By Application
17.6.2.4. By Type
17.7. Germany
17.7.1. Pricing Analysis
17.7.2. Market Share Analysis, 2022
17.7.2.1. By Component
17.7.2.2. By Technology
17.7.2.3. By Application
17.7.2.4. By Type
17.8. Italy
17.8.1. Pricing Analysis
17.8.2. Market Share Analysis, 2022
17.8.2.1. By Component
17.8.2.2. By Technology
17.8.2.3. By Application
17.8.2.4. By Type
17.9. Spain
17.9.1. Pricing Analysis
17.9.2. Market Share Analysis, 2022
17.9.2.1. By Component
17.9.2.2. By Technology
17.9.2.3. By Application
17.9.2.4. By Type
17.10. China
17.10.1. Pricing Analysis
17.10.2. Market Share Analysis, 2022
17.10.2.1. By Component
17.10.2.2. By Technology
17.10.2.3. By Application
17.10.2.4. By Type
17.11. Japan
17.11.1. Pricing Analysis
17.11.2. Market Share Analysis, 2022
17.11.2.1. By Component
17.11.2.2. By Technology
17.11.2.3. By Application
17.11.2.4. By Type
17.12. South Korea
17.12.1. Pricing Analysis
17.12.2. Market Share Analysis, 2022
17.12.2.1. By Component
17.12.2.2. By Technology
17.12.2.3. By Application
17.12.2.4. By Type
17.13. Malaysia
17.13.1. Pricing Analysis
17.13.2. Market Share Analysis, 2022
17.13.2.1. By Component
17.13.2.2. By Technology
17.13.2.3. By Application
17.13.2.4. By Type
17.14. India
17.14.1. Pricing Analysis
17.14.2. Market Share Analysis, 2022
17.14.2.1. By Component
17.14.2.2. By Technology
17.14.2.3. By Application
17.14.2.4. By Type
17.15. Indonesia
17.15.1. Pricing Analysis
17.15.2. Market Share Analysis, 2022
17.15.2.1. By Component
17.15.2.2. By Technology
17.15.2.3. By Application
17.15.2.4. By Type
17.16. Australia
17.16.1. Pricing Analysis
17.16.2. Market Share Analysis, 2022
17.16.2.1. By Component
17.16.2.2. By Technology
17.16.2.3. By Application
17.16.2.4. By Type
17.17. New Zealand
17.17.1. Pricing Analysis
17.17.2. Market Share Analysis, 2022
17.17.2.1. By Component
17.17.2.2. By Technology
17.17.2.3. By Application
17.17.2.4. By Type
17.18. GCC Countries
17.18.1. Pricing Analysis
17.18.2. Market Share Analysis, 2022
17.18.2.1. By Component
17.18.2.2. By Technology
17.18.2.3. By Application
17.18.2.4. By Type
17.19. South Africa
17.19.1. Pricing Analysis
17.19.2. Market Share Analysis, 2022
17.19.2.1. By Component
17.19.2.2. By Technology
17.19.2.3. By Application
17.19.2.4. By Type
18. Market Structure Analysis
18.1. Competition Dashboard
18.2. Competition Benchmarking
18.3. Market Share Analysis of Top Players
18.3.1. By Regional
18.3.2. By Component
18.3.3. By Technology
18.3.4. By Application
18.3.5. By Type
19. Competition Analysis
19.1. Competition Deep Dive
19.1.1. BAE Systems
19.1.1.1. Overview
19.1.1.2. Product Portfolio
19.1.1.3. Profitability by Market Segments
19.1.1.4. Sales Footprint
19.1.1.5. Strategy Overview
19.1.1.5.1. Marketing Strategy
19.1.2. Continental AG
19.1.2.1. Overview
19.1.2.2. Product Portfolio
19.1.2.3. Profitability by Market Segments
19.1.2.4. Sales Footprint
19.1.2.5. Strategy Overview
19.1.2.5.1. Marketing Strategy
19.1.3. Denso Corporation
19.1.3.1. Overview
19.1.3.2. Product Portfolio
19.1.3.3. Profitability by Market Segments
19.1.3.4. Sales Footprint
19.1.3.5. Strategy Overview
19.1.3.5.1. Marketing Strategy
19.1.4. Honeywell Aerospace
19.1.4.1. Overview
19.1.4.2. Product Portfolio
19.1.4.3. Profitability by Market Segments
19.1.4.4. Sales Footprint
19.1.4.5. Strategy Overview
19.1.4.5.1. Marketing Strategy
19.1.5. Microvision, Inc.
19.1.5.1. Overview
19.1.5.2. Product Portfolio
19.1.5.3. Profitability by Market Segments
19.1.5.4. Sales Footprint
19.1.5.5. Strategy Overview
19.1.5.5.1. Marketing Strategy
19.1.6. Nippon Seiki Co., Ltd.
19.1.6.1. Overview
19.1.6.2. Product Portfolio
19.1.6.3. Profitability by Market Segments
19.1.6.4. Sales Footprint
19.1.6.5. Strategy Overview
19.1.6.5.1. Marketing Strategy
19.1.7. Panasonic Automotive Systems
19.1.7.1. Overview
19.1.7.2. Product Portfolio
19.1.7.3. Profitability by Market Segments
19.1.7.4. Sales Footprint
19.1.7.5. Strategy Overview
19.1.7.5.1. Marketing Strategy
19.1.8. Pioneer Corporation
19.1.8.1. Overview
19.1.8.2. Product Portfolio
19.1.8.3. Profitability by Market Segments
19.1.8.4. Sales Footprint
19.1.8.5. Strategy Overview
19.1.8.5.1. Marketing Strategy
19.1.9. Robert Bosch
19.1.9.1. Overview
19.1.9.2. Product Portfolio
19.1.9.3. Profitability by Market Segments
19.1.9.4. Sales Footprint
19.1.9.5. Strategy Overview
19.1.9.5.1. Marketing Strategy
19.1.10. Rockwell Collins
19.1.10.1. Overview
19.1.10.2. Product Portfolio
19.1.10.3. Profitability by Market Segments
19.1.10.4. Sales Footprint
19.1.10.5. Strategy Overview
19.1.10.5.1. Marketing Strategy
19.1.11. Saab
19.1.11.1. Overview
19.1.11.2. Product Portfolio
19.1.11.3. Profitability by Market Segments
19.1.11.4. Sales Footprint
19.1.11.5. Strategy Overview
19.1.11.5.1. Marketing Strategy
19.1.12. Thales Group
19.1.12.1. Overview
19.1.12.2. Product Portfolio
19.1.12.3. Profitability by Market Segments
19.1.12.4. Sales Footprint
19.1.12.5. Strategy Overview
19.1.12.5.1. Marketing Strategy
19.1.13. Visteon Corporation
19.1.13.1. Overview
19.1.13.2. Product Portfolio
19.1.13.3. Profitability by Market Segments
19.1.13.4. Sales Footprint
19.1.13.5. Strategy Overview
19.1.13.5.1. Marketing Strategy
19.1.14. Yazaki Corporation
19.1.14.1. Overview
19.1.14.2. Product Portfolio
19.1.14.3. Profitability by Market Segments
19.1.14.4. Sales Footprint
19.1.14.5. Strategy Overview
19.1.14.5.1. Marketing Strategy
20. Assumptions & Acronyms Used
21. Research Methodology
Let us know your requirement to get
100% FREE customization
List of Tables
Table 1: Global Market Value (US$ Mn) Forecast by Region, 2017-2033
Table 2: Global Market Value (US$ Mn) Forecast by Component, 2017-2033
Table 3: Global Market Value (US$ Mn) Forecast by Technology, 2017-2033
Table 4: Global Market Value (US$ Mn) Forecast by Application , 2017-2033
Table 5: Global Market Value (US$ Mn) Forecast by Type, 2017-2033
Table 6: North America Market Value (US$ Mn) Forecast by Country, 2017-2033
Table 7: North America Market Value (US$ Mn) Forecast by Component, 2017-2033
Table 8: North America Market Value (US$ Mn) Forecast by Technology, 2017-2033
Table 9: North America Market Value (US$ Mn) Forecast by Application , 2017-2033
Table 10: North America Market Value (US$ Mn) Forecast by Type, 2017-2033
Table 11: Latin America Market Value (US$ Mn) Forecast by Country, 2017-2033
Table 12: Latin America Market Value (US$ Mn) Forecast by Component, 2017-2033
Table 13: Latin America Market Value (US$ Mn) Forecast by Technology, 2017-2033
Table 14: Latin America Market Value (US$ Mn) Forecast by Application , 2017-2033
Table 15: Latin America Market Value (US$ Mn) Forecast by Type, 2017-2033
Table 16: Europe Market Value (US$ Mn) Forecast by Country, 2017-2033
Table 17: Europe Market Value (US$ Mn) Forecast by Component, 2017-2033
Table 18: Europe Market Value (US$ Mn) Forecast by Technology, 2017-2033
Table 19: Europe Market Value (US$ Mn) Forecast by Application , 2017-2033
Table 20: Europe Market Value (US$ Mn) Forecast by Type, 2017-2033
Table 21: East Asia Market Value (US$ Mn) Forecast by Country, 2017-2033
Table 22: East Asia Market Value (US$ Mn) Forecast by Component, 2017-2033
Table 23: East Asia Market Value (US$ Mn) Forecast by Technology, 2017-2033
Table 24: East Asia Market Value (US$ Mn) Forecast by Application , 2017-2033
Table 25: East Asia Market Value (US$ Mn) Forecast by Type, 2017-2033
Table 26: South Asia Market Value (US$ Mn) Forecast by Country, 2017-2033
Table 27: South Asia Market Value (US$ Mn) Forecast by Component, 2017-2033
Table 28: South Asia Market Value (US$ Mn) Forecast by Technology, 2017-2033
Table 29: South Asia Market Value (US$ Mn) Forecast by Application , 2017-2033
Table 30: South Asia Market Value (US$ Mn) Forecast by Type, 2017-2033
Table 31: Oceania Market Value (US$ Mn) Forecast by Country, 2017-2033
Table 32: Oceania Market Value (US$ Mn) Forecast by Component, 2017-2033
Table 33: Oceania Market Value (US$ Mn) Forecast by Technology, 2017-2033
Table 34: Oceania Market Value (US$ Mn) Forecast by Application , 2017-2033
Table 35: Oceania Market Value (US$ Mn) Forecast by Type, 2017-2033
Table 36: MEA Market Value (US$ Mn) Forecast by Country, 2017-2033
Table 37: MEA Market Value (US$ Mn) Forecast by Component, 2017-2033
Table 38: MEA Market Value (US$ Mn) Forecast by Technology, 2017-2033
Table 39: MEA Market Value (US$ Mn) Forecast by Application , 2017-2033
Table 40: MEA Market Value (US$ Mn) Forecast by Type, 2017-2033
Find your sweet spots for generating winning opportunities in this market.
Talk to AnalystList of Charts
Figure 1: Global Market Value (US$ Mn) by Component, 2023-2033
Figure 2: Global Market Value (US$ Mn) by Technology, 2023-2033
Figure 3: Global Market Value (US$ Mn) by Application , 2023-2033
Figure 4: Global Market Value (US$ Mn) by Type, 2023-2033
Figure 5: Global Market Value (US$ Mn) by Region, 2023-2033
Figure 6: Global Market Value (US$ Mn) Analysis by Region, 2017-2033
Figure 7: Global Market Value Share (%) and BPS Analysis by Region, 2023-2033
Figure 8: Global Market Y-o-Y Growth (%) Projections by Region, 2023-2033
Figure 9: Global Market Value (US$ Mn) Analysis by Component, 2017-2033
Figure 10: Global Market Value Share (%) and BPS Analysis by Component, 2023-2033
Figure 11: Global Market Y-o-Y Growth (%) Projections by Component, 2023-2033
Figure 12: Global Market Value (US$ Mn) Analysis by Technology, 2017-2033
Figure 13: Global Market Value Share (%) and BPS Analysis by Technology, 2023-2033
Figure 14: Global Market Y-o-Y Growth (%) Projections by Technology, 2023-2033
Figure 15: Global Market Value (US$ Mn) Analysis by Application , 2017-2033
Figure 16: Global Market Value Share (%) and BPS Analysis by Application , 2023-2033
Figure 17: Global Market Y-o-Y Growth (%) Projections by Application , 2023-2033
Figure 18: Global Market Value (US$ Mn) Analysis by Type, 2017-2033
Figure 19: Global Market Value Share (%) and BPS Analysis by Type, 2023-2033
Figure 20: Global Market Y-o-Y Growth (%) Projections by Type, 2023-2033
Figure 21: Global Market Attractiveness by Component, 2023-2033
Figure 22: Global Market Attractiveness by Technology, 2023-2033
Figure 23: Global Market Attractiveness by Application , 2023-2033
Figure 24: Global Market Attractiveness by Type, 2023-2033
Figure 25: Global Market Attractiveness by Region, 2023-2033
Figure 26: North America Market Value (US$ Mn) by Component, 2023-2033
Figure 27: North America Market Value (US$ Mn) by Technology, 2023-2033
Figure 28: North America Market Value (US$ Mn) by Application , 2023-2033
Figure 29: North America Market Value (US$ Mn) by Type, 2023-2033
Figure 30: North America Market Value (US$ Mn) by Country, 2023-2033
Figure 31: North America Market Value (US$ Mn) Analysis by Country, 2017-2033
Figure 32: North America Market Value Share (%) and BPS Analysis by Country, 2023-2033
Figure 33: North America Market Y-o-Y Growth (%) Projections by Country, 2023-2033
Figure 34: North America Market Value (US$ Mn) Analysis by Component, 2017-2033
Figure 35: North America Market Value Share (%) and BPS Analysis by Component, 2023-2033
Figure 36: North America Market Y-o-Y Growth (%) Projections by Component, 2023-2033
Figure 37: North America Market Value (US$ Mn) Analysis by Technology, 2017-2033
Figure 38: North America Market Value Share (%) and BPS Analysis by Technology, 2023-2033
Figure 39: North America Market Y-o-Y Growth (%) Projections by Technology, 2023-2033
Figure 40: North America Market Value (US$ Mn) Analysis by Application , 2017-2033
Figure 41: North America Market Value Share (%) and BPS Analysis by Application , 2023-2033
Figure 42: North America Market Y-o-Y Growth (%) Projections by Application , 2023-2033
Figure 43: North America Market Value (US$ Mn) Analysis by Type, 2017-2033
Figure 44: North America Market Value Share (%) and BPS Analysis by Type, 2023-2033
Figure 45: North America Market Y-o-Y Growth (%) Projections by Type, 2023-2033
Figure 46: North America Market Attractiveness by Component, 2023-2033
Figure 47: North America Market Attractiveness by Technology, 2023-2033
Figure 48: North America Market Attractiveness by Application , 2023-2033
Figure 49: North America Market Attractiveness by Type, 2023-2033
Figure 50: North America Market Attractiveness by Country, 2023-2033
Figure 51: Latin America Market Value (US$ Mn) by Component, 2023-2033
Figure 52: Latin America Market Value (US$ Mn) by Technology, 2023-2033
Figure 53: Latin America Market Value (US$ Mn) by Application , 2023-2033
Figure 54: Latin America Market Value (US$ Mn) by Type, 2023-2033
Figure 55: Latin America Market Value (US$ Mn) by Country, 2023-2033
Figure 56: Latin America Market Value (US$ Mn) Analysis by Country, 2017-2033
Figure 57: Latin America Market Value Share (%) and BPS Analysis by Country, 2023-2033
Figure 58: Latin America Market Y-o-Y Growth (%) Projections by Country, 2023-2033
Figure 59: Latin America Market Value (US$ Mn) Analysis by Component, 2017-2033
Figure 60: Latin America Market Value Share (%) and BPS Analysis by Component, 2023-2033
Figure 61: Latin America Market Y-o-Y Growth (%) Projections by Component, 2023-2033
Figure 62: Latin America Market Value (US$ Mn) Analysis by Technology, 2017-2033
Figure 63: Latin America Market Value Share (%) and BPS Analysis by Technology, 2023-2033
Figure 64: Latin America Market Y-o-Y Growth (%) Projections by Technology, 2023-2033
Figure 65: Latin America Market Value (US$ Mn) Analysis by Application , 2017-2033
Figure 66: Latin America Market Value Share (%) and BPS Analysis by Application , 2023-2033
Figure 67: Latin America Market Y-o-Y Growth (%) Projections by Application , 2023-2033
Figure 68: Latin America Market Value (US$ Mn) Analysis by Type, 2017-2033
Figure 69: Latin America Market Value Share (%) and BPS Analysis by Type, 2023-2033
Figure 70: Latin America Market Y-o-Y Growth (%) Projections by Type, 2023-2033
Figure 71: Latin America Market Attractiveness by Component, 2023-2033
Figure 72: Latin America Market Attractiveness by Technology, 2023-2033
Figure 73: Latin America Market Attractiveness by Application , 2023-2033
Figure 74: Latin America Market Attractiveness by Type, 2023-2033
Figure 75: Latin America Market Attractiveness by Country, 2023-2033
Figure 76: Europe Market Value (US$ Mn) by Component, 2023-2033
Figure 77: Europe Market Value (US$ Mn) by Technology, 2023-2033
Figure 78: Europe Market Value (US$ Mn) by Application , 2023-2033
Figure 79: Europe Market Value (US$ Mn) by Type, 2023-2033
Figure 80: Europe Market Value (US$ Mn) by Country, 2023-2033
Figure 81: Europe Market Value (US$ Mn) Analysis by Country, 2017-2033
Figure 82: Europe Market Value Share (%) and BPS Analysis by Country, 2023-2033
Figure 83: Europe Market Y-o-Y Growth (%) Projections by Country, 2023-2033
Figure 84: Europe Market Value (US$ Mn) Analysis by Component, 2017-2033
Figure 85: Europe Market Value Share (%) and BPS Analysis by Component, 2023-2033
Figure 86: Europe Market Y-o-Y Growth (%) Projections by Component, 2023-2033
Figure 87: Europe Market Value (US$ Mn) Analysis by Technology, 2017-2033
Figure 88: Europe Market Value Share (%) and BPS Analysis by Technology, 2023-2033
Figure 89: Europe Market Y-o-Y Growth (%) Projections by Technology, 2023-2033
Figure 90: Europe Market Value (US$ Mn) Analysis by Application , 2017-2033
Figure 91: Europe Market Value Share (%) and BPS Analysis by Application , 2023-2033
Figure 92: Europe Market Y-o-Y Growth (%) Projections by Application , 2023-2033
Figure 93: Europe Market Value (US$ Mn) Analysis by Type, 2017-2033
Figure 94: Europe Market Value Share (%) and BPS Analysis by Type, 2023-2033
Figure 95: Europe Market Y-o-Y Growth (%) Projections by Type, 2023-2033
Figure 96: Europe Market Attractiveness by Component, 2023-2033
Figure 97: Europe Market Attractiveness by Technology, 2023-2033
Figure 98: Europe Market Attractiveness by Application , 2023-2033
Figure 99: Europe Market Attractiveness by Type, 2023-2033
Figure 100: Europe Market Attractiveness by Country, 2023-2033
Figure 101: East Asia Market Value (US$ Mn) by Component, 2023-2033
Figure 102: East Asia Market Value (US$ Mn) by Technology, 2023-2033
Figure 103: East Asia Market Value (US$ Mn) by Application , 2023-2033
Figure 104: East Asia Market Value (US$ Mn) by Type, 2023-2033
Figure 105: East Asia Market Value (US$ Mn) by Country, 2023-2033
Figure 106: East Asia Market Value (US$ Mn) Analysis by Country, 2017-2033
Figure 107: East Asia Market Value Share (%) and BPS Analysis by Country, 2023-2033
Figure 108: East Asia Market Y-o-Y Growth (%) Projections by Country, 2023-2033
Figure 109: East Asia Market Value (US$ Mn) Analysis by Component, 2017-2033
Figure 110: East Asia Market Value Share (%) and BPS Analysis by Component, 2023-2033
Figure 111: East Asia Market Y-o-Y Growth (%) Projections by Component, 2023-2033
Figure 112: East Asia Market Value (US$ Mn) Analysis by Technology, 2017-2033
Figure 113: East Asia Market Value Share (%) and BPS Analysis by Technology, 2023-2033
Figure 114: East Asia Market Y-o-Y Growth (%) Projections by Technology, 2023-2033
Figure 115: East Asia Market Value (US$ Mn) Analysis by Application , 2017-2033
Figure 116: East Asia Market Value Share (%) and BPS Analysis by Application , 2023-2033
Figure 117: East Asia Market Y-o-Y Growth (%) Projections by Application , 2023-2033
Figure 118: East Asia Market Value (US$ Mn) Analysis by Type, 2017-2033
Figure 119: East Asia Market Value Share (%) and BPS Analysis by Type, 2023-2033
Figure 120: East Asia Market Y-o-Y Growth (%) Projections by Type, 2023-2033
Figure 121: East Asia Market Attractiveness by Component, 2023-2033
Figure 122: East Asia Market Attractiveness by Technology, 2023-2033
Figure 123: East Asia Market Attractiveness by Application , 2023-2033
Figure 124: East Asia Market Attractiveness by Type, 2023-2033
Figure 125: East Asia Market Attractiveness by Country, 2023-2033
Figure 126: South Asia Market Value (US$ Mn) by Component, 2023-2033
Figure 127: South Asia Market Value (US$ Mn) by Technology, 2023-2033
Figure 128: South Asia Market Value (US$ Mn) by Application , 2023-2033
Figure 129: South Asia Market Value (US$ Mn) by Type, 2023-2033
Figure 130: South Asia Market Value (US$ Mn) by Country, 2023-2033
Figure 131: South Asia Market Value (US$ Mn) Analysis by Country, 2017-2033
Figure 132: South Asia Market Value Share (%) and BPS Analysis by Country, 2023-2033
Figure 133: South Asia Market Y-o-Y Growth (%) Projections by Country, 2023-2033
Figure 134: South Asia Market Value (US$ Mn) Analysis by Component, 2017-2033
Figure 135: South Asia Market Value Share (%) and BPS Analysis by Component, 2023-2033
Figure 136: South Asia Market Y-o-Y Growth (%) Projections by Component, 2023-2033
Figure 137: South Asia Market Value (US$ Mn) Analysis by Technology, 2017-2033
Figure 138: South Asia Market Value Share (%) and BPS Analysis by Technology, 2023-2033
Figure 139: South Asia Market Y-o-Y Growth (%) Projections by Technology, 2023-2033
Figure 140: South Asia Market Value (US$ Mn) Analysis by Application , 2017-2033
Figure 141: South Asia Market Value Share (%) and BPS Analysis by Application , 2023-2033
Figure 142: South Asia Market Y-o-Y Growth (%) Projections by Application , 2023-2033
Figure 143: South Asia Market Value (US$ Mn) Analysis by Type, 2017-2033
Figure 144: South Asia Market Value Share (%) and BPS Analysis by Type, 2023-2033
Figure 145: South Asia Market Y-o-Y Growth (%) Projections by Type, 2023-2033
Figure 146: South Asia Market Attractiveness by Component, 2023-2033
Figure 147: South Asia Market Attractiveness by Technology, 2023-2033
Figure 148: South Asia Market Attractiveness by Application , 2023-2033
Figure 149: South Asia Market Attractiveness by Type, 2023-2033
Figure 150: South Asia Market Attractiveness by Country, 2023-2033
Figure 151: Oceania Market Value (US$ Mn) by Component, 2023-2033
Figure 152: Oceania Market Value (US$ Mn) by Technology, 2023-2033
Figure 153: Oceania Market Value (US$ Mn) by Application , 2023-2033
Figure 154: Oceania Market Value (US$ Mn) by Type, 2023-2033
Figure 155: Oceania Market Value (US$ Mn) by Country, 2023-2033
Figure 156: Oceania Market Value (US$ Mn) Analysis by Country, 2017-2033
Figure 157: Oceania Market Value Share (%) and BPS Analysis by Country, 2023-2033
Figure 158: Oceania Market Y-o-Y Growth (%) Projections by Country, 2023-2033
Figure 159: Oceania Market Value (US$ Mn) Analysis by Component, 2017-2033
Figure 160: Oceania Market Value Share (%) and BPS Analysis by Component, 2023-2033
Figure 161: Oceania Market Y-o-Y Growth (%) Projections by Component, 2023-2033
Figure 162: Oceania Market Value (US$ Mn) Analysis by Technology, 2017-2033
Figure 163: Oceania Market Value Share (%) and BPS Analysis by Technology, 2023-2033
Figure 164: Oceania Market Y-o-Y Growth (%) Projections by Technology, 2023-2033
Figure 165: Oceania Market Value (US$ Mn) Analysis by Application , 2017-2033
Figure 166: Oceania Market Value Share (%) and BPS Analysis by Application , 2023-2033
Figure 167: Oceania Market Y-o-Y Growth (%) Projections by Application , 2023-2033
Figure 168: Oceania Market Value (US$ Mn) Analysis by Type, 2017-2033
Figure 169: Oceania Market Value Share (%) and BPS Analysis by Type, 2023-2033
Figure 170: Oceania Market Y-o-Y Growth (%) Projections by Type, 2023-2033
Figure 171: Oceania Market Attractiveness by Component, 2023-2033
Figure 172: Oceania Market Attractiveness by Technology, 2023-2033
Figure 173: Oceania Market Attractiveness by Application , 2023-2033
Figure 174: Oceania Market Attractiveness by Type, 2023-2033
Figure 175: Oceania Market Attractiveness by Country, 2023-2033
Figure 176: MEA Market Value (US$ Mn) by Component, 2023-2033
Figure 177: MEA Market Value (US$ Mn) by Technology, 2023-2033
Figure 178: MEA Market Value (US$ Mn) by Application , 2023-2033
Figure 179: MEA Market Value (US$ Mn) by Type, 2023-2033
Figure 180: MEA Market Value (US$ Mn) by Country, 2023-2033
Figure 181: MEA Market Value (US$ Mn) Analysis by Country, 2017-2033
Figure 182: MEA Market Value Share (%) and BPS Analysis by Country, 2023-2033
Figure 183: MEA Market Y-o-Y Growth (%) Projections by Country, 2023-2033
Figure 184: MEA Market Value (US$ Mn) Analysis by Component, 2017-2033
Figure 185: MEA Market Value Share (%) and BPS Analysis by Component, 2023-2033
Figure 186: MEA Market Y-o-Y Growth (%) Projections by Component, 2023-2033
Figure 187: MEA Market Value (US$ Mn) Analysis by Technology, 2017-2033
Figure 188: MEA Market Value Share (%) and BPS Analysis by Technology, 2023-2033
Figure 189: MEA Market Y-o-Y Growth (%) Projections by Technology, 2023-2033
Figure 190: MEA Market Value (US$ Mn) Analysis by Application , 2017-2033
Figure 191: MEA Market Value Share (%) and BPS Analysis by Application , 2023-2033
Figure 192: MEA Market Y-o-Y Growth (%) Projections by Application , 2023-2033
Figure 193: MEA Market Value (US$ Mn) Analysis by Type, 2017-2033
Figure 194: MEA Market Value Share (%) and BPS Analysis by Type, 2023-2033
Figure 195: MEA Market Y-o-Y Growth (%) Projections by Type, 2023-2033
Figure 196: MEA Market Attractiveness by Component, 2023-2033
Figure 197: MEA Market Attractiveness by Technology, 2023-2033
Figure 198: MEA Market Attractiveness by Application , 2023-2033
Figure 199: MEA Market Attractiveness by Type, 2023-2033
Figure 200: MEA Market Attractiveness by Country, 2023-2033
Need specific information?
Request CustomizationExplore Technology Insights
View Reports