High-Protein Feed Market Size, Share, and Forecast Outlook 2025 to 2035

High protein feed volume was USD 25.6 billion in 2025 and is expected to total USD 35.4 billion by 2035, growing at a 3.3% CAGR. Over half of current usage is traced to poultry and swine diets, with aquafeed representing the fastest growing segment.
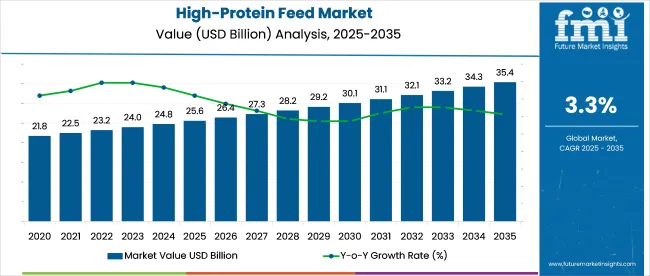
Quick Stats of High-Protein Feed Market

  • High-Protein Feed Market Size (2025): USD 25.6 billion
  • Projected High-Protein Feed Market Size (2035): USD 35.4 billion
  • Forecast CAGR of High-Protein Feed Market (2025 to 2035): 3.3%
  • Leading Segment of High-Protein Feed Market (2025): Soybean Meal (39%)
  • Key Growth Regions of High-Protein Feed Market: South Asia & Pacific, East Asia, North America
  • Top Key Players of High-Protein Feed Market: Cargill Inc., Archer Daniels Midland Company (ADM), Nutreco (Skretting, Trouw Nutrition), Alltech Inc., Ridley Corporation (Agribrands Purina, Mitsui)

High Protein Feed Market

Metric Value
Market Size in 2025 USD 25.6 billion
Projected Market Size in 2035 USD 35.4 billion
CAGR (2025 to 2035) 3.3%

Supplychain upgrades are being spurred by investments in feed mills, extrusion lines, and precision blending facilities in key regions like North America, Europe, and Southeast Asia. Capacity constraints remain in microingredient fortification and amino acid synthesis, where biotechdriven strain optimization and industrial fermentation capabilities are being leveraged.

During the inauguration of Nutreco’s cell-feed powder facility in Boxmeer, Netherlands, CEO David Blakemore stated that “We recognise the possibilities in cultivated protein and think this industry holds tremendous potential. One of the biggest challenges it faces though is how to feed the protein cells cost-efficiently, sustainably and at very large scale. At Nutreco, we believe we can create cell culture media with a lower cost and enable the industry to scale up and bring to the masses something that is currently only available to a limited few.”

The high-protein feed market, estimated around 140-160 billion in 2025, holds a central position in several feed-related sectors. It accounts for roughly 25-30% of the global animal feed market, reflecting its essential role in livestock growth, muscle development, and feed efficiency. Within the compound feed market, its share reaches 35-40% due to inclusion in formulated rations for poultry, swine, and dairy.

In the functional animal feed market, high-protein inputs contribute 30-35% as they support reproductive health, immunity, and performance metrics. Within the broader protein ingredients market, feed applications represent about 20–25% of total demand. In the livestock and aquaculture nutrition sector, high-protein feed commands 40-45% of total value, driven by intensive production systems prioritizing feed conversion and weight gain.

Analyzing High-Protein Feed Market by Top Investment Segments

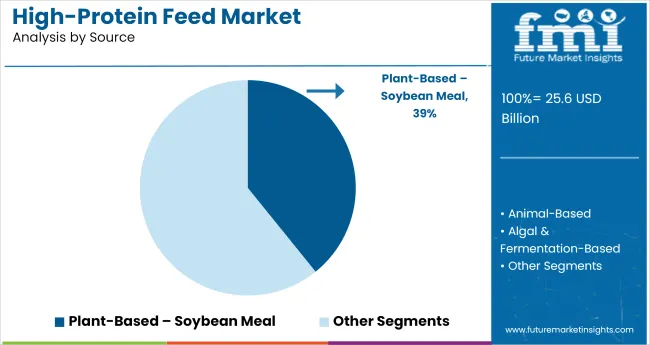
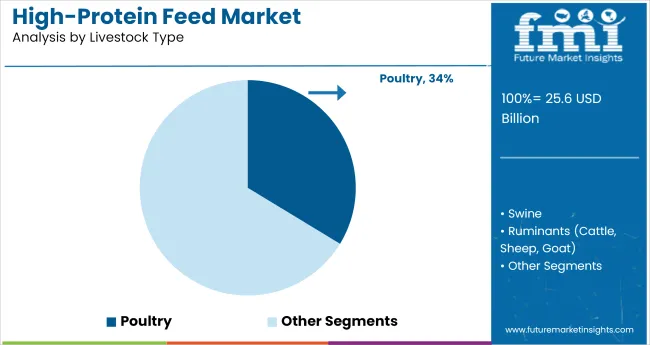
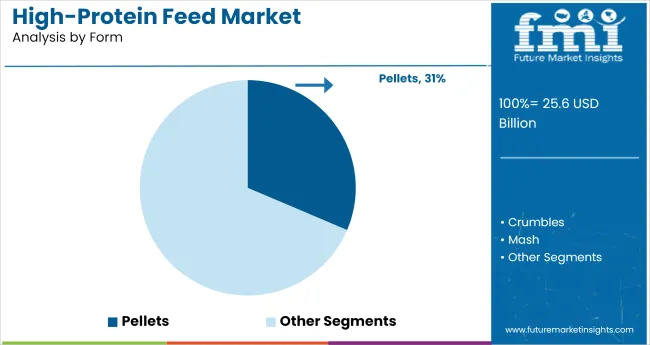
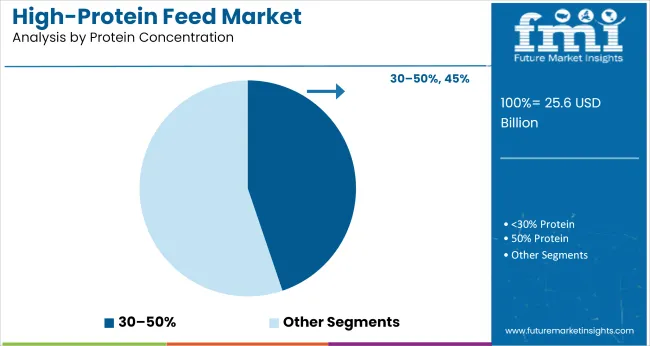
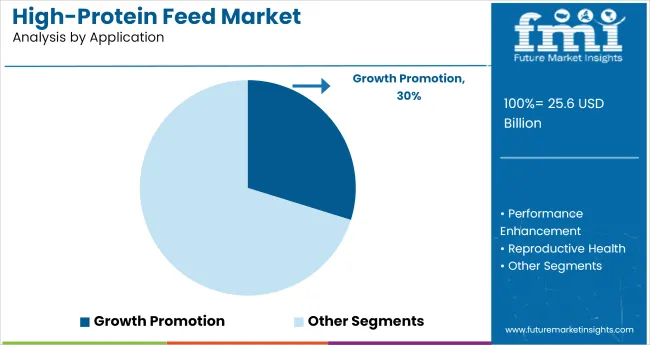
The market is led by soybean meal under plant-based sources with a 39% share. Poultry dominates livestock consumption at 34% share. Pellets account for 31% of form-based demand. The 30–50% protein concentration range holds 45% share, while growth promotion applications represent 30%.

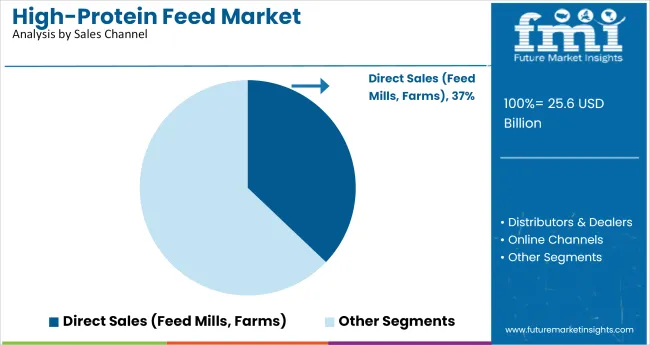
Direct sales channels contribute 37% of total distribution.Regional demand is concentrated in North America, East Asia, and South Asia & Pacific, followed by Latin America, Europe, and the Middle East & Africa, driven by industrial-scale livestock operations and feed mill expansions.
Soybean Meal Dominates Plant-Based Feed Sources

High Protein Feed Market Analysis By Source

Soybean meal held a 39% share of the source segment in 2025, establishing itself as the most commonly used plant-based protein in compound feed. Its amino acid profile, digestibility, and cost efficiency have positioned it as a core ingredient across poultry, dairy, and aquaculture systems.

Used extensively in starter and finisher diets, soybean meal has enabled precise protein formulation, especially when paired with synthetic amino acids. Suppliers in the United States, Brazil, and China have scaled production to meet consistent demand from industrial feed mills.
  • Soybean meal used in pre-mixes for poultry and swine sectors.
  • Export volumes remain high across ASEAN and Western Europe.
  • Cost-to-protein ratio makes it competitive against fish and meat meals.

Poultry Segment Drives Livestock Consumption

High Protein Feed Market Analysis By Livestock Type

Poultry feed consumption accounted for a 34% share in 2025 within the market. Protein-rich diets have been implemented across broiler, layer, and breeder segments to support rapid growth and improve feed conversion ratios. Inclusion of high-protein concentrates has also improved flock uniformity and carcass yield in commercial poultry operations.

Feed integrators in India, the USA, and the Philippines have driven adoption through fortified soy, canola, and fish-based blends. Layer diets have also benefited from consistent protein-to-energy calibration using these feeds.
  • High-protein feed used in starter broiler rations and pre-lay diets.
  • Soy-fish combinations deployed in dual-purpose poultry operations.
  • Egg producers favor consistent protein levels to maintain shell quality.

Pellet Form Favored for Storage and Dispensing

High Protein Feed Market Analysis By Form

Pelletized feed formats held a 31% share in 2025 due to their convenience in handling, transport, and mechanical feeding systems. Pelletizing enables uniform distribution of protein content, while reducing fines and segregation in high-density protein blends.

Heat-treated pellet production also contributes to microbial load control. Feed mills in Germany, the USA and Vietnam have increased pellet capacity for poultry and ruminant use. Pellets are preferred in climate-sensitive areas where moisture and spoilage risk are elevated.
  • High-protein pellet blends distributed in tropical and subtropical regions.
  • Pellets integrated in automated feeding systems across commercial farms.
  • Consistency in texture supports dosing accuracy in large-scale feedlots.

30-50% Protein Concentration Range Leads Formulations

High Protein Feed Market Analysis By Protein Concentration

The 30–50% protein range accounted for a 45% share, making it the largest concentration bracket in 2025. Feeds within this range are used in balanced rations across multiple livestock categories, including poultry, swine, and aquaculture. This segment allows flexibility in formulation while maintaining digestibility and protein efficiency. Manufacturers in the EU and Southeast Asia have standardized offerings within this range for easier nutrient profile management. The bracket has been especially favored in regions where regulatory feed compliance requires minimum guaranteed protein levels.
  • Used widely in broiler grower and finisher rations.
  • Supports ration balancing in mixed ingredient feed systems.
  • Optimal range for combination with fat supplements in feed formulations.

Growth Promotion Dominates Application Segment

High Protein Feed Market Analysis By Application

Growth promotion represented a 30% share of the application category in 2025. High-protein formulations have been used to support muscle development, skeletal integrity, and efficient feed-to-weight gain across poultry, cattle, and aquaculture species. Feeds enriched with lysine, methionine, and bioavailable minerals have enhanced productivity in both commercial and contract farming setups. Southeast Asia and Latin America have reported increased demand from poultry integrators and aquaculture clusters focused on achieving growth targets within shorter cycles.
  • Growth-specific feeds used in fast-rearing broiler and finfish operations.
  • Functional proteins included for tissue regeneration and gut health.
  • Growth-enhancing blends applied in zero-antibiotic production systems.

Direct Sales to Farms and Feed Mills Lead Distribution

High Protein Feed Market Analysis By Sales Channel

Direct sales channels accounted for a 37% share of distribution in 2025. Feed manufacturers and bulk protein suppliers have prioritized B2B transactions with farms, cooperatives, and feed millers to ensure cost efficiency and customization. Contract arrangements have enabled consistent delivery and nutrition standardization. The segment has expanded in markets like Brazil, Indonesia, and the USA, where vertically integrated farms require feed customization aligned with performance goals.

  • Direct supply chains improve traceability and reduce lead times.
  • Integrated poultry firms procure directly from protein concentrate suppliers.
  • Feed-to-yield ratios optimized via farm-linked formulation feedback loops.

Top High-Protein Feed Market Dynamics

The market is expanding due to rising livestock production, reduced reliance on soymeal, and increased adoption of alternative proteins. However, price volatility, fragmented regulatory approvals, and limited technical capacity among small producers continue to challenge consistent scale-up and integration.

Growth in Alternative Protein Sources for Animal Nutrition

The inclusion of high-protein ingredients is increasing due to their ability to support feed efficiency, animal growth rates, and reduced soy dependency. Countries like China are targeting a reduction in soymeal inclusion from 13% to 10% by 2030, encouraging shifts to novel proteins. Asia-Pacific, especially India and China, leads demand growth with aquafeed and poultry sectors adopting corn protein, DDGS, and insect meal at accelerating rates.

  • China is reducing soymeal inclusion, increasing alternative protein demand by over 7% YoY
  • Alternative protein feed segment expected to reach USD 18.1 billion by 2035
  • Amino acids accounted for 54.5% of total feed additive value in 2023

Volatile Input Costs and Regulatory Barriers Limiting Expansion

Price instability of traditional protein sources, such as soybean and DDGS, along with newer alternatives like insect protein, is creating forecasting and procurement challenges. Inconsistent regulatory frameworks, particularly for novel ingredients like microbial and synthetic proteins, delay product approvals and market entry. Smaller producers face hurdles adapting feed formulations due to cost and lack of technical resources, especially in regions with limited infrastructure or extension support.
  • Soybean and corn protein prices have fluctuated 11-18% annually since 2022
  • Regulatory approval timelines for insect protein range from 9 to 24 months across markets
  • Over 60% of small feed mills in China face challenges integrating low-soy feed formulas

Top Countries Formulating, Producing, and Distributing High-Protein Feed

Country Wise Analysis Of High Protein Feed Market

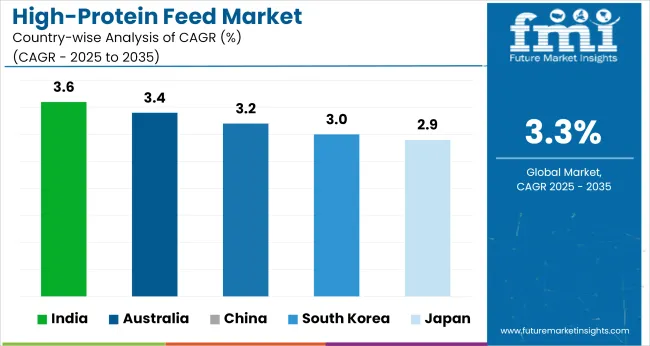
Countries CAGR (2025 to 2035)
India 3.6%
Australia 3.4%
China 3.2%
South Korea 3.0%
Japan 2.9%

The global high-protein feed market is projected to grow at a CAGR of 3.3% from 2025 to 2035. The report includes detailed analysis of 40+ countries, with the top five presented as a reference. India, part of the BRICS group, leads with 3.6% growth, supported by rising demand for protein-enriched dairy and poultry feed. Australia, aligned with OECD economies, follows at 3.4%, driven by lupin and soybean meal integration across cattle and sheep sectors. China, also in BRICS, posts 3.2%, with growth centered on aquaculture and commercial swine diets.

South Korea, a key East Asian OECD economy, records 3.0% as protein diversification through insect meal and oilseed imports gains momentum. Japan, another OECD member, posts 2.9%, reflecting feed market maturity and slower adoption of new protein sources. All five countries remain close to or above the global average, highlighting varied feed strategies shaped by regional protein access, trade alignment, and species-specific demand.

In-depth Analysis of High-Protein Feed Market in India

The high-protein feed market in India is projected to expand at a CAGR of 3.6% between 2025 and 2035. Protein-enriched formulations are being adopted in dairy and poultry nutrition, especially across Punjab, Maharashtra, and Tamil Nadu. Increased inclusion of soybean meal, cottonseed cake, and fishmeal has been observed in concentrated feed mixes.

Feed cooperatives and state-backed procurement schemes have supported distribution in semi-intensive production zones. Local feed mills are blending native protein sources with synthetic amino acids to meet minimum digestibility benchmarks.

  • Soybean meal contributed 61% of high-protein compound feed output in 2028
  • Over 38% of volume was generated by dairy cooperatives by 2030
  • 27 public-private units introduced fortified high-protein blends post 2026

Opportunity Analysis of High-Protein Feed Market in Australia

The high-protein feed market in Australia is forecast to grow at a CAGR of 3.4% through 2035. Sheep and cattle sectors are leading demand for high-protein additives focused on improving weight gain and reproductive efficiency. Lupin, faba bean, and canola meal are being used in protein balancing for pasture-fed livestock.

Feedlots in New South Wales and Western Australia are upgrading protein formulations for ruminants, with increased use of precision feed blending systems. Nutritional studies have validated protein-linked performance markers in commercial beef operations.

  • Lupin meal made up 43% of protein ingredient volume by 2029
  • Feedlot-based ruminant diets adopted 2.2× more protein inclusion by 2030
  • Faba bean inclusion increased 3.6× across integrated sheep farms

Sales Analysis of High-Protein Feed Market in China

Demand for high-protein feed in China is growing at a CAGR of 3.2% through 2035. Focus has been placed on monogastric livestock nutrition, particularly in the swine and aquaculture segments. Soy protein concentrate and fermented meal variants are being deployed in piglet and juvenile fish diets. Feed mills in provinces like Shandong and Sichuan have scaled production of high-digestibility protein blends. Government mandates on protein efficiency ratios have driven R&D collaborations with agricultural universities and marine feed laboratories.

  • Soy protein concentrate held 57% share of swine starter feeds in 2028
  • Fermented protein blends saw 2.9× expansion in aquafeed usage by 2030
  • Over 70 provincial feed mills launched concentrated protein lines post 2025

Demand Outlook for High-Protein Feed Market in South Korea

Sales of high-protein feed in South Korea areexpanding at a CAGR of 3.0% between 2025 and 2035. Demand is being shaped by poultry integrators and egg producers prioritizing feed conversion efficiency. Hydrolyzed vegetable protein and fish protein hydrolysates are being incorporated into broiler and layer diets to meet amino acid requirements. Imports of specialty protein premixes have increased, with Japanese and European suppliers expanding distribution. Urban feed plants are adopting small-batch protein blending with traceability-enabled formulation systems.

  • Fish protein hydrolysate inclusion rose 4.2× in broiler feed by 2029
  • Poultry sector accounted for 68% of high-protein feed demand in 2028
  • Imports of protein premix grew 3.1× between 2025 and 2030

Demand Analysis for High-Protein Feed Market in Japan

The high-protein feed market in Japan is expected to grow at a CAGR of 2.9% through 2035. Demand has increased in swine and dairy production where feed conversion and carcass quality remain key targets. Protein enrichment is being implemented using canola meal, soy flour, and imported fishmeal. Co-operative dairy groups in Hokkaido are driving regional uptake of fortified protein mixes in silage-based diets. Traceable feed certification and feed safety regulations have guided adoption across branded meat and milk supply chains.
  • Fishmeal contributed 54% of protein ingredients used in coastal livestock zones
  • High-protein silage adoption increased 2.7× in Hokkaido by 2029
  • Certified feed blends reached 39% market penetration by 2030

Competitive Landscape in the High-Protein Feed Market

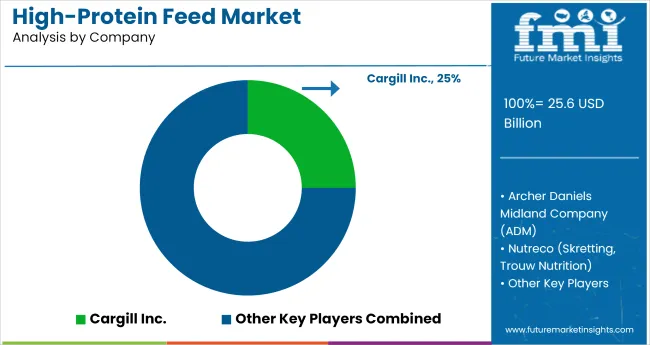
High Protein Feed Market Analysis By Company

The high-protein feed market is led by vertically integrated agribusinesses with strong sourcing, R&D, and distribution infrastructure. Cargill Inc. and Archer Daniels Midland Company (ADM) dominate global volumes through soybean meal, canola protein, and alternative concentrates tailored to livestock and aquaculture.

Nutreco, via Skretting and Trouw Nutrition, targets value-added high-protein blends for performance enhancement across poultry, fish, and swine segments. Alltech Inc. emphasizes yeast-based proteins and fermentation technologies to enhance digestibility and amino acid profiles.

Ridley Corporation, under Mitsui control, serves the Asia-Pacific market with compound feed tailored to regional dietary formulations. Strategic priorities include backward integration into oilseed processing, patented feed optimization systems, and alignment with region-specific animal nutrition regulations to maintain high-protein content consistency.

Leading Company - Cargill Inc.Market Share - 25%

Recent Industry News

  • April 1, 2025, Cargill released its 2025 Protein Profile, revealing that 61% of USA consumers increased their protein intake in 2024, with animal protein still leading the preference. This insight highlights rising demand for high-protein animal feed inputs to support meat and egg production
  • October 23, 2024, Nutreco opened the world’s first dedicated food-grade powdered cellfeed production facility in Boxmeer, Netherlands. This groundbreaking site supports the cellcultured meat industry with costefficient, scalable nutrition solutions.

Leading Companies in High-Protein Feed Market

  • Cargill Inc.
  • Archer Daniels Midland Company (ADM)
  • Nutreco (Skretting, Trouw Nutrition)
  • Alltech Inc.
  • Ridley Corporation (Agribrands Purina, Mitsui)

Research Coverage and Scope Summary

Report Attributes Details
Market Size (2025) USD 25.6 billion
Projected Market Size (2035) USD 35.4 billion
CAGR (2025 to 2035) 3.3%
Base Year for Estimation 2024
Historical Period 2020 to 2024
Projections Period 2025 to 2035
Quantitative Units USD billion for value and million metric tons for volume
Sources Analyzed (Segment 1) Plant-Based (Soybean Meal, Canola Meal, Sunflower Meal, Pea Protein, Cottonseed Meal, Lupin Meal), Animal-Based (Fish Meal, Meat & Bone Meal, Poultry By-product Meal, Blood Meal, Feather Meal), Algal & Fermentation-Based (Single Cell Protein, Yeast-Derived Protein, Microalgae Protein, Mycoprotein )
Livestock Types Analyzed (Segment 2) Poultry, Swine, Ruminants (Cattle, Sheep, Goat), Aquaculture, Pet Food, Equine, Specialty Animals (Rabbit, etc.)
Forms Analyzed (Segment 3) Pellets, Crumbles, Mash, Extruded, Liquid Concentrate, Powder/Meal
Protein Concentrations Analyzed (Segment 4) <30% Protein, 30–50% Protein, >50% Protein
Applications Analyzed (Segment 5) Growth Promotion, Performance Enhancement, Reproductive Health, Immune Support, Feed Conversion Optimization
Sales Channels Analyzed (Segment 6) Direct Sales (Feed Mills, Farms), Distributors & Dealers, Online Channels, Cooperatives
Regions Covered North America, Latin America, Europe, East Asia, South Asia & Pacific, Middle East & Africa
Countries Covered United States, Canada, Germany, United Kingdom, France, Italy, Spain, China, India, Japan, South Korea, Australia, Brazil, Mexico, Argentina, Saudi Arabia, UAE, South Africa
Key Players Cargill Inc., Archer Daniels Midland Company (ADM), Nutreco (Skretting, Trouw Nutrition), Alltech Inc., Ridley Corporation ( Agribrands Purina, Mitsui)
Additional Attributes Dollar sales, share by protein source and livestock application, rise of algal and microbial protein formats, segment shift toward >50% protein blends, demand for performance-based feed formulations across poultry and aquafeed segments

Key Segments

By Source:

The segment includes Plant-Based (Soybean Meal, Canola Meal, Sunflower Meal, Pea Protein, Cottonseed Meal, Lupin Meal), Animal-Based (Fish Meal, Meat & Bone Meal, Poultry By-product Meal, Blood Meal, Feather Meal), and Algal & Fermentation-Based (Single Cell Protein, Yeast-Derived Protein, Microalgae Protein, Mycoprotein).

By Livestock Type:

This segment covers Poultry, Swine, Ruminants (Cattle, Sheep, Goat), Aquaculture, Pet Food, Equine, and Specialty Animals (Rabbit, etc.).

By Form:

The industry is segmented into Pellets, Crumbles, Mash, Extruded, Liquid Concentrate, and Powder/Meal.

By Protein Concentration:

This includes <30% Protein, 30-50% Protein, and >50% Protein.

By Application:

This segment includes Growth Promotion, Performance Enhancement, Reproductive Health, Immune Support, and Feed Conversion Optimization.

By Sales Channel:

The segment is categorized into Direct Sales (Feed Mills, Farms), Distributors & Dealers, Online Channels, and Cooperatives.

Table of Content

  1. Executive Summary
    • Global Market Outlook
    • Demand-side Trends
    • Supply-side Trends
    • Technology Roadmap Analysis
    • Analysis and Recommendations
  2. Market Overview
    • Market Coverage / Taxonomy
    • Market Definition / Scope / Limitations
  3. Market Background
    • Market Dynamics
      • Drivers
      • Restraints
      • Opportunity
      • Trends
    • Scenario Forecast
      • Demand in Optimistic Scenario
      • Demand in Likely Scenario
      • Demand in Conservative Scenario
    • Opportunity Map Analysis
    • Product Life Cycle Analysis
    • Supply Chain Analysis
      • Supply Side Participants and their Roles
        • Producers
        • Mid-Level Participants (Traders/ Agents/ Brokers)
        • Wholesalers and Distributors
      • Value Added and Value Created at Node in the Supply Chain
      • List of Raw Material Suppliers
      • List of Existing and Potential Buyer’s
    • Investment Feasibility Matrix
    • Value Chain Analysis
      • Profit Margin Analysis
      • Wholesalers and Distributors
      • Retailers
    • PESTLE and Porter’s Analysis
    • Regulatory Landscape
      • By Key Regions
      • By Key Countries
    • Regional Parent Market Outlook
    • Production and Consumption Statistics
    • Import and Export Statistics
  4. Global Market Analysis 2020 to 2024 and Forecast, 2025 to 2035
    • Historical Market Size Value (USD Billion) & Volume (Mn MT) Analysis, 2020 to 2024
    • Current and Future Market Size Value (USD Billion) & Volume (Mn MT) Projections, 2025 to 2035
      • Y-o-Y Growth Trend Analysis
      • Absolute $ Opportunity Analysis
  5. Global Market Pricing Analysis 2020 to 2024 and Forecast 2025 to 2035
  6. Global Market Analysis 2020 to 2024 and Forecast 2025 to 2035, By Source
    • Introduction / Key Findings
    • Historical Market Size Value (USD Billion) & Volume (Mn MT) Analysis By Source, 2020 to 2024
    • Current and Future Market Size Value (USD Billion) & Volume (Mn MT) Analysis and Forecast By Source, 2025 to 2035
      • Plant-Based
        • Soybean Meal
        • Canola Meal
        • Sunflower Meal
        • Pea Protein
        • Cottonseed Meal
        • Lupin Meal
      • Animal-Based
        • Fish Meal
        • Meat & Bone Meal
        • Poultry By-product Meal
        • Blood Meal
        • Feather Meal
      • Algal & Fermentation-Based
        • Single Cell Protein (SCP)
        • Yeast-Derived Protein
        • Microalgae Protein
        • Mycoprotein
    • Y-o-Y Growth Trend Analysis By Source, 2020 to 2024
    • Absolute $ Opportunity Analysis By Source, 2025 to 2035
  7. Global Market Analysis 2020 to 2024 and Forecast 2025 to 2035, By Livestock Type
    • Introduction / Key Findings
    • Historical Market Size Value (USD Billion) & Volume (Mn MT) Analysis By Livestock Type, 2020 to 2024
    • Current and Future Market Size Value (USD Billion) & Volume (Mn MT) Analysis and Forecast By Livestock Type, 2025 to 2035
      • Poultry
      • Swine
      • Ruminants (Cattle, Sheep, Goat)
      • Aquaculture
      • Pet Food
      • Equine
      • Specialty Animals (Rabbit, etc.)
    • Y-o-Y Growth Trend Analysis By Livestock Type, 2020 to 2024
    • Absolute $ Opportunity Analysis By Livestock Type, 2025 to 2035
  8. Global Market Analysis 2020 to 2024 and Forecast 2025 to 2035, By Form
    • Introduction / Key Findings
    • Historical Market Size Value (USD Billion) & Volume (Mn MT) Analysis By Form, 2020 to 2024
    • Current and Future Market Size Value (USD Billion) & Volume (Mn MT) Analysis and Forecast By Form, 2025 to 2035
      • Pellets
      • Crumbles
      • Mash
      • Extruded
      • Liquid Concentrate
      • Powder/Meal
    • Y-o-Y Growth Trend Analysis By Form, 2020 to 2024
    • Absolute $ Opportunity Analysis By Form, 2025 to 2035
  9. Global Market Analysis 2020 to 2024 and Forecast 2025 to 2035, By Protein Concentration
    • Introduction / Key Findings
    • Historical Market Size Value (USD Billion) & Volume (Mn MT) Analysis By Protein Concentration, 2020 to 2024
    • Current and Future Market Size Value (USD Billion) & Volume (Mn MT) Analysis and Forecast By Protein Concentration, 2025 to 2035
      • <30% Protein
      • 30–50% Protein
      • 50% Protein
    • Y-o-Y Growth Trend Analysis By Protein Concentration, 2020 to 2024
    • Absolute $ Opportunity Analysis By Protein Concentration, 2025 to 2035
  10. Global Market Analysis 2020 to 2024 and Forecast 2025 to 2035, By Application
    • Introduction / Key Findings
    • Historical Market Size Value (USD Billion) & Volume (Mn MT) Analysis By Application, 2020 to 2024
    • Current and Future Market Size Value (USD Billion) & Volume (Mn MT) Analysis and Forecast By Application, 2025 to 2035
      • Growth Promotion
      • Performance Enhancement
      • Reproductive Health
      • Immune Support
      • Feed Conversion Optimization
    • Y-o-Y Growth Trend Analysis By Application, 2020 to 2024
    • Absolute $ Opportunity Analysis By Application, 2025 to 2035
  11. Global Market Analysis 2020 to 2024 and Forecast 2025 to 2035, By Sales Channel
    • Introduction / Key Findings
    • Historical Market Size Value (USD Billion) & Volume (Mn MT) Analysis By Sales Channel, 2020 to 2024
    • Current and Future Market Size Value (USD Billion) & Volume (Mn MT) Analysis and Forecast By Sales Channel, 2025 to 2035
      • Direct Sales (Feed Mills, Farms)
      • Distributors & Dealers
      • Online Channels
      • Cooperatives
    • Y-o-Y Growth Trend Analysis By Sales Channel, 2020 to 2024
    • Absolute $ Opportunity Analysis By Sales Channel, 2025 to 2035
  12. Global Market Analysis 2020 to 2024 and Forecast 2025 to 2035, By Region
    • Introduction
    • Historical Market Size Value (USD Billion) & Volume (Mn MT) Analysis By Region, 2020 to 2024
    • Current Market Size Value (USD Billion) & Volume (Mn MT) Analysis and Forecast By Region, 2025 to 2035
      • North America
      • Latin America
      • Western Europe
      • Eastern Europe
      • East Asia
      • South Asia & Pacific
      • Middle East and Africa
    • Market Attractiveness Analysis By Region
  13. North America Market Analysis 2020 to 2024 and Forecast 2025 to 2035, By Country
    • Historical Market Size Value (USD Billion) & Volume (Mn MT) Trend Analysis By Market Taxonomy, 2020 to 2024
    • Market Size Value (USD Billion) & Volume (Mn MT) Forecast By Market Taxonomy, 2025 to 2035
      • By Country
        • USA
        • Canada
        • Mexico
      • By Source
      • By Livestock Type
      • By Form
      • By Protein Concentration
      • By Application
      • By Sales Channel
    • Market Attractiveness Analysis
      • By Country
      • By Source
      • By Livestock Type
      • By Form
      • By Protein Concentration
      • By Application
      • By Sales Channel
    • Key Takeaways
  14. Latin America Market Analysis 2020 to 2024 and Forecast 2025 to 2035, By Country
    • Historical Market Size Value (USD Billion) & Volume (Mn MT) Trend Analysis By Market Taxonomy, 2020 to 2024
    • Market Size Value (USD Billion) & Volume (Mn MT) Forecast By Market Taxonomy, 2025 to 2035
      • By Country
        • Brazil
        • Argentina
        • Rest of LATAM
      • By Source
      • By Livestock Type
      • By Form
      • By Protein Concentration
      • By Application
      • By Sales Channel
    • Market Attractiveness Analysis
      • By Country
      • By Source
      • By Livestock Type
      • By Form
      • By Protein Concentration
      • By Application
      • By Sales Channel
    • Key Takeaways
  15. Western Europe Market Analysis 2020 to 2024 and Forecast 2025 to 2035, By Country
    • Historical Market Size Value (USD Billion) & Volume (Mn MT) Trend Analysis By Market Taxonomy, 2020 to 2024
    • Market Size Value (USD Billion) & Volume (Mn MT) Forecast By Market Taxonomy, 2025 to 2035
      • By Country
        • Germany
        • Italy
        • France
        • UK
        • Spain
        • BENELUX
        • Nordic
        • Rest of W.Europe
      • By Source
      • By Livestock Type
      • By Form
      • By Protein Concentration
      • By Application
      • By Sales Channel
    • Market Attractiveness Analysis
      • By Country
      • By Source
      • By Livestock Type
      • By Form
      • By Protein Concentration
      • By Application
      • By Sales Channel
    • Key Takeaways
  16. Eastern Europe Market Analysis 2020 to 2024 and Forecast 2025 to 2035, By Country
    • Historical Market Size Value (USD Billion) & Volume (Mn MT) Trend Analysis By Market Taxonomy, 2020 to 2024
    • Market Size Value (USD Billion) & Volume (Mn MT) Forecast By Market Taxonomy, 2025 to 2035
      • By Country
        • Russia
        • Hungary
        • Poland
        • Balkan & Baltics
        • Rest of E. Europe
      • By Source
      • By Livestock Type
      • By Form
      • By Protein Concentration
      • By Application
      • By Sales Channel
    • Market Attractiveness Analysis
      • By Country
      • By Source
      • By Livestock Type
      • By Form
      • By Protein Concentration
      • By Application
      • By Sales Channel
    • Key Takeaways
  17. East Asia Market Analysis 2020 to 2024 and Forecast 2025 to 2035, By Country
    • Historical Market Size Value (USD Billion) & Volume (Mn MT) Trend Analysis By Market Taxonomy, 2020 to 2024
    • Market Size Value (USD Billion) & Volume (Mn MT) Forecast By Market Taxonomy, 2025 to 2035
      • By Country
        • China
        • Japan
        • South Korea
      • By Source
      • By Livestock Type
      • By Form
      • By Protein Concentration
      • By Application
      • By Sales Channel
    • Market Attractiveness Analysis
      • By Country
      • By Source
      • By Livestock Type
      • By Form
      • By Protein Concentration
      • By Application
      • By Sales Channel
    • Key Takeaways
  18. South Asia & Pacific Market Analysis 2020 to 2024 and Forecast 2025 to 2035, By Country
    • Historical Market Size Value (USD Billion) & Volume (Mn MT) Trend Analysis By Market Taxonomy, 2020 to 2024
    • Market Size Value (USD Billion) & Volume (Mn MT) Forecast By Market Taxonomy, 2025 to 2035
      • By Country
        • India
        • Australia & New Zealand
        • ASEAN
        • Rest of SAP
      • By Source
      • By Livestock Type
      • By Form
      • By Protein Concentration
      • By Application
      • By Sales Channel
    • Market Attractiveness Analysis
      • By Country
      • By Source
      • By Livestock Type
      • By Form
      • By Protein Concentration
      • By Application
      • By Sales Channel
    • Key Takeaways
  19. Middle East and Africa Market Analysis 2020 to 2024 and Forecast 2025 to 2035, By Country
    • Historical Market Size Value (USD Billion) & Volume (Mn MT) Trend Analysis By Market Taxonomy, 2020 to 2024
    • Market Size Value (USD Billion) & Volume (Mn MT) Forecast By Market Taxonomy, 2025 to 2035
      • By Country
        • GCC Countries
        • Northern Africa
        • South Africa
        • Turkiye
        • Rest of MEA
      • By Source
      • By Livestock Type
      • By Form
      • By Protein Concentration
      • By Application
      • By Sales Channel
    • Market Attractiveness Analysis
      • By Country
      • By Source
      • By Livestock Type
      • By Form
      • By Protein Concentration
      • By Application
      • By Sales Channel
    • Key Takeaways
  20. Key Countries Market Analysis
    • USA
      • Pricing Analysis
      • Market Share Analysis, 2024
        • By Source
        • By Livestock Type
        • By Form
        • By Protein Concentration
        • By Application
        • By Sales Channel
    • Canada
      • Pricing Analysis
      • Market Share Analysis, 2024
        • By Source
        • By Livestock Type
        • By Form
        • By Protein Concentration
        • By Application
        • By Sales Channel
    • Brazil
      • Pricing Analysis
      • Market Share Analysis, 2024
        • By Source
        • By Livestock Type
        • By Form
        • By Protein Concentration
        • By Application
        • By Sales Channel
    • Mexico
      • Pricing Analysis
      • Market Share Analysis, 2024
        • By Source
        • By Livestock Type
        • By Form
        • By Protein Concentration
        • By Application
        • By Sales Channel
    • Argentina
      • Pricing Analysis
      • Market Share Analysis, 2024
        • By Source
        • By Livestock Type
        • By Form
        • By Protein Concentration
        • By Application
        • By Sales Channel
  21. Market Structure Analysis
    • Competition Dashboard
    • Competition Benchmarking
    • Market Share Analysis of Top Players
      • By Regional
      • By Source
      • By Livestock Type
      • By Form
      • By Protein Concentration
      • By Application
      • By Sales Channel
  22. Competition Analysis
    • Competition Deep Dive
      • Cargill Inc.
        • Overview
        • Product Portfolio
        • Profitability by Market Segments (Product/Age /Sales Channel/Region)
        • Sales Footprint
        • Strategy Overview
          • Marketing Strategy
          • Product Strategy
          • Channel Strategy
      • Archer Daniels Midland Company (ADM)
        • Overview
        • Product Portfolio
        • Profitability by Market Segments (Product/Age /Sales Channel/Region)
        • Sales Footprint
        • Strategy Overview
          • Marketing Strategy
          • Product Strategy
          • Channel Strategy
      • Nutreco (Skretting, Trouw Nutrition)
        • Overview
        • Product Portfolio
        • Profitability by Market Segments (Product/Age /Sales Channel/Region)
        • Sales Footprint
        • Strategy Overview
          • Marketing Strategy
          • Product Strategy
          • Channel Strategy
      • Alltech Inc.
        • Overview
        • Product Portfolio
        • Profitability by Market Segments (Product/Age /Sales Channel/Region)
        • Sales Footprint
        • Strategy Overview
          • Marketing Strategy
          • Product Strategy
          • Channel Strategy
      • Ridley Corporation (Agribrands Purina, Mitsui)
        • Overview
        • Product Portfolio
        • Profitability by Market Segments (Product/Age /Sales Channel/Region)
        • Sales Footprint
        • Strategy Overview
          • Marketing Strategy
          • Product Strategy
          • Channel Strategy
  23. Assumptions & Acronyms Used
  24. Research Methodology

List of Tables

  • Table 1: Global Market Value (USD Billion) Forecast by Region, 2020-2035
  • Table 2: Global Market Volume (Mn MT) Forecast by Region, 2020-2035
  • Table 3: Global Market Value (USD Billion) Forecast by Source, 2020-2035
  • Table 4: Global Market Volume (Mn MT) Forecast by Source, 2020-2035
  • Table 5: Global Market Value (USD Billion) Forecast by Livestock Type, 2020-2035
  • Table 6: Global Market Volume (Mn MT) Forecast by Livestock Type, 2020-2035
  • Table 7: Global Market Value (USD Billion) Forecast by Form, 2020-2035
  • Table 8: Global Market Volume (Mn MT) Forecast by Form, 2020-2035
  • Table 9: Global Market Value (USD Billion) Forecast by Protein Concentration, 2020-2035
  • Table 10: Global Market Volume (Mn MT) Forecast by Protein Concentration, 2020-2035
  • Table 11: Global Market Value (USD Billion) Forecast by Application, 2020-2035
  • Table 12: Global Market Volume (Mn MT) Forecast by Application, 2020-2035
  • Table 13: Global Market Value (USD Billion) Forecast by Sales Channel, 2020-2035
  • Table 14: Global Market Volume (Mn MT) Forecast by Sales Channel, 2020-2035
  • Table 15: North America Market Value (USD Billion) Forecast by Country, 2020-2035
  • Table 16: North America Market Volume (Mn MT) Forecast by Country, 2020-2035
  • Table 17: North America Market Value (USD Billion) Forecast by Source, 2020-2035
  • Table 18: North America Market Volume (Mn MT) Forecast by Source, 2020-2035
  • Table 19: North America Market Value (USD Billion) Forecast by Livestock Type, 2020-2035
  • Table 20: North America Market Volume (Mn MT) Forecast by Livestock Type, 2020-2035
  • Table 21: North America Market Value (USD Billion) Forecast by Form, 2020-2035
  • Table 22: North America Market Volume (Mn MT) Forecast by Form, 2020-2035
  • Table 23: North America Market Value (USD Billion) Forecast by Protein Concentration, 2020-2035
  • Table 24: North America Market Volume (Mn MT) Forecast by Protein Concentration, 2020-2035
  • Table 25: North America Market Value (USD Billion) Forecast by Application, 2020-2035
  • Table 26: North America Market Volume (Mn MT) Forecast by Application, 2020-2035
  • Table 27: North America Market Value (USD Billion) Forecast by Sales Channel, 2020-2035
  • Table 28: North America Market Volume (Mn MT) Forecast by Sales Channel, 2020-2035
  • Table 29: Latin America Market Value (USD Billion) Forecast by Country, 2020-2035
  • Table 30: Latin America Market Volume (Mn MT) Forecast by Country, 2020-2035
  • Table 31: Latin America Market Value (USD Billion) Forecast by Source, 2020-2035
  • Table 32: Latin America Market Volume (Mn MT) Forecast by Source, 2020-2035
  • Table 33: Latin America Market Value (USD Billion) Forecast by Livestock Type, 2020-2035
  • Table 34: Latin America Market Volume (Mn MT) Forecast by Livestock Type, 2020-2035
  • Table 35: Latin America Market Value (USD Billion) Forecast by Form, 2020-2035
  • Table 36: Latin America Market Volume (Mn MT) Forecast by Form, 2020-2035
  • Table 37: Latin America Market Value (USD Billion) Forecast by Protein Concentration, 2020-2035
  • Table 38: Latin America Market Volume (Mn MT) Forecast by Protein Concentration, 2020-2035
  • Table 39: Latin America Market Value (USD Billion) Forecast by Application, 2020-2035
  • Table 40: Latin America Market Volume (Mn MT) Forecast by Application, 2020-2035
  • Table 41: Latin America Market Value (USD Billion) Forecast by Sales Channel, 2020-2035
  • Table 42: Latin America Market Volume (Mn MT) Forecast by Sales Channel, 2020-2035
  • Table 43: Western Europe Market Value (USD Billion) Forecast by Country, 2020-2035
  • Table 44: Western Europe Market Volume (Mn MT) Forecast by Country, 2020-2035
  • Table 45: Western Europe Market Value (USD Billion) Forecast by Source, 2020-2035
  • Table 46: Western Europe Market Volume (Mn MT) Forecast by Source, 2020-2035
  • Table 47: Western Europe Market Value (USD Billion) Forecast by Livestock Type, 2020-2035
  • Table 48: Western Europe Market Volume (Mn MT) Forecast by Livestock Type, 2020-2035
  • Table 49: Western Europe Market Value (USD Billion) Forecast by Form, 2020-2035
  • Table 50: Western Europe Market Volume (Mn MT) Forecast by Form, 2020-2035
  • Table 51: Western Europe Market Value (USD Billion) Forecast by Protein Concentration, 2020-2035
  • Table 52: Western Europe Market Volume (Mn MT) Forecast by Protein Concentration, 2020-2035
  • Table 53: Western Europe Market Value (USD Billion) Forecast by Application, 2020-2035
  • Table 54: Western Europe Market Volume (Mn MT) Forecast by Application, 2020-2035
  • Table 55: Western Europe Market Value (USD Billion) Forecast by Sales Channel, 2020-2035
  • Table 56: Western Europe Market Volume (Mn MT) Forecast by Sales Channel, 2020-2035
  • Table 57: Eastern Europe Market Value (USD Billion) Forecast by Country, 2020-2035
  • Table 58: Eastern Europe Market Volume (Mn MT) Forecast by Country, 2020-2035
  • Table 59: Eastern Europe Market Value (USD Billion) Forecast by Source, 2020-2035
  • Table 60: Eastern Europe Market Volume (Mn MT) Forecast by Source, 2020-2035
  • Table 61: Eastern Europe Market Value (USD Billion) Forecast by Livestock Type, 2020-2035
  • Table 62: Eastern Europe Market Volume (Mn MT) Forecast by Livestock Type, 2020-2035
  • Table 63: Eastern Europe Market Value (USD Billion) Forecast by Form, 2020-2035
  • Table 64: Eastern Europe Market Volume (Mn MT) Forecast by Form, 2020-2035
  • Table 65: Eastern Europe Market Value (USD Billion) Forecast by Protein Concentration, 2020-2035
  • Table 66: Eastern Europe Market Volume (Mn MT) Forecast by Protein Concentration, 2020-2035
  • Table 67: Eastern Europe Market Value (USD Billion) Forecast by Application, 2020-2035
  • Table 68: Eastern Europe Market Volume (Mn MT) Forecast by Application, 2020-2035
  • Table 69: Eastern Europe Market Value (USD Billion) Forecast by Sales Channel, 2020-2035
  • Table 70: Eastern Europe Market Volume (Mn MT) Forecast by Sales Channel, 2020-2035
  • Table 71: East Asia Market Value (USD Billion) Forecast by Country, 2020-2035
  • Table 72: East Asia Market Volume (Mn MT) Forecast by Country, 2020-2035
  • Table 73: East Asia Market Value (USD Billion) Forecast by Source, 2020-2035
  • Table 74: East Asia Market Volume (Mn MT) Forecast by Source, 2020-2035
  • Table 75: East Asia Market Value (USD Billion) Forecast by Livestock Type, 2020-2035
  • Table 76: East Asia Market Volume (Mn MT) Forecast by Livestock Type, 2020-2035
  • Table 77: East Asia Market Value (USD Billion) Forecast by Form, 2020-2035
  • Table 78: East Asia Market Volume (Mn MT) Forecast by Form, 2020-2035
  • Table 79: East Asia Market Value (USD Billion) Forecast by Protein Concentration, 2020-2035
  • Table 80: East Asia Market Volume (Mn MT) Forecast by Protein Concentration, 2020-2035
  • Table 81: East Asia Market Value (USD Billion) Forecast by Application, 2020-2035
  • Table 82: East Asia Market Volume (Mn MT) Forecast by Application, 2020-2035
  • Table 83: East Asia Market Value (USD Billion) Forecast by Sales Channel, 2020-2035
  • Table 84: East Asia Market Volume (Mn MT) Forecast by Sales Channel, 2020-2035
  • Table 85: South Asia & Pacific Market Value (USD Billion) Forecast by Country, 2020-2035
  • Table 86: South Asia & Pacific Market Volume (Mn MT) Forecast by Country, 2020-2035
  • Table 87: South Asia & Pacific Market Value (USD Billion) Forecast by Source, 2020-2035
  • Table 88: South Asia & Pacific Market Volume (Mn MT) Forecast by Source, 2020-2035
  • Table 89: South Asia & Pacific Market Value (USD Billion) Forecast by Livestock Type, 2020-2035
  • Table 90: South Asia & Pacific Market Volume (Mn MT) Forecast by Livestock Type, 2020-2035
  • Table 91: South Asia & Pacific Market Value (USD Billion) Forecast by Form, 2020-2035
  • Table 92: South Asia & Pacific Market Volume (Mn MT) Forecast by Form, 2020-2035
  • Table 93: South Asia & Pacific Market Value (USD Billion) Forecast by Protein Concentration, 2020-2035
  • Table 94: South Asia & Pacific Market Volume (Mn MT) Forecast by Protein Concentration, 2020-2035
  • Table 95: South Asia & Pacific Market Value (USD Billion) Forecast by Application, 2020-2035
  • Table 96: South Asia & Pacific Market Volume (Mn MT) Forecast by Application, 2020-2035
  • Table 97: South Asia & Pacific Market Value (USD Billion) Forecast by Sales Channel, 2020-2035
  • Table 98: South Asia & Pacific Market Volume (Mn MT) Forecast by Sales Channel, 2020-2035
  • Table 99: Middle East and Africa Market Value (USD Billion) Forecast by Country, 2020-2035
  • Table 100: Middle East and Africa Market Volume (Mn MT) Forecast by Country, 2020-2035
  • Table 101: Middle East and Africa Market Value (USD Billion) Forecast by Source, 2020-2035
  • Table 102: Middle East and Africa Market Volume (Mn MT) Forecast by Source, 2020-2035
  • Table 103: Middle East and Africa Market Value (USD Billion) Forecast by Livestock Type, 2020-2035
  • Table 104: Middle East and Africa Market Volume (Mn MT) Forecast by Livestock Type, 2020-2035
  • Table 105: Middle East and Africa Market Value (USD Billion) Forecast by Form, 2020-2035
  • Table 106: Middle East and Africa Market Volume (Mn MT) Forecast by Form, 2020-2035
  • Table 107: Middle East and Africa Market Value (USD Billion) Forecast by Protein Concentration, 2020-2035
  • Table 108: Middle East and Africa Market Volume (Mn MT) Forecast by Protein Concentration, 2020-2035
  • Table 109: Middle East and Africa Market Value (USD Billion) Forecast by Application, 2020-2035
  • Table 110: Middle East and Africa Market Volume (Mn MT) Forecast by Application, 2020-2035
  • Table 111: Middle East and Africa Market Value (USD Billion) Forecast by Sales Channel, 2020-2035
  • Table 112: Middle East and Africa Market Volume (Mn MT) Forecast by Sales Channel, 2020-2035

List of Figures

  • Figure 1: Global Market Volume (Mn MT) Forecast 2020-2035
  • Figure 2: Global Market Pricing Analysis
  • Figure 3: Global Market Value (USD Billion) Forecast 2020-2035
  • Figure 4: Global Market Value Share and BPS Analysis by Source, 2025 and 2035
  • Figure 5: Global Market Y-o-Y Growth Comparison by Source, 2025-2035
  • Figure 6: Global Market Attractiveness Analysis by Source
  • Figure 7: Global Market Value Share and BPS Analysis by Livestock Type, 2025 and 2035
  • Figure 8: Global Market Y-o-Y Growth Comparison by Livestock Type, 2025-2035
  • Figure 9: Global Market Attractiveness Analysis by Livestock Type
  • Figure 10: Global Market Value Share and BPS Analysis by Form, 2025 and 2035
  • Figure 11: Global Market Y-o-Y Growth Comparison by Form, 2025-2035
  • Figure 12: Global Market Attractiveness Analysis by Form
  • Figure 13: Global Market Value Share and BPS Analysis by Protein Concentration, 2025 and 2035
  • Figure 14: Global Market Y-o-Y Growth Comparison by Protein Concentration, 2025-2035
  • Figure 15: Global Market Attractiveness Analysis by Protein Concentration
  • Figure 16: Global Market Value Share and BPS Analysis by Application, 2025 and 2035
  • Figure 17: Global Market Y-o-Y Growth Comparison by Application, 2025-2035
  • Figure 18: Global Market Attractiveness Analysis by Application
  • Figure 19: Global Market Value Share and BPS Analysis by Sales Channel, 2025 and 2035
  • Figure 20: Global Market Y-o-Y Growth Comparison by Sales Channel, 2025-2035
  • Figure 21: Global Market Attractiveness Analysis by Sales Channel
  • Figure 22: Global Market Value (USD Billion) Share and BPS Analysis by Region, 2025 and 2035
  • Figure 23: Global Market Y-o-Y Growth Comparison by Region, 2025-2035
  • Figure 24: Global Market Attractiveness Analysis by Region
  • Figure 25: North America Market Incremental $ Opportunity, 2025-2035
  • Figure 26: Latin America Market Incremental $ Opportunity, 2025-2035
  • Figure 27: Western Europe Market Incremental $ Opportunity, 2025-2035
  • Figure 28: Eastern Europe Market Incremental $ Opportunity, 2025-2035
  • Figure 29: East Asia Market Incremental $ Opportunity, 2025-2035
  • Figure 30: South Asia & Pacific Market Incremental $ Opportunity, 2025-2035
  • Figure 31: Middle East and Africa Market Incremental $ Opportunity, 2025-2035
  • Figure 32: North America Market Value Share and BPS Analysis by Country, 2025 and 2035
  • Figure 33: North America Market Value Share and BPS Analysis by Source, 2025 and 2035
  • Figure 34: North America Market Y-o-Y Growth Comparison by Source, 2025-2035
  • Figure 35: North America Market Attractiveness Analysis by Source
  • Figure 36: North America Market Value Share and BPS Analysis by Livestock Type, 2025 and 2035
  • Figure 37: North America Market Y-o-Y Growth Comparison by Livestock Type, 2025-2035
  • Figure 38: North America Market Attractiveness Analysis by Livestock Type
  • Figure 39: North America Market Value Share and BPS Analysis by Form, 2025 and 2035
  • Figure 40: North America Market Y-o-Y Growth Comparison by Form, 2025-2035
  • Figure 41: North America Market Attractiveness Analysis by Form
  • Figure 42: North America Market Value Share and BPS Analysis by Protein Concentration, 2025 and 2035
  • Figure 43: North America Market Y-o-Y Growth Comparison by Protein Concentration, 2025-2035
  • Figure 44: North America Market Attractiveness Analysis by Protein Concentration
  • Figure 45: North America Market Value Share and BPS Analysis by Application, 2025 and 2035
  • Figure 46: North America Market Y-o-Y Growth Comparison by Application, 2025-2035
  • Figure 47: North America Market Attractiveness Analysis by Application
  • Figure 48: North America Market Value Share and BPS Analysis by Sales Channel, 2025 and 2035
  • Figure 49: North America Market Y-o-Y Growth Comparison by Sales Channel, 2025-2035
  • Figure 50: North America Market Attractiveness Analysis by Sales Channel
  • Figure 51: Latin America Market Value Share and BPS Analysis by Country, 2025 and 2035
  • Figure 52: Latin America Market Value Share and BPS Analysis by Source, 2025 and 2035
  • Figure 53: Latin America Market Y-o-Y Growth Comparison by Source, 2025-2035
  • Figure 54: Latin America Market Attractiveness Analysis by Source
  • Figure 55: Latin America Market Value Share and BPS Analysis by Livestock Type, 2025 and 2035
  • Figure 56: Latin America Market Y-o-Y Growth Comparison by Livestock Type, 2025-2035
  • Figure 57: Latin America Market Attractiveness Analysis by Livestock Type
  • Figure 58: Latin America Market Value Share and BPS Analysis by Form, 2025 and 2035
  • Figure 59: Latin America Market Y-o-Y Growth Comparison by Form, 2025-2035
  • Figure 60: Latin America Market Attractiveness Analysis by Form
  • Figure 61: Latin America Market Value Share and BPS Analysis by Protein Concentration, 2025 and 2035
  • Figure 62: Latin America Market Y-o-Y Growth Comparison by Protein Concentration, 2025-2035
  • Figure 63: Latin America Market Attractiveness Analysis by Protein Concentration
  • Figure 64: Latin America Market Value Share and BPS Analysis by Application, 2025 and 2035
  • Figure 65: Latin America Market Y-o-Y Growth Comparison by Application, 2025-2035
  • Figure 66: Latin America Market Attractiveness Analysis by Application
  • Figure 67: Latin America Market Value Share and BPS Analysis by Sales Channel, 2025 and 2035
  • Figure 68: Latin America Market Y-o-Y Growth Comparison by Sales Channel, 2025-2035
  • Figure 69: Latin America Market Attractiveness Analysis by Sales Channel
  • Figure 70: Western Europe Market Value Share and BPS Analysis by Country, 2025 and 2035
  • Figure 71: Western Europe Market Value Share and BPS Analysis by Source, 2025 and 2035
  • Figure 72: Western Europe Market Y-o-Y Growth Comparison by Source, 2025-2035
  • Figure 73: Western Europe Market Attractiveness Analysis by Source
  • Figure 74: Western Europe Market Value Share and BPS Analysis by Livestock Type, 2025 and 2035
  • Figure 75: Western Europe Market Y-o-Y Growth Comparison by Livestock Type, 2025-2035
  • Figure 76: Western Europe Market Attractiveness Analysis by Livestock Type
  • Figure 77: Western Europe Market Value Share and BPS Analysis by Form, 2025 and 2035
  • Figure 78: Western Europe Market Y-o-Y Growth Comparison by Form, 2025-2035
  • Figure 79: Western Europe Market Attractiveness Analysis by Form
  • Figure 80: Western Europe Market Value Share and BPS Analysis by Protein Concentration, 2025 and 2035
  • Figure 81: Western Europe Market Y-o-Y Growth Comparison by Protein Concentration, 2025-2035
  • Figure 82: Western Europe Market Attractiveness Analysis by Protein Concentration
  • Figure 83: Western Europe Market Value Share and BPS Analysis by Application, 2025 and 2035
  • Figure 84: Western Europe Market Y-o-Y Growth Comparison by Application, 2025-2035
  • Figure 85: Western Europe Market Attractiveness Analysis by Application
  • Figure 86: Western Europe Market Value Share and BPS Analysis by Sales Channel, 2025 and 2035
  • Figure 87: Western Europe Market Y-o-Y Growth Comparison by Sales Channel, 2025-2035
  • Figure 88: Western Europe Market Attractiveness Analysis by Sales Channel
  • Figure 89: Eastern Europe Market Value Share and BPS Analysis by Country, 2025 and 2035
  • Figure 90: Eastern Europe Market Value Share and BPS Analysis by Source, 2025 and 2035
  • Figure 91: Eastern Europe Market Y-o-Y Growth Comparison by Source, 2025-2035
  • Figure 92: Eastern Europe Market Attractiveness Analysis by Source
  • Figure 93: Eastern Europe Market Value Share and BPS Analysis by Livestock Type, 2025 and 2035
  • Figure 94: Eastern Europe Market Y-o-Y Growth Comparison by Livestock Type, 2025-2035
  • Figure 95: Eastern Europe Market Attractiveness Analysis by Livestock Type
  • Figure 96: Eastern Europe Market Value Share and BPS Analysis by Form, 2025 and 2035
  • Figure 97: Eastern Europe Market Y-o-Y Growth Comparison by Form, 2025-2035
  • Figure 98: Eastern Europe Market Attractiveness Analysis by Form
  • Figure 99: Eastern Europe Market Value Share and BPS Analysis by Protein Concentration, 2025 and 2035
  • Figure 100: Eastern Europe Market Y-o-Y Growth Comparison by Protein Concentration, 2025-2035
  • Figure 101: Eastern Europe Market Attractiveness Analysis by Protein Concentration
  • Figure 102: Eastern Europe Market Value Share and BPS Analysis by Application, 2025 and 2035
  • Figure 103: Eastern Europe Market Y-o-Y Growth Comparison by Application, 2025-2035
  • Figure 104: Eastern Europe Market Attractiveness Analysis by Application
  • Figure 105: Eastern Europe Market Value Share and BPS Analysis by Sales Channel, 2025 and 2035
  • Figure 106: Eastern Europe Market Y-o-Y Growth Comparison by Sales Channel, 2025-2035
  • Figure 107: Eastern Europe Market Attractiveness Analysis by Sales Channel
  • Figure 108: East Asia Market Value Share and BPS Analysis by Country, 2025 and 2035
  • Figure 109: East Asia Market Value Share and BPS Analysis by Source, 2025 and 2035
  • Figure 110: East Asia Market Y-o-Y Growth Comparison by Source, 2025-2035
  • Figure 111: East Asia Market Attractiveness Analysis by Source
  • Figure 112: East Asia Market Value Share and BPS Analysis by Livestock Type, 2025 and 2035
  • Figure 113: East Asia Market Y-o-Y Growth Comparison by Livestock Type, 2025-2035
  • Figure 114: East Asia Market Attractiveness Analysis by Livestock Type
  • Figure 115: East Asia Market Value Share and BPS Analysis by Form, 2025 and 2035
  • Figure 116: East Asia Market Y-o-Y Growth Comparison by Form, 2025-2035
  • Figure 117: East Asia Market Attractiveness Analysis by Form
  • Figure 118: East Asia Market Value Share and BPS Analysis by Protein Concentration, 2025 and 2035
  • Figure 119: East Asia Market Y-o-Y Growth Comparison by Protein Concentration, 2025-2035
  • Figure 120: East Asia Market Attractiveness Analysis by Protein Concentration
  • Figure 121: East Asia Market Value Share and BPS Analysis by Application, 2025 and 2035
  • Figure 122: East Asia Market Y-o-Y Growth Comparison by Application, 2025-2035
  • Figure 123: East Asia Market Attractiveness Analysis by Application
  • Figure 124: East Asia Market Value Share and BPS Analysis by Sales Channel, 2025 and 2035
  • Figure 125: East Asia Market Y-o-Y Growth Comparison by Sales Channel, 2025-2035
  • Figure 126: East Asia Market Attractiveness Analysis by Sales Channel
  • Figure 127: South Asia & Pacific Market Value Share and BPS Analysis by Country, 2025 and 2035
  • Figure 128: South Asia & Pacific Market Value Share and BPS Analysis by Source, 2025 and 2035
  • Figure 129: South Asia & Pacific Market Y-o-Y Growth Comparison by Source, 2025-2035
  • Figure 130: South Asia & Pacific Market Attractiveness Analysis by Source
  • Figure 131: South Asia & Pacific Market Value Share and BPS Analysis by Livestock Type, 2025 and 2035
  • Figure 132: South Asia & Pacific Market Y-o-Y Growth Comparison by Livestock Type, 2025-2035
  • Figure 133: South Asia & Pacific Market Attractiveness Analysis by Livestock Type
  • Figure 134: South Asia & Pacific Market Value Share and BPS Analysis by Form, 2025 and 2035
  • Figure 135: South Asia & Pacific Market Y-o-Y Growth Comparison by Form, 2025-2035
  • Figure 136: South Asia & Pacific Market Attractiveness Analysis by Form
  • Figure 137: South Asia & Pacific Market Value Share and BPS Analysis by Protein Concentration, 2025 and 2035
  • Figure 138: South Asia & Pacific Market Y-o-Y Growth Comparison by Protein Concentration, 2025-2035
  • Figure 139: South Asia & Pacific Market Attractiveness Analysis by Protein Concentration
  • Figure 140: South Asia & Pacific Market Value Share and BPS Analysis by Application, 2025 and 2035
  • Figure 141: South Asia & Pacific Market Y-o-Y Growth Comparison by Application, 2025-2035
  • Figure 142: South Asia & Pacific Market Attractiveness Analysis by Application
  • Figure 143: South Asia & Pacific Market Value Share and BPS Analysis by Sales Channel, 2025 and 2035
  • Figure 144: South Asia & Pacific Market Y-o-Y Growth Comparison by Sales Channel, 2025-2035
  • Figure 145: South Asia & Pacific Market Attractiveness Analysis by Sales Channel
  • Figure 146: Middle East and Africa Market Value Share and BPS Analysis by Country, 2025 and 2035
  • Figure 147: Middle East and Africa Market Value Share and BPS Analysis by Source, 2025 and 2035
  • Figure 148: Middle East and Africa Market Y-o-Y Growth Comparison by Source, 2025-2035
  • Figure 149: Middle East and Africa Market Attractiveness Analysis by Source
  • Figure 150: Middle East and Africa Market Value Share and BPS Analysis by Livestock Type, 2025 and 2035
  • Figure 151: Middle East and Africa Market Y-o-Y Growth Comparison by Livestock Type, 2025-2035
  • Figure 152: Middle East and Africa Market Attractiveness Analysis by Livestock Type
  • Figure 153: Middle East and Africa Market Value Share and BPS Analysis by Form, 2025 and 2035
  • Figure 154: Middle East and Africa Market Y-o-Y Growth Comparison by Form, 2025-2035
  • Figure 155: Middle East and Africa Market Attractiveness Analysis by Form
  • Figure 156: Middle East and Africa Market Value Share and BPS Analysis by Protein Concentration, 2025 and 2035
  • Figure 157: Middle East and Africa Market Y-o-Y Growth Comparison by Protein Concentration, 2025-2035
  • Figure 158: Middle East and Africa Market Attractiveness Analysis by Protein Concentration
  • Figure 159: Middle East and Africa Market Value Share and BPS Analysis by Application, 2025 and 2035
  • Figure 160: Middle East and Africa Market Y-o-Y Growth Comparison by Application, 2025-2035
  • Figure 161: Middle East and Africa Market Attractiveness Analysis by Application
  • Figure 162: Middle East and Africa Market Value Share and BPS Analysis by Sales Channel, 2025 and 2035
  • Figure 163: Middle East and Africa Market Y-o-Y Growth Comparison by Sales Channel, 2025-2035
  • Figure 164: Middle East and Africa Market Attractiveness Analysis by Sales Channel
  • Figure 165: Global Market - Tier Structure Analysis
  • Figure 166: Global Market - Company Share Analysis

Frequently Asked Questions

What is the projected industry value of the high-protein feed market in 2025?

The industry is projected to reach USD 25.6 billion in 2025.

What is the expected global CAGR for the high-protein feed market from 2025 to 2035?

The industry is expected to grow at a CAGR of 3.3% from 2025 to 2035.

Which segment is expected to dominate the high-protein feed market in 2025?

Soybean meal is expected to lead with 39% share in 2025.

Which region is forecasted to show significant growth in the high-protein feed market by 2035?

South Asia & Pacific, especially India, is projected to show leading growth at 3.6% CAGR.

What is the forecasted industry value of the high-protein feed market by 2035?

The industry is projected to reach USD 35.4 billion by 2035.

Explore Similar Insights

Future Market Insights

High-Protein Feed Market