The Window Air Conditioner Market is estimated to be valued at USD 37.5 billion in 2025 and is projected to reach USD 63.6 billion by 2035, registering a compound annual growth rate (CAGR) of 5.4% over the forecast period.
The window air conditioner market is experiencing consistent growth due to rising urbanization, increasing disposable incomes, and growing demand for energy-efficient cooling solutions. Current market conditions reflect heightened consumer preference for compact, cost-effective air conditioning units suitable for small to mid-sized residential spaces. Manufacturers are emphasizing advancements in compressor technology, smart control integration, and refrigerant efficiency to meet sustainability standards and reduce operating costs.
Regulatory frameworks promoting energy conservation are further accelerating adoption. The future outlook is supported by rapid expansion in residential construction, rising replacement demand, and improving electricity access across emerging economies.
Growth rationale is anchored in the product’s balance of affordability, convenience, and operational efficiency Continuous improvements in design aesthetics, noise reduction, and digital features are enhancing consumer appeal, ensuring steady market penetration and long-term demand stability across both developed and developing regions.
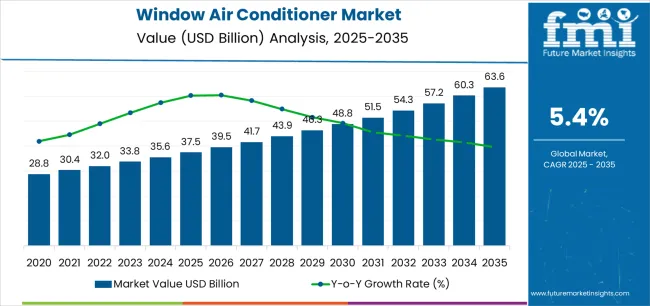
| Metric | Value |
|---|---|
| Window Air Conditioner Market Estimated Value in (2025 E) | USD 37.5 billion |
| Window Air Conditioner Market Forecast Value in (2035 F) | USD 63.6 billion |
| Forecast CAGR (2025 to 2035) | 5.4% |
The market is segmented by BTU Range, Technology, Application, and Distribution Channel and region. By BTU Range, the market is divided into 8,000 to 12,000 BTU, 5,000 to 8,000 BTU, and 12,000 to 24,000 BTU. In terms of Technology, the market is classified into Automatic, Semi-Automatic, and Manual. Based on Application, the market is segmented into Residential, Commercial Offices And Retail, and Industrial. By Distribution Channel, the market is divided into Indirect Sales, Direct Sales, and Other. Regionally, the market is classified into North America, Latin America, Western Europe, Eastern Europe, Balkan & Baltic Countries, Russia & Belarus, Central Asia, East Asia, South Asia & Pacific, and the Middle East & Africa.
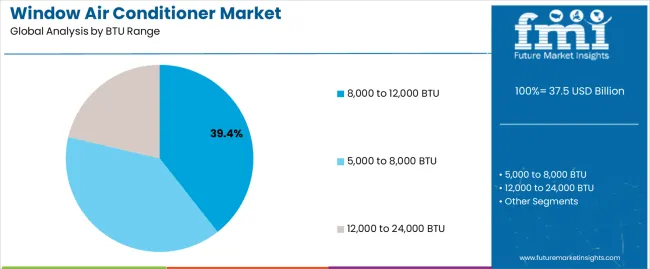
The 8,000 to 12,000 BTU segment, holding 39.40% of the BTU range category, has been leading due to its optimal cooling capacity for standard-sized residential rooms and small commercial setups. Its dominance is attributed to the ideal balance between energy efficiency and performance, meeting the comfort requirements of average household spaces.
Manufacturers are prioritizing this range due to high sales volumes, simplified installation, and compatibility with standard electrical configurations. Advancements in inverter technology and eco-friendly refrigerants have enhanced unit efficiency and reduced environmental impact.
The segment continues to benefit from rising middle-class adoption, particularly in densely populated urban centers, and is expected to sustain its lead as affordability and efficiency remain top purchasing criteria for consumers in the cooling appliances market.
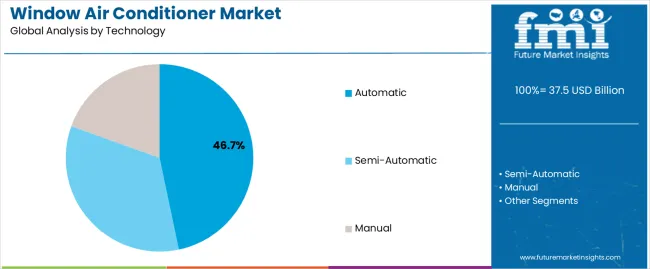
The automatic technology segment, accounting for 46.70% of the technology category, has emerged as the leading type due to increasing consumer inclination toward convenience-driven and energy-optimized appliances. Integration of automatic temperature control, self-diagnosis, and smart sensor features has strengthened product performance and user experience.
Market preference for low-maintenance, intelligent systems that adjust operation based on ambient conditions has reinforced adoption across residential and light commercial sectors. Technological advancements enabling remote operation and smart connectivity through mobile applications have expanded appeal among tech-savvy consumers.
Energy savings achieved through automatic functionality are aligning with regulatory and environmental goals, further supporting market growth Continuous innovation in control algorithms and integration with home automation systems is expected to sustain the segment’s dominance in the forecast period.
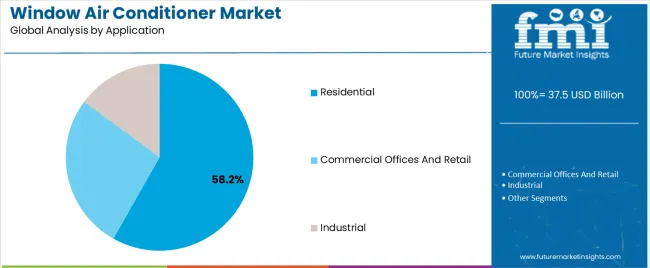
The residential segment, representing 58.20% of the application category, has maintained its leadership owing to extensive usage of window air conditioners in households and apartments where space efficiency and affordability are key considerations. Growing urban population, rising temperatures, and the need for accessible cooling solutions have fueled demand.
The segment’s prominence is reinforced by product versatility, ease of installation, and limited maintenance requirements. Increasing replacement cycles and preference for compact cooling units among tenants and homeowners have supported consistent sales.
Manufacturers are catering to this segment through design innovations, quieter operation, and smart feature integration, enhancing comfort and energy management Expanding distribution through e-commerce platforms and retail chains is ensuring wider accessibility, and continuous residential construction growth is expected to further strengthen the segment’s market share over the coming years.
This study examines the window air conditioner market's growth over the past five years, revealing a historical CAGR of 4.3% and a projected 5.7% CAGR growth up to 2035, indicating a growing trend in the window air conditioner market.
| Attributes | Details |
|---|---|
| Window Air Conditioner Market Historical CAGR for 2020 to 2025 | 4.3% |
The global window air conditioner market's growth is anticipated to be hindered by rising competition from alternative cooling solutions, regulatory challenges related to energy efficiency and environmental regulations, and economic downturns and fluctuations impacting consumer spending on discretionary items.
Critical aspects that are anticipated to influence the demand for window air conditioners through 2035.
Market players are going to desire to be prudent and flexible over the anticipated period since these challenging attributes position the industry for accomplishment in subsequent decades.
Rising Demand for Smart Window AC Skyrockets the Window Air Conditioner Market
Woke Global Populace Demand for the Eco-Logical Alternatives
AC Units Featuring High-Quality IAQ Preferred by Multiple Industries
This section offers in-depth analyses of particular window air conditioner market sectors. The two main topics of the research are the segment with commercial applications and the direct sales segment as a sales channel. Through a comprehensive examination, this section attempts to provide a fuller knowledge of these segments and their relevance in the larger context of the window air conditioner market.
| Attributes | Details |
|---|---|
| Top Application | Commercial |
| Market share in 2025 | 40.5% |
The demand for window air conditioners in commercial applications such as offices and retail stores is significant, registering a market share of 40.5% in 2025; the following aspects display the development of window air conditioner commercial applications:
| Attributes | Details |
|---|---|
| Top Sales Channel | Direct Sales |
| Market share in 2025 | 38.9% |
The direct sales of the window air conditioner acquire a 38.9% market share in 2025. The development of direct sales of the window air conditioner from the following drivers:
This section anticipates examining the markets for window air conditioners in some of the most important countries on the global stage, such as the United States, China, India, Japan, and the United Kingdom. Through in-depth research, explore the several aspects influencing these nations' acceptability and demand for window AC units.
| Countries | CAGR from 2025 to 2035 |
|---|---|
| United States | 3.1% |
| United Kingdom | 2.1% |
| China | 9.7% |
| Japan | 7.4% |
| India | 10.5% |
The United States industrial sector is developing the demand for window air conditioners with a CAGR of 3.1% from 2025 to 2035. Here are a few of the major trends:
Demand for window air conditioners in the United Kingdom is expected to develop at a CAGR of 2.1%. The following factors are propelling the demand for window air conditioners in the construction sector:
China demands technological development in window air conditioners, and the demand for window air conditioners is predicted to extend at a CAGR of 9.7% between 2025 and 2035. Some of the primary trends in the industry are:
The demand for window air conditioners in India is expected to register a CAGR of 10.5% from 2025 to 2035. Some of the primary trends are:
The window air conditioner industry in Japan is expected to register a CAGR of 7.4% by 2035. Among the primary drivers are:
The global window air conditioner market is shaped by various market players, including manufacturers, distributors, retailers, and service providers. Manufacturers drive market growth by investing in research and development and introducing new technologies, features, and product designs that cater to consumer preferences and trends.
Companies focus on improving energy efficiency and cooling performance and incorporating smart features like Wi-Fi connectivity, remote control, and voice activation to gain a competitive edge.
Distributors and retailers are crucial in expanding market reach by ensuring product availability, accessibility, and visibility across various channels like online platforms, specialty stores, department stores, and home improvement centers. The corporations use marketing strategies to boost consumer awareness and drive sales during peak seasons.
Service providers, including installation, maintenance, and repair technicians, contribute to market growth by providing reliable and efficient services for window air conditioners. They ensure proper installation, maintenance, and timely repairs, enhancing customer satisfaction and product lifespan.
Market players also collaborate with regulatory bodies to ensure product safety, reliability, and sustainability. Market players constantly monitor market trends and consumer behavior to adapt their strategies, product offerings, and business models. They aim to expand their market presence, enter new regions, and target emerging market segments. The collective efforts of the organizations shape the global window air conditioner market, driving innovation, competition, and expansion while meeting diverse consumer needs.
Recent Developments in the Window Air Conditioner Market
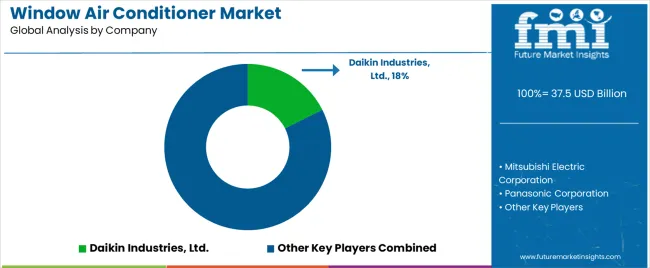
The global window air conditioner market is estimated to be valued at USD 37.5 billion in 2025.
The market size for the window air conditioner market is projected to reach USD 63.6 billion by 2035.
The window air conditioner market is expected to grow at a 5.4% CAGR between 2025 and 2035.
The key product types in window air conditioner market are 8,000 to 12,000 btu, 5,000 to 8,000 btu and 12,000 to 24,000 btu.
In terms of technology, automatic segment to command 46.7% share in the window air conditioner market in 2025.


Full Research Suite comprises of:
Market outlook & trends analysis
Interviews & case studies
Strategic recommendations
Vendor profiles & capabilities analysis
5-year forecasts
8 regions and 60+ country-level data splits
Market segment data splits
12 months of continuous data updates
DELIVERED AS:
PDF EXCEL ONLINE
Window Packaging Market Size and Share Forecast Outlook 2025 to 2035
Window Coverings Market – Trends, Growth & Forecast 2025 to 2035
Assessing Window Packaging Market Share & Industry Trends
Window Rain Guards Market
Cat Window Perches & Wall Shelves Market Growth - Trends & Forecast 2025 to 2035
Power Window Lift Motor Market Size and Share Forecast Outlook 2025 to 2035
Railway Window Market Size and Share Forecast Outlook 2025 to 2035
Aircraft Window Frame Market Size and Share Forecast Outlook 2025 to 2035
Aircraft Windows and Windshields Market Size and Share Forecast Outlook 2025 to 2035
Automated Window Blinds Market Size and Share Forecast Outlook 2025 to 2035
Automotive Window Regulator Motor Market Size and Share Forecast Outlook 2025 to 2035
Automotive Window Regulator Market Growth – Trends & Forecast 2025 to 2035
X-Arm Type Window Regulator Market
Double Hung Windows Market Size and Share Forecast Outlook 2025 to 2035
Solar Control Window Films Market Size and Share Forecast Outlook 2025 to 2035
Automotive Power Window Motor Market Size and Share Forecast Outlook 2025 to 2035
Energy Efficient Windows Market Size and Share Forecast Outlook 2025 to 2035
Automotive Active Window Display Market
Composite Door & Window Market Growth – Trends & Forecast 2024-2034
Self - Adhesive Carton Window Patch Machine Market

Thank you!
You will receive an email from our Business Development Manager. Please be sure to check your SPAM/JUNK folder too.
Chat With
MaRIA