The Kraft Envelopes Market is estimated to be valued at USD 916.5 million in 2025 and is projected to reach USD 1,032.6 million by 2035, registering a compound annual growth rate (CAGR) of 1.2% over the forecast period.
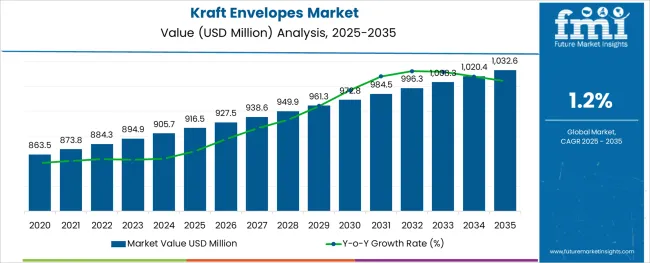
The kraft envelopes market is witnessing consistent growth driven by the intersection of sustainability, e-commerce expansion, and evolving consumer packaging preferences. Rising environmental awareness and corporate commitments to reduce plastic usage have accelerated the shift toward kraft-based paper alternatives. Manufacturers are responding with recyclable, biodegradable envelope formats designed for durability and visual appeal, particularly in gifting and retail packaging.
Advancements in printing, coating, and sealing technologies are supporting the integration of value-added features such as moisture resistance, tamper evidence, and customized branding. The growing reliance on parcel delivery and direct-to-consumer channels has created additional demand for kraft envelopes that are both functional and environmentally responsible.
Future opportunities lie in lightweight, high-strength paper innovations and automation-ready envelope formats that align with logistics infrastructure upgrades. As companies prioritize sustainable packaging while maintaining operational efficiency and consumer appeal, kraft envelopes are expected to remain an integral component of packaging portfolios across diverse end use industries.
The market is segmented by Product, Application, and End Use and region. By Product, the market is divided into Coated and Uncoated. In terms of Application, the market is classified into Gifts, Confidential Documents, Official Purposes, and Invitations. Based on End Use, the market is segmented into Parcel Services, Courier Services, and Postal Services. Regionally, the market is classified into North America, Latin America, Western Europe, Eastern Europe, Balkan & Baltic Countries, Russia & Belarus, Central Asia, East Asia, South Asia & Pacific, and the Middle East & Africa.
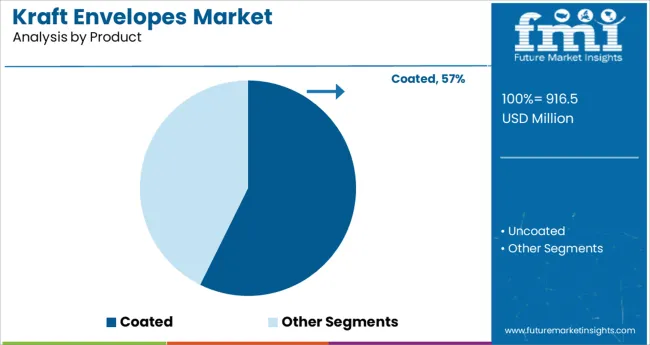
The coated product category is projected to account for 57.3% of the total kraft envelopes market revenue in 2025, making it the leading segment by product type. This leadership is attributed to the rising demand for enhanced protection, printability, and moisture resistance in envelope packaging.
Coated kraft envelopes are being widely adopted for their ability to deliver a more refined aesthetic while maintaining the strength and sustainability of base kraft material. The surface coating supports high-definition printing, brand personalization, and ink retention, making these envelopes ideal for retail, promotional, and gifting applications.
Additionally, the coated layer enhances barrier properties, ensuring product protection during transit and storage. As businesses seek packaging that combines environmental responsibility with visual and functional performance, the coated kraft envelope segment is expected to sustain its dominant market position.
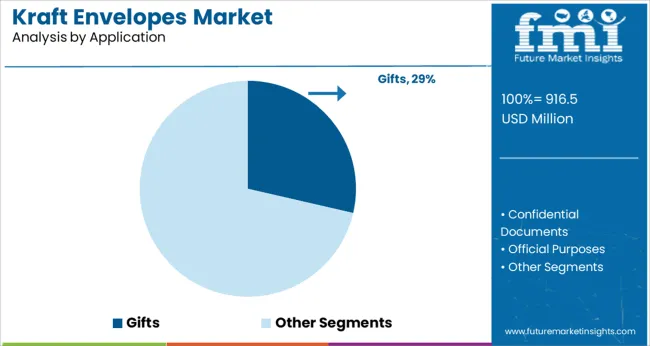
The gifts application segment is expected to contribute 28.6% of the overall kraft envelopes market revenue in 2025, marking it as the most prominent use case within the application category. This dominance is being driven by increasing consumer demand for eco-conscious and visually appealing packaging options for personal and seasonal gifting.
Kraft envelopes have gained popularity as gift packaging due to their rustic charm, tactile quality, and compatibility with artisanal and sustainable branding trends. Retailers and specialty brands are integrating these envelopes into curated product experiences, supported by enhancements such as custom printing, embossing, and closures.
The versatility of kraft envelopes across various gift categories-from stationery to event invitations and boutique items—has reinforced their utility. As gifting becomes more personalized and values-driven, the preference for kraft envelope solutions in this application segment is anticipated to grow steadily.
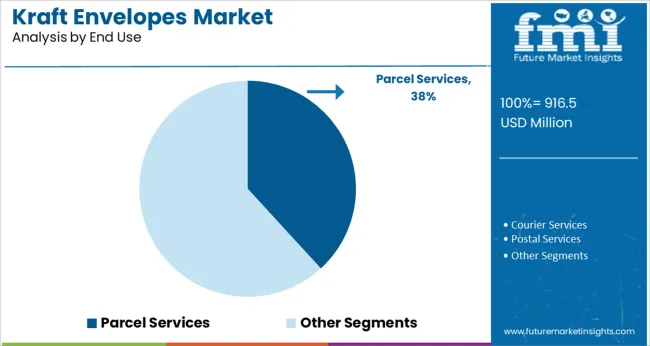
The parcel services end use segment is projected to command 38.2% of the total kraft envelopes market revenue in 2025, making it the top-performing category by end user. This leadership is a direct result of the rapid expansion in last-mile logistics, courier services, and e-commerce fulfillment networks that require scalable, cost-effective, and eco-friendly mailing solutions.
Kraft envelopes are increasingly being favored by parcel service providers for their strength, tear resistance, and lightweight construction, which supports lower shipping costs and simplified handling. The growing emphasis on environmentally sustainable packaging in logistics has further propelled kraft envelope adoption, particularly in regions where regulatory pressures are influencing packaging material choices.
With the rising volume of documents, flat goods, and non-fragile merchandise being shipped, kraft envelopes have emerged as a preferred solution, offering both functionality and sustainability. The trend is expected to continue as delivery infrastructure evolves and parcel services seek packaging formats that align with operational efficiency and green commitments.
Consumers are more aware of the carbon footprint of packaging and its negative impact on the environment, prompting them to choose environmentally friendly solutions such as paper envelopes and biodegradable reusable plastic envelopes. The advantage of kraft papers over other envelopes is their ease of writing and printing. Kraft envelopes' light weight makes them the ideal choice for parcel, courier, and express services.
Kraft envelopes are also utilized in the pharmaceutical packaging industry to package medications at medical supply stores. People's attachment to print media and physical document records is also providing some inertia for consumers' choice of digital solutions in the financial and academic sectors. During the projected period, the kraft envelopes market is expected to increase at a robust compound annual growth rate (CAGR).
Some kraft letter envelopes are laterally elastic, allowing customers to make envelopes that can hold up to 100 sheets. Such things reduce the workload of consumers and so enhance demand.
Envelopes are gradually becoming obsolete as the digital revolution takes hold. Old technologies are rarely eliminated by new technologies; rather, they are repurposed, as television did not replace radio broadcasts.
Netizens are abandoning the habit and rituals of exchanging money envelopes during weddings and other special occasions, and the adoption of digital payment systems such as net banking and e-wallets for money transfer is also impeding the growth of the kraft envelopes market. E-invitations are also becoming increasingly popular, reducing the need to send kraft envelopes. Such issues may limit this market's growth during the forecast period.
Due to rising customer preference, coated kraft envelopes are likely to dominate the global market by product type. Water, oil, dust, and grease are all protected by poly-coated kraft paper.
When wrapping and interleaving objects that require a grease, oil, or another liquid barrier, this product line is ideal. As a result, these envelopes are impervious to contamination and tampering. This is the cause behind this segment's rapid growth.
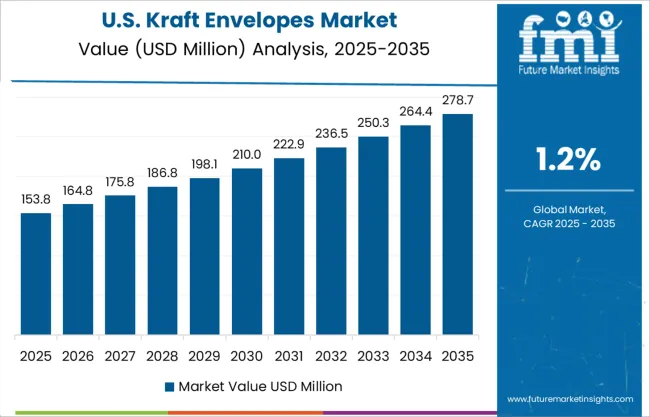
In terms of revenue, the North American market is expected to grow steadily during the projection period of 2025 to 2035. Future Market Insights predicts that by 2025, the market of kraft envelopes in North America is expected to acquire a global market size of 20%.
The majority of manufacturers have their headquarters in North America, particularly the United States. When compared to producers in other countries, manufacturers in these regions offer particularly high-quality and specialized envelope paper.
The rising number of occasions to gift and welcome people and acquaintances with greeting cards has contributed to an increase in the demand for kraft envelopes in the United States.
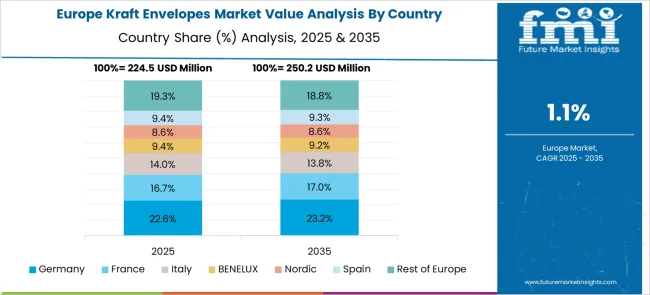
By 2025, Europe will hold 22% of the global market share. This region is expected to be the fastest-growing market in terms of revenue during the forecast period, 2025 to 2035.
Due to the huge volume of e-commerce orders and couriers in various European nations, Europe has emerged as the market leader in the worldwide kraft paper envelope industry. Furthermore, Germany has a variety of envelope manufacturers and printers who sell their products at affordable prices. This is a primary driver driving the region's kraft envelopes market.
Creative and modern material-based kraft envelopes are capturing the attention of consumers. Self-sealing envelopes that assure product safety and provide tamper evidence are in high demand among consumers. Aside from that, printed and fully recyclable envelopes are winning the race.
Asia Pacific is predicted to lead the global kraft envelopes market, with India and China contributing significantly. The Asian region's Kraft envelopes market is dominated by small and medium-sized competitors.
The growing use of print media has resulted in hundreds of tons of waste paper, which can be recycled to make kraft envelopes. This trend is particularly noticeable in India, China, and Japan. Growing digital media has had a mild impact on print media during the last decade, but the intensity may increase in the long run.
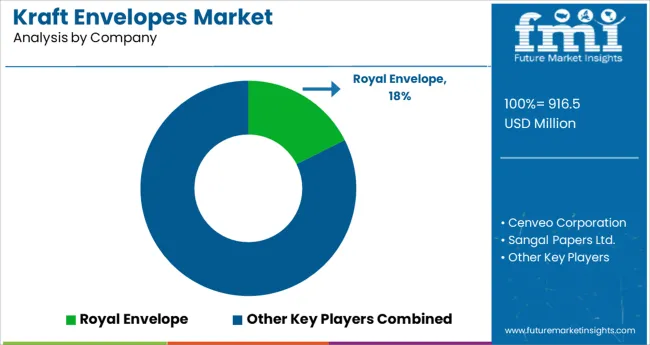
The key players in this market include Royal Envelope, Cenveo Corporation, Sangal Papers Ltd., BETA (ShenZhen) Package Products Co.Ltd., Mehta Envelope Manufacturing Company, French Paper Co., International Paper., Quality Park Products, Heinrich Envelope, Sheppard Envelope Mfg. Co. and Northeastern Envelope Company.
| Report Attribute | Details |
|---|---|
| Growth Rate | 1.2% CAGR |
| Market value in 2025 | USD 916.5 million |
| Market value in 2035 | USD 1,032.6 million |
| Base Year for Estimation | 2024 |
| Historical Data | 2020 to 2024 |
| Forecast Period | 2025 to 2035 |
| Quantitative Units | million for Value |
| Report Coverage | Revenue Forecast, Volume Forecast, Company Ranking, Competitive Landscape, Growth Factors, Trends, and Pricing Analysis |
| Segments Covered | Product, Application, End Use, Region |
| Regions Covered | North America; Latin America; Europe; Asia Pacific; Middle East & Africa |
| Key Countries Profiled | United States of America, Canada, Mexico, Brazil, Germany, Italy, France, United Kingdom, Spain, China, Japan, South Korea, Malaysia, Singapore, Australia, New Zealand, GCC Countries, South Africa, Israel |
| Key Companies Profiled | Royal Envelope; Cenveo Corporation; Sangal Papers Ltd.; BETA (ShenZhen) Package Products Co. Ltd.; Mehta Envelope Manufacturing Company; French Paper Co.; International Paper; Quality Park Products; Heinrich Envelope; Sheppard Envelope Mfg. Co.; Northeastern Envelope Company |
| Customization Scope | Available on Request |
The global kraft envelopes market is estimated to be valued at USD 916.5 million in 2025.
It is projected to reach USD 1,032.6 million by 2035.
The market is expected to grow at a 1.2% CAGR between 2025 and 2035.
The key product types are coated and uncoated.
gifts segment is expected to dominate with a 28.6% industry share in 2025.


Full Research Suite comprises of:
Market outlook & trends analysis
Interviews & case studies
Strategic recommendations
Vendor profiles & capabilities analysis
5-year forecasts
8 regions and 60+ country-level data splits
Market segment data splits
12 months of continuous data updates
DELIVERED AS:
PDF EXCEL ONLINE
Market Positioning & Share in the Kraft Envelopes Industry
Kraft Box Market Forecast Outlook 2025 to 2035
Kraft Pouch Market Forecast and Outlook 2025 to 2035
Kraft Liner Market Size and Share Forecast Outlook 2025 to 2035
Kraft Labels Market Size and Share Forecast Outlook 2025 to 2035
Kraft Paper Market Size and Share Forecast Outlook 2025 to 2035
Kraft Paper Machine Market Analysis - Size, Share, and Forecast Outlook 2025 to 2035
Kraft Paper Bags Market Size, Share & Forecast 2025 to 2035
Kraft Paper Pouch Market Growth – Demand & Forecast 2025 to 2035
Kraft Packaging Market Trends - Growth & Forecast 2025 to 2035
Market Share Distribution Among Kraft Liner Manufacturers
Kraft Paper Shopping Bags Market Growth – Size, Trends & Forecast 2024 to 2034
Kraft Block Bottom Pouch Market Growth – Size, Trends & Forecast 2024-2034
Kraft Bubble Mailer Market from 2024 to 2034
Kraft Paper Bakery Bags Market
Kraft Paper Mailer Market
Kraft Paper Tapes Market
Kraft Paper SOS Bag Market
Jumbo Kraft Tubes Market
Saturated Kraft Paper Industry Analysis in Europe Size and Share Forecast Outlook 2025 to 2035

Thank you!
You will receive an email from our Business Development Manager. Please be sure to check your SPAM/JUNK folder too.
Chat With
MaRIA