Unbleached Softwood Kraft Pulp Market Size and Share Forecast Outlook 2025 to 2035

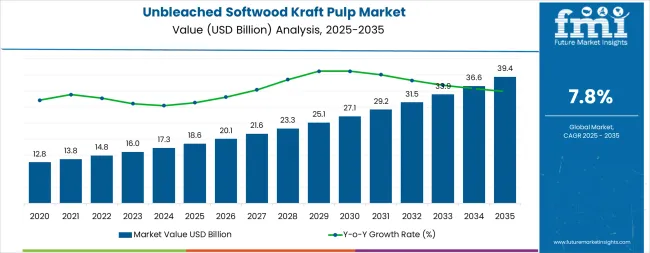
The unbleached softwood kraft pulp market is projected to grow from USD 1.6 billion in 2025 to USD 2.4 billion by 2035, registering a CAGR of 4.6% during the forecast period. Sales in 2024 reached USD 1.5 billion, indicating a steady demand trajectory.

Quick Stats of Unbleached Softwood Kraft Pulp Market

  • Market Value (2025): USD 1.6 billion
  • Forecast Value (2035): USD 2.4 billion
  • Forecast CAGR: 4.6%
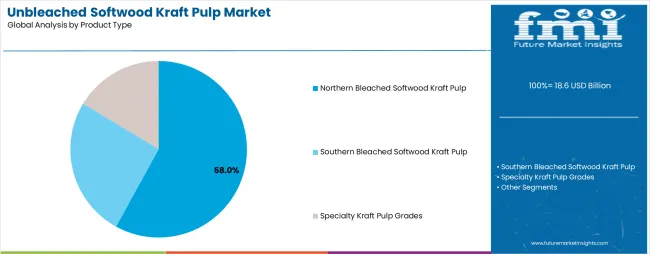
  • Processing Grade Leader in 2025: Virgin unbleached softwood (48.6% market share)
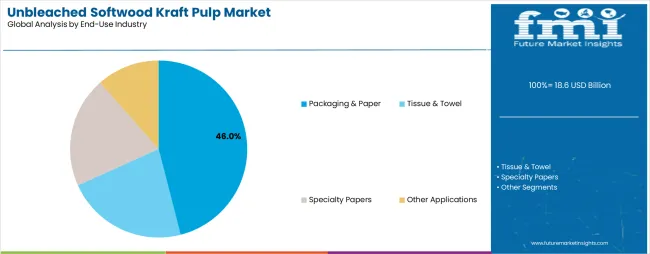
  • Top End Use: Industrial Packaging (31.2% share)
  • Key Growth Region: Europe (United Kingdom is the fastest-growing market with 4.9% CAGR)
Metric Value
Industry Size (2025E) USD 1.6 billion
Industry Value (2035F) USD 2.4 billion
CAGR (2025 to 2035) 4.6%

This growth has been attributed to the increasing demand for sustainable and eco-friendly packaging solutions across various sectors, including food and beverage, pharmaceuticals, and personal care. The rise in environmental awareness and the need for biodegradable alternatives have further propelled the adoption of innovative unbleached softwood kraft pulp solutions.

In 2024, Mondi plc, a global leader in the production of sustainable packaging and paper, has completed the acquisition of Hinton Pulp mill. Mondi intends to invest in the mill to improve productivity and sustainability performance and, subject to pre-engineering and permitting, invest in expanding the facility primarily with a new kraft paper machine which will integrate its paper bag operations in the Americas to support future growth.

“We are delighted to welcome our new colleagues from Hinton Pulp mill to Mondi and look forward to working together to secure the mill’s future and support Mondi’s growth in North America with our portfolio of sustainable packaging” said, Andrew King, Mondi Group CEO.

Rising interest in eco-conscious packaging has been a key factor driving developments in the unbleached softwood kraft pulp market. Manufacturers have been transitioning towards recyclable and biodegradable materials to align with environmental sustainability goals and meet consumer preferences for eco-conscious products.

Innovations in material science have led to the development of pulp products that not only provide superior strength but also minimize environmental impact. Advancements in manufacturing technologies have enabled the production of customizable and efficient pulp products, catering to a wide range of applications across different industries. These developments reflect the market's commitment to sustainability and its responsiveness to the growing emphasis on environmental responsibility in packaging practices.

The unbleached softwood kraft pulp market is expected to expand as more industries adopt natural fiber-based materials and invest in advanced, resource-efficient production technologies to meet evolving packaging and sustainability requirements. The market's trajectory suggests a steady rise in demand for innovative, eco-friendly pulp products that cater to both consumer preferences and regulatory requirements.

Companies investing in research and development to create durable, cost-effective, and environmentally friendly pulp products are expected to gain a competitive edge. The integration of advanced materials and ergonomic designs will likely play a crucial role in shaping the future of the Unbleached Softwood Kraft Pulp Market.

Analyzing Unbleached Softwood Kraft Pulp Market by Top Investment Segments

The market is segmented based on processing grade, application, end-use industry, and region. By processing grade, the market includes virgin unbleached softwood kraft pulp, semi-chemical unbleached pulp, and high-yield unbleached kraft pulp. In terms of application, the market is categorized into packaging paper, sack kraft paper, corrugated medium, linerboard, industrial specialty paper, and molded fiber products.

By end-use industry, the market comprises food and beverage packaging, industrial & commercial packaging, agriculture & horticulture, construction materials, and e-commerce & retail packaging. Regionally, the market is analyzed across North America, Latin America, East Asia, South Asia & Pacific, Eastern Europe, Western Europe, Oceania, and the Middle East & Africa.

Virgin Pulp Selected for Its Strength and Fiber Purity

Virgin unbleached softwood kraft pulp has been projected to account for 48.6% of the global market in 2025, favored for its superior tensile strength and long fiber characteristics. Made from sustainably sourced coniferous trees, it has been used to produce durable paper-based packaging materials. High purity and minimal chemical treatment have enabled better recyclability and reduced environmental impact.

Corrugated boxes, liners, and industrial wrapping papers have most frequently incorporated virgin pulp grades. The pulp has been valued for high run ability in industrial-scale paper production lines. Consistent fiber morphology has improved uniformity in end-use applications across packaging formats. Water resistance and stiffness have been enhanced through refining and sheet formation techniques. Regulatory compliance with food-safe and compostable standards has also supported wider adoption.

Virgin unbleached kraft pulp has offered versatility for both molded fiber and laminated paperboard structures. It has been integrated into applications requiring both structural integrity and cost efficiency. Lower lignin content compared to semi-chemical pulp has contributed to smoother conversion and finishing. Long-term supply agreements with pulp mills have ensured stable availability for major converters.

As recycled pulp quality has declined in certain regions, virgin kraft pulp has gained preference for primary packaging formats. Strategic expansion of integrated pulp-paper facilities has reduced procurement complexities. Digital printing and barrier coating compatibility have been optimized with this pulp grade. The virgin pulp segment is expected to retain its leadership with increasing demand from premium sustainable packaging.

Industrial Packaging Embraced for High Durability and Recyclability

The industrial packaging sector has been estimated to contribute 31.2% of global demand for unbleached softwood kraft pulp in 2025, driven by its need for strength, rigidity, and moisture resistance. Corrugated boxes, protective wrapping, and shipping sleeves have relied on unbleached kraft pulp for structural performance. Resistance to mechanical stress and burst pressure has made it ideal for transporting machinery, components, and bulk goods.

Applications have expanded across manufacturing hubs and export based industries. Use in pallet liners, slip sheets, and tier dividers has grown across automotive, metalworking, and logistics sectors. High stacking strength and compression resistance have reduced product damage and warehouse losses. Cost-effectiveness and sustainability credentials have supported widespread substitution of plastic packaging. Water-based adhesives and starch coatings have further enhanced bonding with kraft pulp substrates.

Adoption of molded fiber trays and cradles for industrial shipping has seen notable growth. Regional bans on single-use plastics have accelerated the transition to pulp-based materials. Unbleached appearance has been accepted as a marker of eco-friendliness in commercial applications. Converters have optimized board weight and caliper to balance material usage with performance.

Environmental compliance and EPR regulations have promoted fiber-based solutions in B2B packaging. Recyclability have offered long-term benefits over laminated or plastic-heavy formats. Industrial packagers have partnered with mills to secure closed-loop supply chains and traceable pulp sources. The segment is expected to lead ongoing material innovation within durable and sustainable transit packaging.

Key Dynamics

Key Drivers Key Restraints
Growing demand for sustainable and eco-friendly packaging solutions High production costs associated with unbleached softwood kraft pulp
Increasing regulations promoting the use of biodegradable materials Fluctuations in raw material availability and pricing
Advancements in AI and automation improving production efficiency Competition from alternative packaging materials like recycled paper and bioplastics
Expanding e-commerce sector driving demand for strong and durable packaging Challenges in achieving uniform quality and performance standards
Rising consumer awareness about environmental sustainability Supply chain disruptions impacting global trade and distribution
Preference for unbleached sack kraft paper in food and industrial packaging Dependence on forestry regulations and sustainable wood sourcing practices

Country Wise Analysis

United States

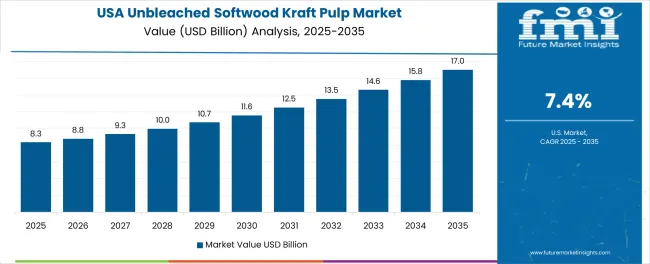
The Unbleached Softwood Kraft Pulp market in the United States is projected to grow at a Compound Annual Growth Rate (CAGR) of 3.1% from 2025 to 2035, reaching a market value of USD 286 million by 2035. This has allowed the country to remain a key producer, with major companies allocating resources towards research and development in order to improve both the quality and sustainability of their products.

The growth of e-commerce also drives the need for sustainable packaging items such as paper boxes, bags, and cartons. Moreover, governmental programs promoting sustainable forestry and waste reduction further stimulate the growth. Unbleached softwood kraft pulp is anticipated to be crucial for the development of the country's packaging industry as companies pivot towards greener consistencies.

Canada

From 2025 to 2035, the market for unbleached softwood kraft pulp in Canada is set to grow at a CAGR of 4.5%. With its abundance of forestry resources and thoughtful environmental regulations, the country is among the leading global suppliers of sustainable pulp materials with approximately market value of USD 66 million.

Demand for sustainable packaging solutions, especially in food and beverage and e-commerce sectors, is fueling growth. Canada’s emphasis on advanced pulp processing technologies makes it more competitive. Increasing government policies promoting sustainable forest management as well as recyclable raw materials is further bolstering the industry, resulting to continued growing throughout the forecast period.

United Kingdom

The United Kingdom Unbleached Softwood Kraft Pulp segment is expected to grow at a significant CAGR of 4.9% during the forecast period 2025 to 2035 and the market value is USD 64 million. Demand is being driven by the country’s strict environmental policies and commitment to sustainable packaging. Considering government regulations and consumer preferences, an increasing number of businesses are moving toward recyclable and biodegradable materials.

The UK packaging industry continues to investigate new uses for unbleached softwood kraft pulp, in particular within the retail and food industries. Consumer awareness regarding alternatives to plastic is increasing, hence, the demand for sustainable pulp-based products will continue to grow in the long-run in the UK, leading to steady growth.

Germany

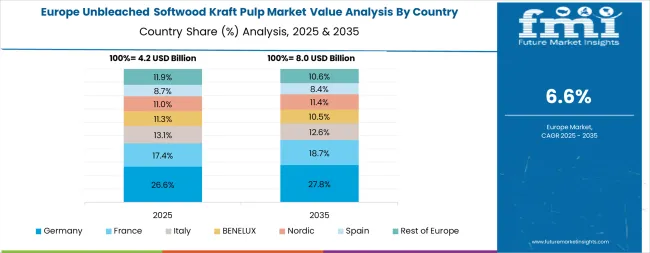
The country has a well-established paper and packaging industry that has a growing focus on sustainability, and it is widely adopted in a variety of applications and the Germany has an expected 4.0% by 2035. Regulations by the government that require producers to cut down on plastic waste are hastening the transition to sustainable materials.

The growing industry is further facilitated by investments in advanced manufacturing processes and resource-efficient production techniques. Germany can expect strong demand from diverse industries including food and beverages, retail, and logistics, and is likely to remain a key player in the European unbleached softwood kraft pulp industry.

Japan

Japan’s sector for unbleached softwood kraft pulp is growing steadily with a CAGR of 4.7% during 2025 to 2035. The increasing need for sustainable, high-quality, and durable fiber-based materials is driving growth in the printing, paper packaging, and hygiene product industries. Companies are developing advanced kraft pulp with superior fiber bonding strength and increased opacity to improve product performance.

With strict regulations on packaging waste reduction and recyclability, businesses are transitioning toward FSC-certified and carbon-neutral kraft pulp solutions. Additionally, advancements in enzyme-assisted pulping and High-retention refining processes are driving demand in applications requiring enhanced paper strength and absorbency.

Businesses are also investing in energy-efficient kraft pulp mills to improve production sustainability. Furthermore, the rise of premium and high-performance paper-based packaging in Japan is fueling demand for high-quality, sustainable kraft pulp materials.

South Korea

South Korea's unbleached softwood kraft pulp segment is experiencing significant growth with a CAGR of 5.1%. Due to increased exports of eco-friendly packaging solutions and the growing demand for biodegradable alternatives in the paper and tissue sectors. The need for cost-effective and high-performance kraft pulp has led manufacturers to develop fiber with enhanced tear resistance, printability, and barrier properties.

Government regulations promoting forest sustainability and eco-friendly raw materials further support the expansion. Additionally, businesses are integrating automated pulping technologies such as AI-driven fiber classification and digitalized process control to improve efficiency.

The growing demand for premium tissue and specialty paper products is further boosting adoption. Moreover, research into antimicrobial kraft pulp coatings and moisture-resistant fiber composites is helping businesses develop innovative solutions tailored to hygiene and food packaging applications.

China

The unbleached softwood kraft pulp market in China is predicted to grow at a compound annual growth rate of 6.0% from 2025 to 2035. The country’s quick industrial revolution, coupled with an increasing focus on environmentally friendly sustainability is driving the demand for green packaging materials with approximately USD 174 million.

With China tightening its environmental regulations and enforcing bans on plastic waste of various forms, unbleached kraft pulp is increasingly being adopted in the packaging, e-commerce, and retail sectors. Also, improvement in local pulp production, together with rising investments in sustainable supply chains, boosted the industries. Being a key producer in global packaging industry China acts as a crucial contributor to total packaging growth, especially in Asia-Pacific region.

India

India's unbleached softwood kraft pulp market is anticipated to grow at a CAGR of 6.7% from 2025 to 2035. Strong demand is being fueled by the country’s booming packaging industry, spurred on by rapid urbanization and growing awareness of sustainability among consumers with approximately USD 107 million.

Government initiatives supporting eco-friendly materials and bans on single-use plastic bags are further propelling the growth. Unbleached kraft pulp is gaining momentum in the food and beverage, e-commerce, and agricultural industries. Additionally, India is ramping up domestic pulp production and recycling infrastructure, boding well for continued the growth in the next few years.

Competitive Landscape

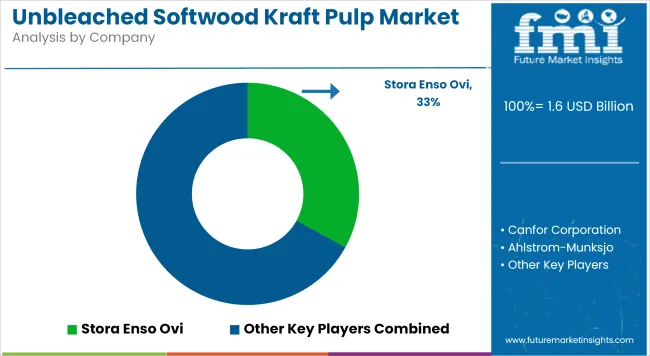
Tier 1 players dominate the market with a 90% share, while smaller companies sustain themselves by serving localized demand, niche applications, and specialized product segments that larger firms may not prioritize. This dominance indicates that a few major global companies control most of the industries, benefiting from economies of scale, advanced manufacturing technologies, and strong distribution networks.

These key players invest heavily in R&D, sustainability initiatives, and product innovation, further strengthening their segment position. The remaining 10% of the industry is fragmented, comprising smaller regional players and niche manufacturers. These companies primarily cater to localized demand or specialized applications, but they face challenges in competing with industry giants on cost, production capacity, and global reach.

Sustainability and transparency were key trends in the 2024 unbleached softwood pulp industry, emerging as crucial factors influencing end-user preferences and purchasing decisions. P&G had promised to publish more extensive audits of its wood-pulp suppliers to meet environmental concerns and investors' demand for sustainable sourcing. This effort is part of a larger industry trend to hold supply chains more accountable.

Companies like Circ sought strategic partnerships to more efficiently scale operations. To this end, it partnered with Birla Cellulose, a part of Aditya Birla Group, to embed recycled pulp into the mainstream production process. Such a partnership not only confirmed Circ's new recycling technology but also aligned with the industry's circular economy trends. Both established companies and new entrants increasingly invest in research and development to strengthen product quality and environmental performance.

They are currently investigating other raw materials and high-tech processing methods, with the aim of minimizing ecological footprints. In doing so, this program seeks to address the increasing demand for sustainable packaging solutions in line with worldwide goals for environmental sustainability.

To sum up, the unbleached softwood kraft pulp sectors in 2024 saw a collective push towards sustainability. Longer established businesses improved visibility and supplier transparency, whereas upstarts were able to build partnerships to scale initiatives. Together, these strategies help create a more sustainable and resilient industry landscape.

Key players

  • Stora Enso Ovi.
  • Canfor Corporation
  • Ahlstrom-Munksjo
  • Nippon Paper Industries Co., Ltd
  • Domtar Corporation
  • Arauco North America, Inc.
  • Ilim Group
  • Rottneros AB
  • Port Townsend Paper Company

Scope of Report on Unbleached Softwood Kraft Pulp Market

Report Attributes Details
Current Total Market Size (2025) USD 1.6 billion
Projected Market Size (2035) USD 2.4 billion
CAGR (2025 to 2035) 4.6%
Base Year for Estimation 2024
Historical Period 2020 to 2024
Projections Period 2025 to 2035
Market Analysis Parameter Revenue in USD billion
By Product Type Integrated Chest-Piece System, Wireless Transmission System (Bluetooth), Integrated Receiver Head-Piece System, Numerical Simulation and System Integration
By Grade Hospitals, Clinics, Healthcare Institutes & Organizations, Home Care Settings, Others
By Application Printing and Writing, Newsprint, Packaging, Corrugated Boxes, Cartons, Liners, Bags and Sacks, Wrapping, Other Packaging Products, Tissue & Toilet Paper, and Others
By End Use Packaging and Non-packaging
Regions Covered North America, Latin America, Europe, East Asia, South Asia, Oceania, and The Middle East & Africa (MEA)
Countries Covered United States, Japan, Germany, India, United Kingdom, France, Italy, Brazil, Canada, South Korea, Australia, Spain, Netherlands, Saudi Arabia, Switzerland
Key Players Stora Enso Ovi, Canfor Corporation, Ahlstrom-Munksjo, Nippon Paper Industries Co., Ltd, Domtar Corporation, Arauco North America, Inc., Ilim Group, Rottneros AB, Port Townsend Paper Company, SCG Packaging Plc, Canadian Kraft Paper Industries Ltd., Smurfit Kappa Group Plc
Additional Attributes Dollar sales by material type, Dollar sales by end-use industry, Semi-annual growth rates, Country-wise insights, Industry highlights, Competitive landscape
Customization and Pricing Available upon request

Key Segmentation

By Product Type:

Northern, Southern, and Others

By Grade:

Chemical Pulp, Mechanical Pulp, and Other Pulp

By Application:

Printing and Writing, Newsprint, Packaging, Corrugated Boxes, Cartons, Liners, Bags and Sacks, Wrapping, Other Packaging Products, Tissue & Toilet Paper, and Others

By End Use:

Packaging, Food and Beverages, Building and Construction, Agriculture and Allied Industries, Chemicals, Cosmetics and Personal Care, Electrical & Electronics, Other Consumer Goods, and Non-Packaging

By Region:

North America, Latin America, Europe, East Asia, South Asia, Oceania, and The Middle East & Africa (MEA)

Table of Content

  1. Executive Summary
    • Global Market Outlook
    • Demand-side Trends
    • Supply-side Trends
    • Technology Roadmap Analysis
    • Analysis and Recommendations
  2. Market Overview
    • Market Coverage / Taxonomy
    • Market Definition / Scope / Limitations
  3. Market Background
    • Market Dynamics
      • Drivers
      • Restraints
      • Opportunity
      • Trends
    • Scenario Forecast
      • Demand in Optimistic Scenario
      • Demand in Likely Scenario
      • Demand in Conservative Scenario
    • Opportunity Map Analysis
    • Product Life Cycle Analysis
    • Supply Chain Analysis
      • Supply Side Participants and their Roles
        • Producers
        • Mid-Level Participants (Traders/ Agents/ Brokers)
        • Wholesalers and Distributors
      • Value Added and Value Created at Node in the Supply Chain
      • List of Raw Material Suppliers
      • List of Existing and Potential Buyer’s
    • Investment Feasibility Matrix
    • Value Chain Analysis
      • Profit Margin Analysis
      • Wholesalers and Distributors
      • Retailers
    • PESTLE and Porter’s Analysis
    • Regulatory Landscape
      • By Key Regions
      • By Key Countries
    • Regional Parent Market Outlook
    • Production and Consumption Statistics
    • Import and Export Statistics
  4. Global Market Analysis 2020 to 2024 and Forecast, 2025 to 2035
    • Historical Market Size Value (USD Million) & Volume (Units) Analysis, 2020 to 2024
    • Current and Future Market Size Value (USD Million) & Volume (Units) Projections, 2025 to 2035
      • Y-o-Y Growth Trend Analysis
      • Absolute $ Opportunity Analysis
  5. Global Market Pricing Analysis 2020 to 2024 and Forecast 2025 to 2035
  6. Global Market Analysis 2020 to 2024 and Forecast 2025 to 2035, By Processing Grade
    • Introduction / Key Findings
    • Historical Market Size Value (USD Million) & Volume (Units) Analysis By Processing Grade, 2020 to 2024
    • Current and Future Market Size Value (USD Million) & Volume (Units) Analysis and Forecast By Processing Grade, 2025 to 2035
      • Virgin Unbleached Softwood Kraft Pulp
      • Semi-Chemical Unbleached Pulp
      • High-Yield Unbleached Kraft Pulp
    • Y-o-Y Growth Trend Analysis By Processing Grade, 2020 to 2024
    • Absolute $ Opportunity Analysis By Processing Grade, 2025 to 2035
  7. Global Market Analysis 2020 to 2024 and Forecast 2025 to 2035, By Application
    • Introduction / Key Findings
    • Historical Market Size Value (USD Million) & Volume (Units) Analysis By Application, 2020 to 2024
    • Current and Future Market Size Value (USD Million) & Volume (Units) Analysis and Forecast By Application, 2025 to 2035
      • Packaging Paper
      • Sack Kraft Paper
      • Corrugated Medium
      • Linerboard
      • Industrial Specialty Paper
      • Molded Fiber Products
    • Y-o-Y Growth Trend Analysis By Application, 2020 to 2024
    • Absolute $ Opportunity Analysis By Application, 2025 to 2035
  8. Global Market Analysis 2020 to 2024 and Forecast 2025 to 2035, By End-Use Industry
    • Introduction / Key Findings
    • Historical Market Size Value (USD Million) & Volume (Units) Analysis By End-Use Industry, 2020 to 2024
    • Current and Future Market Size Value (USD Million) & Volume (Units) Analysis and Forecast By End-Use Industry, 2025 to 2035
      • Food & Beverage Packaging
      • Industrial Packaging
      • Agriculture & Horticulture
      • Construction Materials
      • E-commerce & Retail Packaging
    • Y-o-Y Growth Trend Analysis By End-Use Industry, 2020 to 2024
    • Absolute $ Opportunity Analysis By End-Use Industry, 2025 to 2035
  9. Global Market Analysis 2020 to 2024 and Forecast 2025 to 2035, By Region
    • Introduction
    • Historical Market Size Value (USD Million) & Volume (Units) Analysis By Region, 2020 to 2024
    • Current Market Size Value (USD Million) & Volume (Units) Analysis and Forecast By Region, 2025 to 2035
      • North America
      • Latin America
      • Europe
      • East Asia
      • South Asia
      • Oceania
      • MEA
    • Market Attractiveness Analysis By Region
  10. North America Market Analysis 2020 to 2024 and Forecast 2025 to 2035, By Country
    • Historical Market Size Value (USD Million) & Volume (Units) Trend Analysis By Market Taxonomy, 2020 to 2024
    • Market Size Value (USD Million) & Volume (Units) Forecast By Market Taxonomy, 2025 to 2035
      • By Country
        • USA
        • Canada
      • By Processing Grade
      • By Application
      • By End-Use Industry
    • Market Attractiveness Analysis
      • By Country
      • By Processing Grade
      • By Application
      • By End-Use Industry
    • Key Takeaways
  11. Latin America Market Analysis 2020 to 2024 and Forecast 2025 to 2035, By Country
    • Historical Market Size Value (USD Million) & Volume (Units) Trend Analysis By Market Taxonomy, 2020 to 2024
    • Market Size Value (USD Million) & Volume (Units) Forecast By Market Taxonomy, 2025 to 2035
      • By Country
        • Brazil
        • Mexico
        • Argentina
        • Chile
        • Peru
        • Rest of Latin America
      • By Processing Grade
      • By Application
      • By End-Use Industry
    • Market Attractiveness Analysis
      • By Country
      • By Processing Grade
      • By Application
      • By End-Use Industry
    • Key Takeaways
  12. Europe Market Analysis 2020 to 2024 and Forecast 2025 to 2035, By Country
    • Historical Market Size Value (USD Million) & Volume (Units) Trend Analysis By Market Taxonomy, 2020 to 2024
    • Market Size Value (USD Million) & Volume (Units) Forecast By Market Taxonomy, 2025 to 2035
      • By Country
        • Germany
        • Italy
        • France
        • UK
        • Spain
        • Russia
        • BENELUX
        • Rest of Europe
      • By Processing Grade
      • By Application
      • By End-Use Industry
    • Market Attractiveness Analysis
      • By Country
      • By Processing Grade
      • By Application
      • By End-Use Industry
    • Key Takeaways
  13. East Asia Market Analysis 2020 to 2024 and Forecast 2025 to 2035, By Country
    • Historical Market Size Value (USD Million) & Volume (Units) Trend Analysis By Market Taxonomy, 2020 to 2024
    • Market Size Value (USD Million) & Volume (Units) Forecast By Market Taxonomy, 2025 to 2035
      • By Country
        • China
        • Japan
        • South Korea
      • By Processing Grade
      • By Application
      • By End-Use Industry
    • Market Attractiveness Analysis
      • By Country
      • By Processing Grade
      • By Application
      • By End-Use Industry
    • Key Takeaways
  14. South Asia Market Analysis 2020 to 2024 and Forecast 2025 to 2035, By Country
    • Historical Market Size Value (USD Million) & Volume (Units) Trend Analysis By Market Taxonomy, 2020 to 2024
    • Market Size Value (USD Million) & Volume (Units) Forecast By Market Taxonomy, 2025 to 2035
      • By Country
        • India
        • Thailand
        • Malaysia
        • Indonesia
        • Rest of South Asia
      • By Processing Grade
      • By Application
      • By End-Use Industry
    • Market Attractiveness Analysis
      • By Country
      • By Processing Grade
      • By Application
      • By End-Use Industry
    • Key Takeaways
  15. Oceania Market Analysis 2020 to 2024 and Forecast 2025 to 2035, By Country
    • Historical Market Size Value (USD Million) & Volume (Units) Trend Analysis By Market Taxonomy, 2020 to 2024
    • Market Size Value (USD Million) & Volume (Units) Forecast By Market Taxonomy, 2025 to 2035
      • By Country
        • Australia
        • New Zealand
      • By Processing Grade
      • By Application
      • By End-Use Industry
    • Market Attractiveness Analysis
      • By Country
      • By Processing Grade
      • By Application
      • By End-Use Industry
    • Key Takeaways
  16. MEA Market Analysis 2020 to 2024 and Forecast 2025 to 2035, By Country
    • Historical Market Size Value (USD Million) & Volume (Units) Trend Analysis By Market Taxonomy, 2020 to 2024
    • Market Size Value (USD Million) & Volume (Units) Forecast By Market Taxonomy, 2025 to 2035
      • By Country
        • GCC
        • Rest of MEA
      • By Processing Grade
      • By Application
      • By End-Use Industry
    • Market Attractiveness Analysis
      • By Country
      • By Processing Grade
      • By Application
      • By End-Use Industry
    • Key Takeaways
  17. Key Countries Market Analysis
    • USA
      • Pricing Analysis
      • Market Share Analysis, 2024
        • By Processing Grade
        • By Application
        • By End-Use Industry
    • Canada
      • Pricing Analysis
      • Market Share Analysis, 2024
        • By Processing Grade
        • By Application
        • By End-Use Industry
    • Brazil
      • Pricing Analysis
      • Market Share Analysis, 2024
        • By Processing Grade
        • By Application
        • By End-Use Industry
    • Mexico
      • Pricing Analysis
      • Market Share Analysis, 2024
        • By Processing Grade
        • By Application
        • By End-Use Industry
    • Argentina
      • Pricing Analysis
      • Market Share Analysis, 2024
        • By Processing Grade
        • By Application
        • By End-Use Industry
  18. Market Structure Analysis
    • Competition Dashboard
    • Competition Benchmarking
    • Market Share Analysis of Top Players
      • By Regional
      • By Processing Grade
      • By Application
      • By End-Use Industry
  19. Competition Analysis
    • Competition Deep Dive
      • Stora Enso
        • Overview
        • Product Portfolio
        • Profitability by Market Segments (Product/Age /Sales Channel/Region)
        • Sales Footprint
        • Strategy Overview
          • Marketing Strategy
          • Product Strategy
          • Channel Strategy
      • Canfor Corporation
        • Overview
        • Product Portfolio
        • Profitability by Market Segments (Product/Age /Sales Channel/Region)
        • Sales Footprint
        • Strategy Overview
          • Marketing Strategy
          • Product Strategy
          • Channel Strategy
      • WestRock Company
        • Overview
        • Product Portfolio
        • Profitability by Market Segments (Product/Age /Sales Channel/Region)
        • Sales Footprint
        • Strategy Overview
          • Marketing Strategy
          • Product Strategy
          • Channel Strategy
      • Ahlstrom
        • Overview
        • Product Portfolio
        • Profitability by Market Segments (Product/Age /Sales Channel/Region)
        • Sales Footprint
        • Strategy Overview
          • Marketing Strategy
          • Product Strategy
          • Channel Strategy
      • Ilim Group
        • Overview
        • Product Portfolio
        • Profitability by Market Segments (Product/Age /Sales Channel/Region)
        • Sales Footprint
        • Strategy Overview
          • Marketing Strategy
          • Product Strategy
          • Channel Strategy
      • ARAUCO
        • Overview
        • Product Portfolio
        • Profitability by Market Segments (Product/Age /Sales Channel/Region)
        • Sales Footprint
        • Strategy Overview
          • Marketing Strategy
          • Product Strategy
          • Channel Strategy
      • Oji Fibre Solutions
        • Overview
        • Product Portfolio
        • Profitability by Market Segments (Product/Age /Sales Channel/Region)
        • Sales Footprint
        • Strategy Overview
          • Marketing Strategy
          • Product Strategy
          • Channel Strategy
      • Billerud AB
        • Overview
        • Product Portfolio
        • Profitability by Market Segments (Product/Age /Sales Channel/Region)
        • Sales Footprint
        • Strategy Overview
          • Marketing Strategy
          • Product Strategy
          • Channel Strategy
      • Mercer International
        • Overview
        • Product Portfolio
        • Profitability by Market Segments (Product/Age /Sales Channel/Region)
        • Sales Footprint
        • Strategy Overview
          • Marketing Strategy
          • Product Strategy
          • Channel Strategy
      • Domtar Corporation
        • Overview
        • Product Portfolio
        • Profitability by Market Segments (Product/Age /Sales Channel/Region)
        • Sales Footprint
        • Strategy Overview
          • Marketing Strategy
          • Product Strategy
          • Channel Strategy
  20. Assumptions & Acronyms Used
  21. Research Methodology

List of Tables

  • Table 1: Global Market Value (USD Million) Forecast by Region, 2020-2035
  • Table 2: Global Market Volume (Units) Forecast by Region, 2020-2035
  • Table 3: Global Market Value (USD Million) Forecast by Processing Grade, 2020-2035
  • Table 4: Global Market Volume (Units) Forecast by Processing Grade, 2020-2035
  • Table 5: Global Market Value (USD Million) Forecast by Application, 2020-2035
  • Table 6: Global Market Volume (Units) Forecast by Application, 2020-2035
  • Table 7: Global Market Value (USD Million) Forecast by End-Use Industry, 2020-2035
  • Table 8: Global Market Volume (Units) Forecast by End-Use Industry, 2020-2035
  • Table 9: North America Market Value (USD Million) Forecast by Country, 2020-2035
  • Table 10: North America Market Volume (Units) Forecast by Country, 2020-2035
  • Table 11: North America Market Value (USD Million) Forecast by Processing Grade, 2020-2035
  • Table 12: North America Market Volume (Units) Forecast by Processing Grade, 2020-2035
  • Table 13: North America Market Value (USD Million) Forecast by Application, 2020-2035
  • Table 14: North America Market Volume (Units) Forecast by Application, 2020-2035
  • Table 15: North America Market Value (USD Million) Forecast by End-Use Industry, 2020-2035
  • Table 16: North America Market Volume (Units) Forecast by End-Use Industry, 2020-2035
  • Table 17: Latin America Market Value (USD Million) Forecast by Country, 2020-2035
  • Table 18: Latin America Market Volume (Units) Forecast by Country, 2020-2035
  • Table 19: Latin America Market Value (USD Million) Forecast by Processing Grade, 2020-2035
  • Table 20: Latin America Market Volume (Units) Forecast by Processing Grade, 2020-2035
  • Table 21: Latin America Market Value (USD Million) Forecast by Application, 2020-2035
  • Table 22: Latin America Market Volume (Units) Forecast by Application, 2020-2035
  • Table 23: Latin America Market Value (USD Million) Forecast by End-Use Industry, 2020-2035
  • Table 24: Latin America Market Volume (Units) Forecast by End-Use Industry, 2020-2035
  • Table 25: Europe Market Value (USD Million) Forecast by Country, 2020-2035
  • Table 26: Europe Market Volume (Units) Forecast by Country, 2020-2035
  • Table 27: Europe Market Value (USD Million) Forecast by Processing Grade, 2020-2035
  • Table 28: Europe Market Volume (Units) Forecast by Processing Grade, 2020-2035
  • Table 29: Europe Market Value (USD Million) Forecast by Application, 2020-2035
  • Table 30: Europe Market Volume (Units) Forecast by Application, 2020-2035
  • Table 31: Europe Market Value (USD Million) Forecast by End-Use Industry, 2020-2035
  • Table 32: Europe Market Volume (Units) Forecast by End-Use Industry, 2020-2035
  • Table 33: East Asia Market Value (USD Million) Forecast by Country, 2020-2035
  • Table 34: East Asia Market Volume (Units) Forecast by Country, 2020-2035
  • Table 35: East Asia Market Value (USD Million) Forecast by Processing Grade, 2020-2035
  • Table 36: East Asia Market Volume (Units) Forecast by Processing Grade, 2020-2035
  • Table 37: East Asia Market Value (USD Million) Forecast by Application, 2020-2035
  • Table 38: East Asia Market Volume (Units) Forecast by Application, 2020-2035
  • Table 39: East Asia Market Value (USD Million) Forecast by End-Use Industry, 2020-2035
  • Table 40: East Asia Market Volume (Units) Forecast by End-Use Industry, 2020-2035
  • Table 41: South Asia Market Value (USD Million) Forecast by Country, 2020-2035
  • Table 42: South Asia Market Volume (Units) Forecast by Country, 2020-2035
  • Table 43: South Asia Market Value (USD Million) Forecast by Processing Grade, 2020-2035
  • Table 44: South Asia Market Volume (Units) Forecast by Processing Grade, 2020-2035
  • Table 45: South Asia Market Value (USD Million) Forecast by Application, 2020-2035
  • Table 46: South Asia Market Volume (Units) Forecast by Application, 2020-2035
  • Table 47: South Asia Market Value (USD Million) Forecast by End-Use Industry, 2020-2035
  • Table 48: South Asia Market Volume (Units) Forecast by End-Use Industry, 2020-2035
  • Table 49: Oceania Market Value (USD Million) Forecast by Country, 2020-2035
  • Table 50: Oceania Market Volume (Units) Forecast by Country, 2020-2035
  • Table 51: Oceania Market Value (USD Million) Forecast by Processing Grade, 2020-2035
  • Table 52: Oceania Market Volume (Units) Forecast by Processing Grade, 2020-2035
  • Table 53: Oceania Market Value (USD Million) Forecast by Application, 2020-2035
  • Table 54: Oceania Market Volume (Units) Forecast by Application, 2020-2035
  • Table 55: Oceania Market Value (USD Million) Forecast by End-Use Industry, 2020-2035
  • Table 56: Oceania Market Volume (Units) Forecast by End-Use Industry, 2020-2035
  • Table 57: MEA Market Value (USD Million) Forecast by Country, 2020-2035
  • Table 58: MEA Market Volume (Units) Forecast by Country, 2020-2035
  • Table 59: MEA Market Value (USD Million) Forecast by Processing Grade, 2020-2035
  • Table 60: MEA Market Volume (Units) Forecast by Processing Grade, 2020-2035
  • Table 61: MEA Market Value (USD Million) Forecast by Application, 2020-2035
  • Table 62: MEA Market Volume (Units) Forecast by Application, 2020-2035
  • Table 63: MEA Market Value (USD Million) Forecast by End-Use Industry, 2020-2035
  • Table 64: MEA Market Volume (Units) Forecast by End-Use Industry, 2020-2035

List of Figures

  • Figure 1: Global Market Volume (Units) Forecast 2020-2035
  • Figure 2: Global Market Pricing Analysis
  • Figure 3: Global Market Value (USD Million) Forecast 2020-2035
  • Figure 4: Global Market Value Share and BPS Analysis by Processing Grade, 2025 and 2035
  • Figure 5: Global Market Y-o-Y Growth Comparison by Processing Grade, 2025-2035
  • Figure 6: Global Market Attractiveness Analysis by Processing Grade
  • Figure 7: Global Market Value Share and BPS Analysis by Application, 2025 and 2035
  • Figure 8: Global Market Y-o-Y Growth Comparison by Application, 2025-2035
  • Figure 9: Global Market Attractiveness Analysis by Application
  • Figure 10: Global Market Value Share and BPS Analysis by End-Use Industry, 2025 and 2035
  • Figure 11: Global Market Y-o-Y Growth Comparison by End-Use Industry, 2025-2035
  • Figure 12: Global Market Attractiveness Analysis by End-Use Industry
  • Figure 13: Global Market Value (USD Million) Share and BPS Analysis by Region, 2025 and 2035
  • Figure 14: Global Market Y-o-Y Growth Comparison by Region, 2025-2035
  • Figure 15: Global Market Attractiveness Analysis by Region
  • Figure 16: North America Market Incremental $ Opportunity, 2025-2035
  • Figure 17: Latin America Market Incremental $ Opportunity, 2025-2035
  • Figure 18: Europe Market Incremental $ Opportunity, 2025-2035
  • Figure 19: East Asia Market Incremental $ Opportunity, 2025-2035
  • Figure 20: South Asia Market Incremental $ Opportunity, 2025-2035
  • Figure 21: Oceania Market Incremental $ Opportunity, 2025-2035
  • Figure 22: MEA Market Incremental $ Opportunity, 2025-2035
  • Figure 23: North America Market Value Share and BPS Analysis by Country, 2025 and 2035
  • Figure 24: North America Market Value Share and BPS Analysis by Processing Grade, 2025 and 2035
  • Figure 25: North America Market Y-o-Y Growth Comparison by Processing Grade, 2025-2035
  • Figure 26: North America Market Attractiveness Analysis by Processing Grade
  • Figure 27: North America Market Value Share and BPS Analysis by Application, 2025 and 2035
  • Figure 28: North America Market Y-o-Y Growth Comparison by Application, 2025-2035
  • Figure 29: North America Market Attractiveness Analysis by Application
  • Figure 30: North America Market Value Share and BPS Analysis by End-Use Industry, 2025 and 2035
  • Figure 31: North America Market Y-o-Y Growth Comparison by End-Use Industry, 2025-2035
  • Figure 32: North America Market Attractiveness Analysis by End-Use Industry
  • Figure 33: Latin America Market Value Share and BPS Analysis by Country, 2025 and 2035
  • Figure 34: Latin America Market Value Share and BPS Analysis by Processing Grade, 2025 and 2035
  • Figure 35: Latin America Market Y-o-Y Growth Comparison by Processing Grade, 2025-2035
  • Figure 36: Latin America Market Attractiveness Analysis by Processing Grade
  • Figure 37: Latin America Market Value Share and BPS Analysis by Application, 2025 and 2035
  • Figure 38: Latin America Market Y-o-Y Growth Comparison by Application, 2025-2035
  • Figure 39: Latin America Market Attractiveness Analysis by Application
  • Figure 40: Latin America Market Value Share and BPS Analysis by End-Use Industry, 2025 and 2035
  • Figure 41: Latin America Market Y-o-Y Growth Comparison by End-Use Industry, 2025-2035
  • Figure 42: Latin America Market Attractiveness Analysis by End-Use Industry
  • Figure 43: Europe Market Value Share and BPS Analysis by Country, 2025 and 2035
  • Figure 44: Europe Market Value Share and BPS Analysis by Processing Grade, 2025 and 2035
  • Figure 45: Europe Market Y-o-Y Growth Comparison by Processing Grade, 2025-2035
  • Figure 46: Europe Market Attractiveness Analysis by Processing Grade
  • Figure 47: Europe Market Value Share and BPS Analysis by Application, 2025 and 2035
  • Figure 48: Europe Market Y-o-Y Growth Comparison by Application, 2025-2035
  • Figure 49: Europe Market Attractiveness Analysis by Application
  • Figure 50: Europe Market Value Share and BPS Analysis by End-Use Industry, 2025 and 2035
  • Figure 51: Europe Market Y-o-Y Growth Comparison by End-Use Industry, 2025-2035
  • Figure 52: Europe Market Attractiveness Analysis by End-Use Industry
  • Figure 53: East Asia Market Value Share and BPS Analysis by Country, 2025 and 2035
  • Figure 54: East Asia Market Value Share and BPS Analysis by Processing Grade, 2025 and 2035
  • Figure 55: East Asia Market Y-o-Y Growth Comparison by Processing Grade, 2025-2035
  • Figure 56: East Asia Market Attractiveness Analysis by Processing Grade
  • Figure 57: East Asia Market Value Share and BPS Analysis by Application, 2025 and 2035
  • Figure 58: East Asia Market Y-o-Y Growth Comparison by Application, 2025-2035
  • Figure 59: East Asia Market Attractiveness Analysis by Application
  • Figure 60: East Asia Market Value Share and BPS Analysis by End-Use Industry, 2025 and 2035
  • Figure 61: East Asia Market Y-o-Y Growth Comparison by End-Use Industry, 2025-2035
  • Figure 62: East Asia Market Attractiveness Analysis by End-Use Industry
  • Figure 63: South Asia Market Value Share and BPS Analysis by Country, 2025 and 2035
  • Figure 64: South Asia Market Value Share and BPS Analysis by Processing Grade, 2025 and 2035
  • Figure 65: South Asia Market Y-o-Y Growth Comparison by Processing Grade, 2025-2035
  • Figure 66: South Asia Market Attractiveness Analysis by Processing Grade
  • Figure 67: South Asia Market Value Share and BPS Analysis by Application, 2025 and 2035
  • Figure 68: South Asia Market Y-o-Y Growth Comparison by Application, 2025-2035
  • Figure 69: South Asia Market Attractiveness Analysis by Application
  • Figure 70: South Asia Market Value Share and BPS Analysis by End-Use Industry, 2025 and 2035
  • Figure 71: South Asia Market Y-o-Y Growth Comparison by End-Use Industry, 2025-2035
  • Figure 72: South Asia Market Attractiveness Analysis by End-Use Industry
  • Figure 73: Oceania Market Value Share and BPS Analysis by Country, 2025 and 2035
  • Figure 74: Oceania Market Value Share and BPS Analysis by Processing Grade, 2025 and 2035
  • Figure 75: Oceania Market Y-o-Y Growth Comparison by Processing Grade, 2025-2035
  • Figure 76: Oceania Market Attractiveness Analysis by Processing Grade
  • Figure 77: Oceania Market Value Share and BPS Analysis by Application, 2025 and 2035
  • Figure 78: Oceania Market Y-o-Y Growth Comparison by Application, 2025-2035
  • Figure 79: Oceania Market Attractiveness Analysis by Application
  • Figure 80: Oceania Market Value Share and BPS Analysis by End-Use Industry, 2025 and 2035
  • Figure 81: Oceania Market Y-o-Y Growth Comparison by End-Use Industry, 2025-2035
  • Figure 82: Oceania Market Attractiveness Analysis by End-Use Industry
  • Figure 83: MEA Market Value Share and BPS Analysis by Country, 2025 and 2035
  • Figure 84: MEA Market Value Share and BPS Analysis by Processing Grade, 2025 and 2035
  • Figure 85: MEA Market Y-o-Y Growth Comparison by Processing Grade, 2025-2035
  • Figure 86: MEA Market Attractiveness Analysis by Processing Grade
  • Figure 87: MEA Market Value Share and BPS Analysis by Application, 2025 and 2035
  • Figure 88: MEA Market Y-o-Y Growth Comparison by Application, 2025-2035
  • Figure 89: MEA Market Attractiveness Analysis by Application
  • Figure 90: MEA Market Value Share and BPS Analysis by End-Use Industry, 2025 and 2035
  • Figure 91: MEA Market Y-o-Y Growth Comparison by End-Use Industry, 2025-2035
  • Figure 92: MEA Market Attractiveness Analysis by End-Use Industry
  • Figure 93: Global Market - Tier Structure Analysis
  • Figure 94: Global Market - Company Share Analysis

Frequently Asked Questions

What is the projected size of the unbleached softwood kraft pulp market by 2035?

The market is projected to reach USD 2.4 billion by 2035, growing from USD 1.6 billion in 2025, at a CAGR of 4.6%.

Which product type segment is growing the fastest in the unbleached softwood kraft pulp market?

The northern unbleached softwood kraft pulp segment is growing the fastest, with a CAGR of 5.6%.

Which application segment dominates the unbleached softwood kraft pulp market?

The packaging segment dominates, holding a 41% market share in 2025 and growing at a CAGR of 5.8%.

What are the major factors driving demand for unbleached softwood kraft pulp globally?

Key drivers include rising demand for sustainable, recyclable packaging, regulatory pressure against bleached and plastic materials, and innovation in molded fiber applications.

Who are the leading players in the global unbleached softwood kraft pulp industry?

Top players include Stora Enso Ovi, Canfor Corporation, Ahlstrom-Munksjo, Nippon Paper Industries Co., Ltd, Domtar Corporation, Arauco North America, Ilim Group, Rottneros AB, and Port Townsend Paper Company.

Explore Similar Insights

Future Market Insights

Unbleached Softwood Kraft Pulp Market