Reports

- Global Locations -

Headquarters

Future Market Insights, Inc.

Christiana Corporate, 200
Continental Drive, Suite 401,
Newark, Delaware - 19713,
United States

T: +1-845-579-5705

Americas

Future Market Insights, Inc.

616 Corporate Way, Suite 2-9018,
Valley Cottage, NY 10989, United States

T: +1-347-918-3531

MEA

Future Market Insights

1602-6 Jumeirah Bay X2 Tower, Plot No: JLT-PH2-X2A,
Jumeirah Lakes Towers, Dubai,
United Arab Emirates

Europe

Future Market Insights

3rd Floor, 207 Regent Street,
W1B 3HH London
United Kingdom

T: + 44 (0) 20 8123 9659
D: +44 (0) 20 3287 4268

Asia Pacific

Future Market Insights

IndiaLand Global Tech Park, Unit UG-1, Behind Grand HighStreet, Phase 1, Hinjawadi, MH, Pune – 411057, India

Global Pulp Molding Tooling Market Outlook

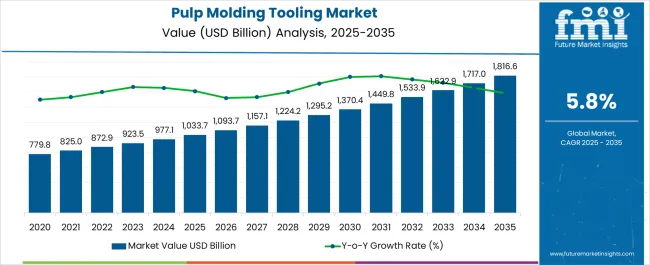
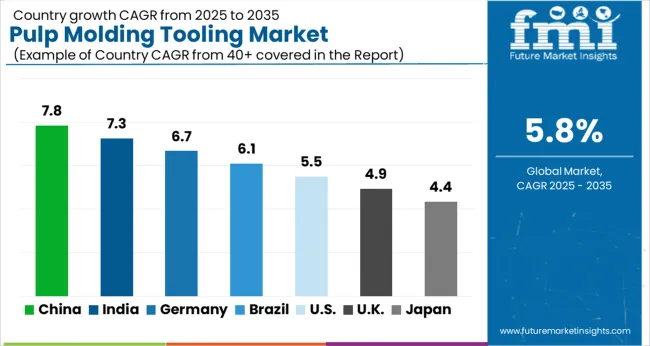
The global pulp molding tooling market size is projected to be worth US$ 923.5 Million in 2023. The market is likely to surpass US$ 1,622.9 Million by 2033 at a CAGR of 5.8% during the forecast period.

Pulp molding, also known as molded pulp or molded fiber, is a type of sustainable packaging manufactured from repurposed paper goods. Due to growing environmental concerns and strict restrictions on single-use plastics, the demand for eco-friendly packaging alternatives has been steadily increasing. Pulp molding equipment can be manufactured and configured to produce a wide range of goods like as trays, containers, egg cartoons for electronic devices, and protective packaging. The important trend in the pulp molding tooling industry is the emphasis on automation and efficiency. Automation not only boosts overall production, but it also ensures product consistency and reduces the possibility of human error. Manufacturers are progressively employing automated pulp molding methods in order to increase productivity and reduce work force costs.

Geographically, Asia-Pacific is developing as a major player in the pulp molding tooling market. Rapid industrialization and urbanization in nations such as India, China, and Southeast Asia are increasing demand for environmentally friendly packaging. As a result of the growing emphasis on circular economy principles, automation, and efficiency, sustainable practices gains, market demand has expanded.

Driving Factors Propelling the Demand for Global Pulp Molding Tooling Market Include:

  • Consumers have become more conscious of the negative environmental impact of plastic packaging; there is a substantial shift towards biodegradable packaging solutions. Pulp molding tooling provides a sustainable option by utilising biodegradable and compostable recycled paper goods.
  • Rising disposable income in emerging nations, particularly in Asia-Pacific and Latin America, is driving growth in packaged consumer goods consumption. In these markets, pulp molded packaging provides a cost-effective and environmentally friendly solution for product packaging.
  • Pulp molding tooling allows for the optimal utilisation of recovered paper waste, decreasing landfill waste and conserving natural resources. Waste paper is converted into valuable packaging items during the manufacturing process, contributing to a more sustainable waste management system.
  • Manufacturers can enter niche markets that demand specialised packaging solutions by using pulp molding tooling. The healthcare and pharmaceutical industries, for example, have severe criteria for sterile and protected packaging. Pulp molded items, like as medical trays, biohazard containers, and surgical instrument packaging, can be created to satisfy these specific needs, opening up new market opportunities.
  • Due to its superior cushioning and shock-absorbing capabilities, pulp molding tooling is a perfect solution for delivering fragile and delicate products.

Major restraint factors holding back the global Pulp Molding Tooling Market:

  • Products made from pulp can be delicate and easily damaged during transit and handling. They may necessitate careful packaging and other safeguards to avoid damage. For organisations that require durable packaging solutions for delicate or high-value commodities, the fragility of pulp-molded products might be a constraint.
  • When compared to other traditional packaging technologies, pulp molding manufacturing processes can be slower and less efficient. Molding, drying, and curing time can result in longer production cycles and reduced output rates.
  • The inherent moisture absorption of pulp molded items might be a restriction in areas with high humidity or exposure to liquids. Although surface coatings and treatments can help to improve moisture resistance, extended exposure to moisture can have an impact on the performance and longevity of pulp-molded packaging. This constraint may limit the usage of pulp molding in businesses that require moisture protection, such as the food and beverage industry.

Parallel Growth Opportunities Are Witnessing for Market Growth:

  • The growing global emphasis on sustainability, as well as the demand for biodegradable packaging solutions, provide a considerable growth opportunity for pulp molding tooling. When it comes to environmentally acceptable alternatives to single-use plastics, pulp-molded packaging stands out as a viable solution. The expanding consumer desire for biodegradable packaging creates opportunities for the pulp molding tooling market to flourish.
  • The medical and healthcare industries are significant growth markets for pulp molding tooling. Medical instruments, equipment, and pharmaceutical products require sterile and protected packaging. For these uses, pulp-molded packaging can provide cost-effective, environmentally sustainable, and customisable solutions.
  • Ongoing R&D in material science and coating technologies provide the pulp molding tooling market with unique growth potential. Material innovations, like as biodegradable additives and barrier coatings, can improve the performance and functionality of pulp molded goods. These developments can solve pulp molding's shortcomings, such as moisture resistance, heat resistance and durability, making it more competitive with standard packaging materials.
  • Pulp moulded containers, trays and cups are well-suited for food and beverage industries because they provide enough protection, are biodegradable, and can be customised to meet individual requirements; nonetheless, there is tremendous market growth potential.

Latest Key Trends Propelling in Pulp Molding Tooling Market:

  • The pulp molding tooling market is being driven by major trends like as automation and scalability. Automation technology advancements enable manufacturers to optimise production processes, increase efficiency, and reach better output rates.
  • Beyond traditional applications, pulp molding tooling is growing its footprint in new industry verticals. Pulp molded packaging solutions are rapidly being used in industries such as electronics, cosmetics, personal care, and home appliances.
  • Smart technology integration in pulp molding tooling processes is a new trend. Smart technologies provide real-time monitoring, predictive maintenance, and process optimisation in pulp molding processes, resulting in increased productivity and uniformity.
Attribute Details
Pulp Molding Tooling Market Size (2023) US$ 923.5 Million
Pulp Molding Tooling Market Projected Size (2033) US$ 1622.9 Million
Value CAGR (2023 to 2033) 5.8%

Don't pay for what you don't need

Customize your report by selecting specific countries or regions and save 30%!

2018 to 2022 Global Pulp Molding Tool Market Demand Outlook Compared to 2023 to 2033 Forecast

The historical demand for global pulp moulding tooling has shown significant increase, and the market prognosis shows a positive future outlook. The need for pulp moulding tooling has been pushed over the previous decade by a dramatic trend towards sustainable packaging solutions, increased environmental concerns, and stricter plastic consumption rules. Looking ahead, the need for pulp moulding tools is expected to stay strong. The worldwide market is prepared to benefit from the increasing emphasis on sustainability and circular economy practises. With a growing preference for recyclable, biodegradable, and renewable packaging materials, pulp moulded packaging ideally matches with these environmentally aware goals, placing itself as a preferred solution.

The historical demand for global pulp moulding tooling has been robust, and the prediction predicts a healthy future trajectory. Sustainability initiatives, legislative support, market penetration in new industries, technology breakthroughs, and the expansion of emerging markets all contribute to the creation of one-of-a-kind growth prospects.

Future Market Outlook Global Pulp Molding Tooling Market

The global pulp molding tooling industry's future market growth is quite promising, with various unique aspects impacting its trajectory. Demand for pulp molded products is predicted to skyrocket as sustainability becomes a key aspect of packaging strategy around the world. Pulp moulding tooling has various environmental benefits, including the fact that it is compostable, biodegradable, and created from recyclable components.

The integration of advanced technology is the market prognosis for the future. This integration improves production efficiency, product uniformity, and reduces labour expenses. Smart technologies also allow for real-time monitoring, predictive maintenance, and quality control, resulting in more efficient operations and increased output rates. Factors such as the increasing emphasis on advanced technology integration, sustainability, collaborative activities, a focus on product development and adaptation, circular economy initiatives, and the expansion of emerging countries all contribute to the market's favourable trajectory.
Ismail Sutaria
Ismail Sutaria

Principal Consultant

Talk to Analyst

Find your sweet spots for generating winning opportunities in this market.

Comparative View of the Pulp Molding Tooling Market

Pulp Molding Tooling Market:

Attributes Pulp Molding Tooling Market
CAGR (2023 to 2033) 5.8%
Market Value (2033) US$ 1,622.9 million
Opportunity Environmentally acceptable alternatives to single-use plastics, pulp moulded packaging stands out as a viable solution.
Key Trends Hybrid packaging solutions that blend several materials are gaining market popularity.

Molded Fiber Pulp Packaging Market:

Attributes Molded Fiber Pulp Packaging Market
CAGR (2023 to 2033) 5.1%
Market Value (2033) US$ 14.09 billion
Opportunity Demand for sustainable packaging needs
Key Trends Rising Retail Industry

Country-wise Insights

India Accounts a Significant Market Share in Pulp Molding Tooling Market

Country India
Market Size (US$ million) by End of Forecast Period (2033) US$ 118.5 million
CAGR % 2023 to End of Forecast (2033) 5.8%

India's vast population and increasing middle class are important market demand factors. Rising disposable incomes and shifting customer preferences have raised demand for packaged items in a variety of businesses. Pulp molded packaging is well-liked by Indian consumers due to its versatility, protection, and aesthetic appeal, supporting the demand for pulp molding tooling. India's substantial agricultural presence contributes to the demand for pulp moulding tooling. The agricultural business generates a significant amount of waste material, such as bagasse and straw, which can be used as raw materials in pulp molded goods. The availability of agricultural waste contributes to the long-term viability and cost-effectiveness of pulp molding in India. However, India's noteworthy market share in the pulp molding tooling market can be attributed to the country's thriving manufacturing sector, increasing emphasis on sustainability, supportive government initiatives, rising consumer demand for recyclable packaging, and the availability of agricultural waste.

China Owns a Strong Market Base for Pulp Molding Tooling Market

Country China
Market Size (US$ million) by End of Forecast Period (2033) US$ 219.1 million
CAGR % 2023 to End of Forecast (2033) 6.3%

China is a market leader in the global pulp molding tooling market. China has a high demand for effective and environmentally friendly packaging solutions, owing to the country's domestic consumption as well as its prominence as a global industrial hub. The dominance of China in the global paper and pulp industry provides a solid foundation for the growth of the pulp molding tooling market. The availability of sufficient raw materials, such as recycled paper, enables the creation of pulp moulded products to be cost-effective. China has a competitive advantage in the worldwide pulp moulding tooling market due to its resource advantage and manufacturing competence. Despite the fact that the country is well positioned to meet the demand for sustainable packaging solutions, which strengthens its market position in the pulp moulding tooling business.

Get the data you need at a Fraction of the cost

Personalize your report by choosing insights you need
and save 40%!

Category-wise Insights

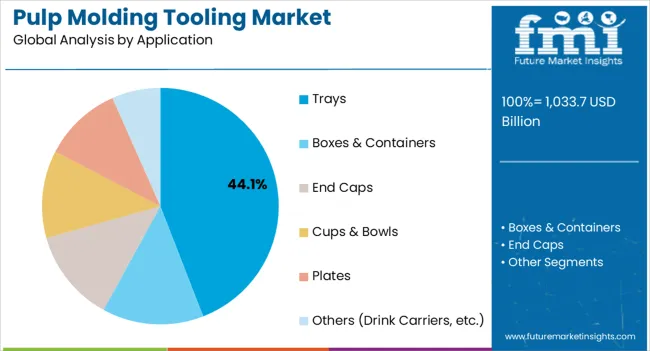
How Trays Segment Spurring the Market Growth?

With a CAGR of 5.3% from 2022 to 2033, the egg packaging segment is expected to dominate the pulp molding tooling industry. Trays are essential in packaging and transportation in a variety of industries. The pulp molding tooling market manufactures trays for a variety of applications, including food and beverage packaging, egg packaging, pharmaceutical packaging, cosmetics packaging, and more. Through providing the demand for sustainable and adaptable packaging solutions, the trays segment is driving the growth of the pulp molding tooling market. Pulp molded trays boxes are popular in a variety of industries, including food and beverage, egg packaging, electronics, cosmetics, and pharmaceuticals, due to their eco-friendliness, protective characteristics, and aesthetic appeal. With a greater emphasis on sustainability, the trays category is projected to continue driving the growth of the pulp molding tooling market.

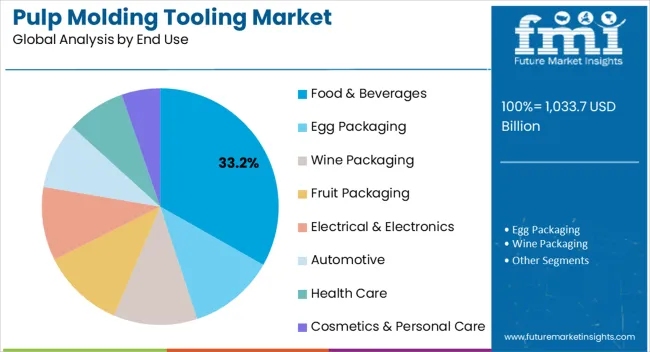
How Egg Packaging & Wine Packaging Is Leading Role in Market?

Eggs are sensitive and must be transported and stored in secure and protective packaging. Because of its superior cushioning, stress absorption, and insulation capabilities, pulp moulded egg packaging is a suitable choice. Individual eggs can be securely held and separated in the moulded trays or cartons, preventing breakage and preserving product integrity. The egg-packaging category is a prominent driver of the pulp moulding tooling market, owing to rising egg demand and the need for sustainable packaging solutions. The pulp molding tooling market is dominated by wine packaging. The wine industry necessitates packaging solutions that not only protect the bottles but also improve their visual appeal and branding. Pulp moulded wine packaging can be made with elaborate patterns and textures, resulting in an eye-catching presentation that is consistent with the premium image of wine. The distinct requirements of egg packaging and wine packaging, together with the advantages of pulp moulding, have positioned these categories as industry leaders in the pulp molding tooling market.
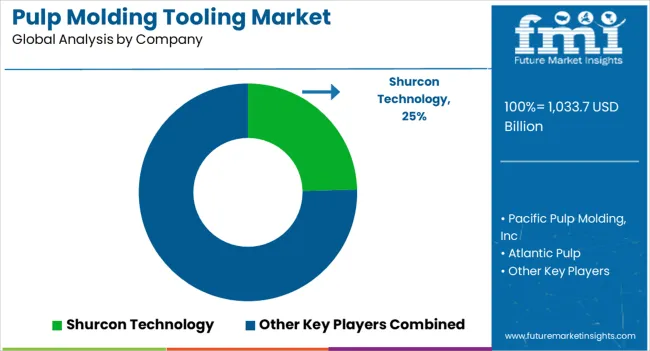
How market players stay competitive in global Pulp Molding Tooling market?

Players in the global pulp molding tooling market use a variety of techniques to maintain their competitive advantage and fulfil changing client expectations. Market participants in the global pulp molding tooling market distinguish and remain competitive by focusing on constant innovation in product design and technology, a commitment to sustainability and strong customer partnerships. They position themselves as industry leaders and respond to the different needs of clients by offering creative and advanced solutions, customizing designs, and prioritizing environmental responsibility, eventually driving their success and growth.

Key strategies in pulp molding tooling market:

Product Innovation

Manufacturers are quickly respond to changing market demands and customise their goods with modular tooling systems, eliminating the need for expensive retooling. This innovative approach to product development enables manufacturers to optimise production processes, streamline operations, and efficiently serve to the different needs of clients in the pulp molding business.

Customization:

Customization is crucial in the worldwide pulp molding tooling market because it allows market participants to offer personalized solutions that fit the individual needs of consumers. Customization includes mold size, form, and configuration, allowing producers to make a wide range of pulp molded goods, including as containers, trays and packaging inserts that properly meet the intended uses.

Sustainability:

The pulp molding tooling market is deeply embedded in sustainability, with market participants embracing innovative efforts like as using recycled and renewable resources, establishing energy-efficient production processes, and fostering the circular economy. They not only address the growing need for eco-friendly solutions by prioritising sustainability, but they also contribute to a greener and more resilient future for the packaging sector as a whole.

Key Players in the Pulp Molding Tooling Market

  • Shurcon Technology
  • Pacific Pulp Molding, Inc
  • Atlantic Pulp
  • MFT-CKF, Inc.
  • Pulp Moulding Dies Inc.
  • Keiding, Inc.
  • TPM-USA LLC.
  • Qisheng Thermoforming Machinery Co.,Ltd

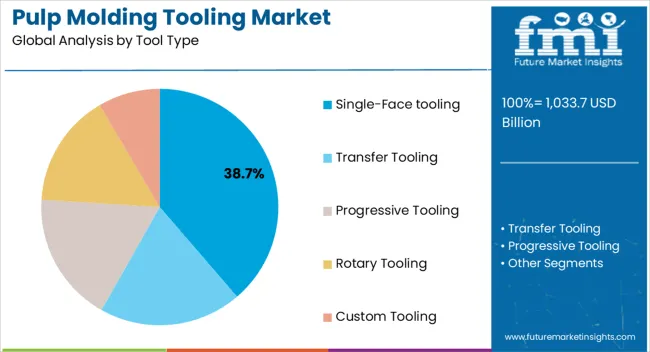
Segmentation Analysis of the Pulp Molding Tooling Market

Tool Type:

  • Single-Face tooling
  • Transfer Tooling
  • Progressive Tooling
  • Rotary Tooling
  • Custom Tooling

Application:

  • Trays
  • Boxes & Containers
  • End Caps
  • Cups & Bowls
  • Plates
  • Others (Drink Carriers, etc.)

End Use:

  • Food & Beverages
  • Egg Packaging
  • Wine Packaging
  • Fruit Packaging
  • Electrical & Electronics
  • Automotive
  • Health Care
  • Cosmetics & Personal Care

Frequently Asked Questions

How Big will be the Pulp Molding Tooling Market by 2033?

The market is estimated to reach US$ 1,622.9 million by 2033.

What Drives Sales of Pulp Molding Tooling?

Growing demand for eco-friendly and cost-effective product packaging is expected to drive pulp molding tooling sales.

What Key Trends are Driving the Pulp Molding Tooling Market?

Automation and scalability may drive market growth over the coming years.

What Opportunities Await for the Market Players?

Surging emphasis on sustainability and research and development may provide growth prospects for the market players.

What is the Growth Forecast for Pulp Molding Tooling Market?

The market is forecast to register a CAGR of 5.8% through 2033.

Table of Content

1. Executive Summary

    1.1. Global Market Outlook

    1.2. Market Analysis

    1.3. Analysis and Recommendations

2. Market Overview

    2.1. Market Coverage / Taxonomy

    2.2. Market Definition / Scope / Limitations

3. Key Market Trends

    3.1. Key Trends Impacting the Market

    3.2. Sustainable Trends

    3.3. Technological Trends

    3.4. Product Innovation / Development Trends

4. Key Success Factors

    4.1. Product Adoption / Usage Analysis

    4.2. Product USPs / Features

    4.3. Strategic Promotional Strategies

    4.4. Go-to-market Strategies

5. Global Market Demand Analysis 2018 to 2022 and Forecast, 2023 to 2033

    5.1. Historical Market Volume (Tons) Analysis, 2018 to 2022

    5.2. Current and Future Market Volume (Tons) Projections, 2023 to 2033

    5.3. Y-o-Y Growth Trend Analysis

6. Global Market - Pricing Analysis

    6.1. Regional Pricing Analysis

    6.2. Global Average Pricing Analysis Benchmark

7. Global Market Demand (in Value or Size in US$ Million) Analysis 2018 to 2022 and Forecast, 2023 to 2033

    7.1. Historical Market Value (US$ Million) Analysis, 2018 to 2022

    7.2. Current and Future Market Value (US$ Million) Projections, 2023 to 2033

        7.2.1. Y-o-Y Growth Trend Analysis

        7.2.2. Absolute $ Opportunity Analysis

8. Market Background

    8.1. Global Pills Packaging Market Overview

    8.2. Forecast Factors - Relevance & Impact

    8.3. Value Chain Analysis & Profitability Margin

        8.3.1. Exhaustive List of Raw Suppliers

        8.3.2. Exhaustive List of Distribution Machines/ Converters/Distributors

        8.3.3. Exhaustive List of Brand Owners/ Customer Base

    8.4. Case-based Scenario – Impact Assessment

        8.4.1. Current Statistics

        8.4.2. Short-Mid-Long Term Outlook

        8.4.3. Likely Rebound

    8.5. Market Dynamics

        8.5.1. Drivers

        8.5.2. Restraints

        8.5.3. Opportunity Analysis

    8.6. Supply Demand Analysis

        8.6.1. Import /Export Analysis

9. Global Market Analysis 2018 to 2022 and Forecast 2023 to 2033, By Tool Type

    9.1. Introduction/Key Findings

    9.2. Historical Market Size (US$ Million) and Volume (Tons) Analysis By Packaging Format, 2018-2022

    9.3. Current and Future Market Size (US$ Million) and Volume (Tons) Analysis and Forecast By Packaging Format, 2023-2033

        9.3.1. Single-Face Tooling

        9.3.2. Transfer Tooling

        9.3.3. Progressive Tooling

        9.3.4. Rotary Tooling

        9.3.5. Custom Tooling

    9.4. Market Attractiveness Analysis By Tool Type

10. Global Market Analysis 2018 to 2022 and Forecast 2023 to 2033, By Application

    10.1. Introduction / Key Findings

    10.2. Historical Market Size (US$ Million) and Volume (Tons) Analysis By Application, 2018 to 2022

    10.3. Current and Future Market Size (US$ Million) and Volume (Tons) Analysis and Forecast By Application, 2023 to 2033

        10.3.1. Trays

        10.3.2. Boxes & Containers

        10.3.3. End Caps

        10.3.4. Plates

        10.3.5. Others (Drink Carriers, etc.)

    10.4. Market Attractiveness Analysis By Application

11. Global Market Analysis 2018 to 2022 and Forecast 2023 to 2033, By End Use

    11.1. Introduction / Key Findings

    11.2. Historical Market Size (US$ Million) and Volume (Tons) Analysis By End Use, 2018 to 2022

    11.3. Current and Future Market Size (US$ Million) and Volume (Tons) Analysis and Forecast By End Use, 2023 to 2033

        11.3.1. Food & Beverages

        11.3.2. Egg Packaging

        11.3.3. Wine Packaging

        11.3.4. Fruit Packaging

        11.3.5. Electrical & Electronics

        11.3.6. Automotive

        11.3.7. Healthcare

        11.3.8. Cosmetic & Personal Care

    11.4. Market Attractiveness Analysis By End Use

12. Global Market Analysis 2018 to 2022 and Forecast 2023 to 2033, By Region

    12.1. Introduction / Key Findings

    12.2. Historical Market Size (US$ Million) and Volume (Tons) Analysis By Region, 2018 to 2022

    12.3. Current and Future Market Size (US$ Million) and Volume (Tons) Analysis and Forecast By Region, 2023 to 2033

        12.3.1. North America

        12.3.2. Latin America

        12.3.3. East Asia

        12.3.4. South Asia & Pacific

        12.3.5. Western Europe

        12.3.6. Eastern Europe

        12.3.7. Central Asia

        12.3.8. Russia & Belarus

        12.3.9. Balkan & Baltic Countries

        12.3.10. Middle East and Africa (MEA)

    12.4. Market Attractiveness Analysis By Region

13. North America Market Analysis 2018 to 2022 and Forecast 2023 to 2033

    13.1. Introduction / Key Findings

    13.2. Historical Market Size (US$ Million) and Volume (Tons) Analysis by Market Taxonomy, 2018 to 2022

    13.3. Current Market Size (US$ Million) and Volume (Tons) Analysis and Forecast by Market Taxonomy, 2023 to 2033

        13.3.1. By Country

            13.3.1.1. USA

            13.3.1.2. Canada

        13.3.2. By Tool Type

        13.3.3. By Application

        13.3.4. By End Use

    13.4. Market Attractiveness Analysis

        13.4.1. By Country

        13.4.2. By Tool Type

        13.4.3. By Application

        13.4.4. By End Use

14. Latin America Market Analysis 2018 to 2022 and Forecast 2023 to 2033

    14.1. Introduction / Key Findings

    14.2. Historical Market Size (US$ Million) and Volume (Tons) Analysis by Market Taxonomy, 2018 to 2022

    14.3. Current Market Size (US$ Million) and Volume (Tons) Analysis and Forecast by Market Taxonomy, 2023 to 2033

        14.3.1. By Country

            14.3.1.1. Brazil

            14.3.1.2. Mexico

            14.3.1.3. Argentina

            14.3.1.4. Rest of Latin America

        14.3.2. By Tool Type

        14.3.3. By Application

        14.3.4. By End Use

    14.4. Market Attractiveness Analysis

        14.4.1. By Country

        14.4.2. By Tool Type

        14.4.3. By Application

        14.4.4. By End Use

15. East Asia Market Analysis 2018 to 2022 and Forecast 2023 to 2033

    15.1. Introduction / Key Findings

    15.2. Historical Market Size (US$ Million) and Volume (Tons) Analysis by Market Taxonomy, 2018 to 2022

    15.3. Current Market Size (US$ Million) and Volume (Tons) Analysis and Forecast by Market Taxonomy, 2023 to 2033

        15.3.1. By Country

            15.3.1.1. China

            15.3.1.2. Japan

            15.3.1.3. South Korea

        15.3.2. By Tool Type

        15.3.3. By Application

        15.3.4. By End Use

    15.4. Market Attractiveness Analysis

        15.4.1. By Country

        15.4.2. By Tool Type

        15.4.3. By Application

        15.4.4. By End Use

16. South Asia & Pacific Market Analysis 2018 to 2022 and Forecast 2023 to 2033

    16.1. Introduction / Key Findings

    16.2. Historical Market Size (US$ Million) and Volume (Tons) Analysis by Market Taxonomy, 2018 to 2022

    16.3. Current Market Size (US$ Million) and Volume (Tons) Analysis and Forecast by Market Taxonomy, 2023 to 2033

        16.3.1. By Country

            16.3.1.1. India

            16.3.1.2. ASEAN

            16.3.1.3. Australia & New Zealand

        16.3.2. By Tool Type

        16.3.3. By Application

        16.3.4. By End Use

    16.4. Market Attractiveness Analysis

        16.4.1. By Country

        16.4.2. By Tool Type

        16.4.3. By Application

        16.4.4. By End Use

17. Western Europe Market Analysis 2018 to 2022 and Forecast 2023 to 2033

    17.1. Introduction / Key Findings

    17.2. Historical Market Size (US$ million) and Volume (Tons) Analysis by Market Taxonomy, 2018 to 2022

    17.3. Current Market Size (US$ million) and Volume (Tons) Analysis and Forecast by Market Taxonomy, 2023 to 2033

        17.3.1. By Country

            17.3.1.1. Germany

            17.3.1.2. France

            17.3.1.3. Spain

            17.3.1.4. Italy

            17.3.1.5. United Kingdom

            17.3.1.6. BENELUX

            17.3.1.7. Nordics

            17.3.1.8. Rest of Western Europe

        17.3.2. By Tool Type

        17.3.3. By Application

        17.3.4. By End Use

    17.4. Market Attractiveness Analysis

        17.4.1. By Country

        17.4.2. By Tool Type

        17.4.3. By Application

        17.4.4. By End Use

18. Eastern Europe Market Analysis 2018 to 2022 and Forecast 2023 to 2033

    18.1. Introduction / Key Findings

    18.2. Historical Market Size (US$ million) and Volume (Tons) Analysis by Market Taxonomy, 2018 to 2022

    18.3. Current Market Size (US$ million) and Volume (Tons) Analysis and Forecast by Market Taxonomy, 2023 to 2033

        18.3.1. By Country

            18.3.1.1. Poland

            18.3.1.2. Hungary

            18.3.1.3. Austria

            18.3.1.4. Czech Republic

            18.3.1.5. Rest of Eastern Europe

        18.3.2. By Tool Type

        18.3.3. By Application

        18.3.4. By End Use

    18.4. Market Attractiveness Analysis

        18.4.1. By Country

        18.4.2. By Tool Type

        18.4.3. By Application

        18.4.4. By End Use

19. Central Asia Market Analysis 2018 to 2022 and Forecast 2023 to 2033

    19.1. Introduction / Key Findings

    19.2. Historical Market Size (US$ million) and Volume (Tons) Analysis by Market Taxonomy, 2018 to 2022

    19.3. Current Market Size (US$ million) and Volume (Tons) Analysis and Forecast by Market Taxonomy, 2023 to 2033

        19.3.1. By Country

            19.3.1.1. Kazakhstan

            19.3.1.2. Kyrgyzstan

            19.3.1.3. Tajikistan

            19.3.1.4. Turkmenistan

            19.3.1.5. Uzbekistan

        19.3.2. By Tool Type

        19.3.3. By Application

        19.3.4. By End Use

    19.4. Market Attractiveness Analysis

        19.4.1. By Country

        19.4.2. By Tool Type

        19.4.3. By Application

        19.4.4. By End Use

20. Russia & Belarus Market Analysis 2018 to 2022 and Forecast 2023 to 2033

    20.1. Introduction / Key Findings

    20.2. Historical Market Size (US$ million) and Volume (Tons) Analysis by Market Taxonomy, 2018 to 2022

    20.3. Current Market Size (US$ million) and Volume (Tons) Analysis and Forecast by Market Taxonomy, 2023 to 2033

        20.3.1. By Country

            20.3.1.1. Russia

            20.3.1.2. Belarus

        20.3.2. By Tool Type

        20.3.3. By Application

        20.3.4. By End Use

    20.4. Market Attractiveness Analysis

        20.4.1. By Country

        20.4.2. By Tool Type

        20.4.3. By Application

        20.4.4. By End Use

21. Balkan Countries Market Analysis 2018 to 2022 and Forecast 2023 to 2033

    21.1. Introduction / Key Findings

    21.2. Historical Market Size (US$ million) and Volume (Tons) Analysis by Market Taxonomy, 2018 to 2022

    21.3. Current Market Size (US$ million) and Volume (Tons) Analysis and Forecast by Market Taxonomy, 2023 to 2033

        21.3.1. By Country

            21.3.1.1. Romania

            21.3.1.2. Greece

            21.3.1.3. Bulgaria

        21.3.2. By Tool Type

        21.3.3. By Application

        21.3.4. By End Use

    21.4. Market Attractiveness Analysis

        21.4.1. By Country

        21.4.2. By Tool Type

        21.4.3. By Application

        21.4.4. By End Use

22. Baltic Countries Market Analysis 2018 to 2022 and Forecast 2023 to 2033

    22.1. Introduction / Key Findings

    22.2. Historical Market Size (US$ million) and Volume (Tons) Analysis by Market Taxonomy, 2018 to 2022

    22.3. Current Market Size (US$ million) and Volume (Tons) Analysis and Forecast by Market Taxonomy, 2023 to 2033

        22.3.1. By Country

            22.3.1.1. Lithuania

            22.3.1.2. Estonia

            22.3.1.3. Latvia

        22.3.2. By Tool Type

        22.3.3. By Application

        22.3.4. By End Use

    22.4. Market Attractiveness Analysis

        22.4.1. By Country

        22.4.2. By Tool Type

        22.4.3. By Application

        22.4.4. By End Use

23. Middle East & Africa Market Analysis 2018 to 2022 and Forecast 2023 to 2033

    23.1. Introduction / Key Findings

    23.2. Historical Market Size (US$ million) and Volume (Tons) Analysis by Market Taxonomy, 2018 to 2022

    23.3. Current Market Size (US$ million) and Volume (Tons) Analysis and Forecast by Market Taxonomy, 2023 to 2033

        23.3.1. By Country

            23.3.1.1. GCC Countries

            23.3.1.2. Turkey

            23.3.1.3. Northern Africa

            23.3.1.4. South Africa

            23.3.1.5. Israel

            23.3.1.6. Saudi Arabia

        23.3.2. By Tool Type

        23.3.3. By Application

        23.3.4. By End Use

    23.4. Market Attractiveness Analysis

        23.4.1. By Country

        23.4.2. By Tool Type

        23.4.3. By Application

        23.4.4. By End Use

24. Country wise Market Analysis 2023 & 2033

    24.1. USA Market Analysis

        24.1.1. By Tool Type

        24.1.2. By Application

        24.1.3. By End Use

    24.2. Canada Market Analysis

        24.2.1. By Tool Type

        24.2.2. By Application

        24.2.3. By End Use

    24.3. Brazil Market Analysis

        24.3.1. By Tool Type

        24.3.2. By Application

        24.3.3. By End Use

    24.4. Mexico Market Analysis

        24.4.1. By Tool Type

        24.4.2. By Application

        24.4.3. By End Use

    24.5. Germany Market Analysis

        24.5.1. By Tool Type

        24.5.2. By Application

        24.5.3. By End Use

    24.6. UK Market Analysis

        24.6.1. By Tool Type

        24.6.2. By Application

        24.6.3. By End Use

    24.7. Spain Market Analysis

        24.7.1. By Tool Type

        24.7.2. By Application

        24.7.3. By End Use

    24.8. France Market Analysis

        24.8.1. By Tool Type

        24.8.2. By Application

        24.8.3. By End Use

    24.9. Italy Market Analysis

        24.9.1. By Tool Type

        24.9.2. By Application

        24.9.3. By End Use

    24.10. Russia Market Analysis

        24.10.1. By Tool Type

        24.10.2. By Application

        24.10.3. By End Use

    24.11. China Market Analysis

        24.11.1. By Tool Type

        24.11.2. By Material

        24.11.3. By End Use

    24.12. Japan Market Analysis

        24.12.1. By Tool Type

        24.12.2. By Application

        24.12.3. By End Use

25. Market Structure Analysis

    25.1. Market Analysis by Tier of Companies

    25.2. Market Share Analysis of Top Players

    25.3. Market Presence Analysis

26. Competition Analysis

    26.1. Competition Dashboard

    26.2. Competition Benchmarking

    26.3. Competition Deep Dive 

        26.3.1. Shurcon Technology

            26.3.1.1. Overview

            26.3.1.2. Product Portfolio

            26.3.1.3. Sales Footprint

            26.3.1.4. Strategy Overview

        26.3.2. Pacific Pulp Molding, Inc

            26.3.2.1. Overview

            26.3.2.2. Product Portfolio

            26.3.2.3. Sales Footprint

            26.3.2.4. Strategy Overview

        26.3.3. Atlantic Pulp

            26.3.3.1. Overview

            26.3.3.2. Product Portfolio

            26.3.3.3. Sales Footprint

            26.3.3.4. Strategy Overview

        26.3.4. MFT-CKF, Inc.

            26.3.4.1. Overview

            26.3.4.2. Product Portfolio

            26.3.4.3. Sales Footprint

            26.3.4.4. Strategy Overview

        26.3.5. Pulp Moulding Dies Inc.

            26.3.5.1. Overview

            26.3.5.2. Product Portfolio

            26.3.5.3. Sales Footprint

            26.3.5.4. Strategy Overview

        26.3.6. Keiding, inc.

            26.3.6.1. Overview

            26.3.6.2. Product Portfolio

            26.3.6.3. Sales Footprint

            26.3.6.4. Strategy Overview

        26.3.7. TPM-USA LLC.

            26.3.7.1. Overview

            26.3.7.2. Product Portfolio

            26.3.7.3. Sales Footprint

            26.3.7.4. Strategy Overview

        26.3.8. Qisheng Thermoforming Machinery Co., Ltd

            26.3.8.1. Overview

            26.3.8.2. Product Portfolio

            26.3.8.3. Sales Footprint

            26.3.8.4. Strategy Overview

27. Assumptions and Acronyms Used

28. Research Methodology

List of Tables

Table 01: Global Market Value (US$ Million) Analysis, By Tool Type, 2018H to 2033F

Table 02: Global Market Volume (Tonnes) Analysis, By Tool Type, 2018H to 2033F

Table 03: Global Market Value (US$ Million) Analysis, by Application, 2018H to 2033F

Table 04: Global Market Volume (Tonnes) Analysis, by Application, 2018H to 2033F

Table 05: Global Market Value (US$ Million) Analysis, by End Use, 2018H to 2033F

Table 06: Global Market Volume (Tonnes) Analysis, by End Use, 2018H to 2033F

Table 07: Global Market Value (US$ Million) Analysis, by Country, 2018H to 2033F

Table 08: Global Market Volume (Tonnes) Analysis, by Country, 2018H to 2033F

Table 09: North America Market Value (US$ Million) Analysis, By Tool Type, 2018H to 2033F

Table 10: North America Market Volume (Tonnes) Analysis, By Tool Type, 2018H to 2033F

Table 11: North America Market Value (US$ Million) Analysis, by Application, 2018H to 2033F

Table 12: North America Market Volume (Tonnes) Analysis, by Application, 2018H to 2033F

Table 13: North America Market Value (US$ Million) Analysis, by End Use, 2018H to 2033F

Table 14: North America Market Volume (Tonnes) Analysis, by End Use, 2018H to 2033F

Table 15: North America Market Value (US$ Million) Analysis, by Country, 2018H to 2033F

Table 16: North America Market Volume (Tonnes) Analysis, by Country, 2018H to 2033F

Table 17: Latin America Market Value (US$ Million) Analysis, By Tool Type, 2018H to 2033F

Table 18: Latin America Market \Volume (Tonnes) Analysis, By Tool Type, 2018H to 2033F

Table 19: Latin America Market Value (US$ Million) Analysis, by Application, 2018H to 2033F

Table 20: Latin America Market Volume (Tonnes) Analysis, by Application, 2018H to 2033F

Table 21: Latin America Market Value (US$ Million) Analysis, by End Use, 2018H to 2033F

Table 22: Latin America Market Volume (Tonnes) Analysis, by End Use, 2018H to 2033F

Table 23: Latin America Market Value (US$ Million) Analysis, by Country, 2018H to 2033F

Table 24: Latin America Market Volume (Tonnes) Analysis, by Country, 2018H to 2033F

Table 25: East Asia Market Value (US$ Million) Analysis, By Tool Type, 2018H to 2033F

Table 26: East Asia Market Volume (Tonnes) Analysis, By Tool Type, 2018H to 2033F

Table 27: East Asia Market Value (US$ Million) Analysis, by Application, 2018H to 2033F

Table 28: East Asia Market Volume (Tonnes) Analysis, by Application, 2018H to 2033F

Table 29: East Asia Market Value (US$ Million) Analysis, by End Use, 2018H to 2033F

Table 30: East Asia Market Volume (Tonnes) Analysis, by End Use, 2018H to 2033F

Table 31: East Asia Market Value (US$ Million) Analysis, by Country, 2018H to 2033F

Table 32: East Asia Market Volume (Tonnes) Analysis, by Country, 2018H to 2033F

Table 33: South Asia & Pacific Market Value (US$ Million) Analysis, By Tool Type, 2018H to 2033F

Table 34: South Asia & Pacific Market Volume (Tonnes) Analysis, By Tool Type, 2018H to 2033F

Table 35: South Asia & Pacific Market Value (US$ Million) Analysis, by Application, 2018H to 2033F

Table 36: South Asia & Pacific Market Volume (Tonnes) Analysis, by Application, 2018H to 2033F

Table 37: South Asia & Pacific Market Value (US$ Million) Analysis, by End Use, 2018H to 2033F

Table 38: South Asia & Pacific Market Volume (Tonnes) Analysis, by End Use, 2018H to 2033F

Table 39: South Asia & Pacific Market Value (US$ Million) Analysis, by Country, 2018H to 2033F

Table 40: South Asia & Pacific Market Volume (Tonnes) Analysis, by Country, 2018H to 2033F

Table 41: Western Europe Market Value (US$ Million) Analysis, By Tool Type, 2018H to 2033F

Table 42: Western Europe Market Volume (Tonnes) Analysis, By Tool Type, 2018H to 2033F

Table 43: Western Europe Market Value (US$ Million) Analysis, by Application, 2018H to 2033F

Table 44: Western Europe Market Volume (Tonnes) Analysis, by Application, 2018H to 2033F

Table 45: Western Europe Market Value (US$ Million) Analysis, by End Use, 2018H to 2033F

Table 46: Western Europe Market Volume (Tonnes) Analysis, by End Use, 2018H to 2033F

Table 47: Western Europe Market Value (US$ Million) Analysis, by Country, 2018H to 2033F

Table 48: Western Europe Market Volume (Tonnes) Analysis, by Country, 2018H to 2033F

Table 49: Eastern Europe Market Value (US$ Million) Analysis, By Tool Type, 2018H to 2033F

Table 50: Eastern Europe Market Volume (Tonnes) Analysis, By Tool Type, 2018H to 2033F

Table 51: Eastern Europe Market Value (US$ Million) Analysis, by Application, 2018H to 2033F

Table 52: Eastern Europe Market Volume (Tonnes) Analysis, by Application, 2018H to 2033F

Table 53: Eastern Europe Market Value (US$ Million) Analysis, by End Use, 2018H to 2033F

Table 54: Eastern Europe Market Volume (Tonnes) Analysis, by End Use, 2018H to 2033F

Table 55: Eastern Europe Market Value (US$ Million) Analysis, by Country, 2018H to 2033F

Table 56: Eastern Europe Market Volume (Tonnes) Analysis, by Country, 2018H to 2033F

Table 57: Central Asia Market Value (US$ Million) Analysis, By Tool Type, 2018H to 2033F

Table 58: Central Asia Market Volume (Tonnes) Analysis, By Tool Type, 2018H to 2033F

Table 59: Central Asia Market Value (US$ Million) Analysis, by Application, 2018H to 2033F

Table 60: Central Asia Market Volume (Tonnes) Analysis, by Application, 2018H to 2033F

Table 61: Central Asia Market Value (US$ Million) Analysis, by End Use, 2018H to 2033F

Table 62: Central Asia Market Volume (Tonnes) Analysis, by End Use, 2018H to 2033F

Table 63: Central Asia Market Value (US$ Million) Analysis, by Country, 2018H to 2033F

Table 64: Central Asia Market Volume (Tonnes) Analysis, by Country, 2018H to 2033F

Table 65: Russia & Belarus Market Value (US$ Million) Analysis, By Tool Type, 2018H to 2033F

Table 66: Russia & Belarus Market Volume (Tonnes) Analysis, By Tool Type, 2018H to 2033F

Table 67: Russia & Belarus Market Value (US$ Million) Analysis, by Application, 2018H to 2033F

Table 68: Russia & Belarus Market Volume (Tonnes) Analysis, by Application, 2018H to 2033F

Table 69: Russia & Belarus Market Value (US$ Million) Analysis, by End Use, 2018H to 2033F

Table 70: Russia & Belarus Market Volume (Tonnes) Analysis, by End Use, 2018H to 2033F

Table 71: Russia & Belarus Market Value (US$ Million) Analysis, by Country, 2018H to 2033F

Table 72: Russia & Belarus Market Volume (Tonnes) Analysis, by Country, 2018H to 2033F

Table 73: Balkan Countries Market Value (US$ Million) Analysis, By Tool Type, 2018H to 2033F

Table 74: Balkan Countries Market Volume (Tonnes) Analysis, By Tool Type, 2018H to 2033F

Table 75: Balkan Countries Market Value (US$ Million) Analysis, by Application, 2018H to 2033F

Table 76: Balkan Countries Market Volume (Tonnes) Analysis, by Application, 2018H to 2033F

Table 77: Balkan Countries Market Value (US$ Million) Analysis, by End Use, 2018H to 2033F

Table 78: Balkan Countries Market Volume (Tonnes) Analysis, by End Use, 2018H to 2033F

Table 79: Balkan Countries Market Value (US$ Million) Analysis, by Country, 2018H to 2033F

Table 80: Balkan Countries Market Volume (Tonnes) Analysis, by Country, 2018H to 2033F

Table 81: Baltic Countries Market Value (US$ Million) Analysis, By Tool Type, 2018H to 2033F

Table 82: Baltic Countries Market Volume (Tonnes) Analysis, By Tool Type, 2018H to 2033F

Table 83: Baltic Countries Market Value (US$ Million) Analysis, by Application, 2018H to 2033F

Table 84: Baltic Countries Market Volume (Tonnes) Analysis, by Application, 2018H to 2033F

Table 85: Baltic Countries Market Value (US$ Million) Analysis, by End Use, 2018H to 2033F

Table 86: Baltic Countries Market Volume (Tonnes) Analysis, by End Use, 2018H to 2033F

Table 87: Baltic Countries Market Value (US$ Million) Analysis, by Country, 2018H to 2033F

Table 88: Baltic Countries Market Volume (Tonnes) Analysis, by Country, 2018H to 2033F

Table 89: MEA Market Value (US$ Million) Analysis, By Tool Type, 2018H to 2033F

Table 90: MEA Market Volume (Tonnes) Analysis, By Tool Type, 2018H to 2033F

Table 91: MEA Market Value (US$ Million) Analysis, by Application, 2018H to 2033F

Table 92: MEA Market Volume (Tonnes) Analysis, by Application, 2018H to 2033F

Table 93: MEA Market Value (US$ Million) Analysis, by End Use, 2018H to 2033F

Table 94: MEA Market Volume (Tonnes) Analysis, by End Use, 2018H to 2033F

Table 95: MEA Market Value (US$ Million) Analysis, by Country, 2018H to 2033F

Table 96: MEA Market Volume (Tonnes) Analysis, by Country, 2018H to 2033F

List of Charts

Figure 01: Global Market Share Analysis By Tool Type, 2023E & 2033F

Figure 02: Global Market Y-o-Y Analysis By Tool Type, 2018H to 2033F

Figure 03: Global Market Attractiveness Analysis By Tool Type, 2023E to 2033F

Figure 04: Global Market Share Analysis by Application,2023E & 2033F

Figure 05: Global Market Y-o-Y Analysis by Application, 2018H to 2033F

Figure 06: Global Market Attractiveness Analysis by Application, 2023E to 2033F

Figure 07: Global Market Share Analysis by End Use, 2023E & 2033F

Figure 08: Global Market Y-o-Y Analysis by End Use, 2018H to 2033F

Figure 09: Global Market Attractiveness Analysis by End Use, 2023E to 2033F

Figure 10: Global Market Share Analysis by Region 2023E & 2033F

Figure 11: Global Market Y-o-Y Analysis by Region, 2018H to 2033F

Figure 12: Global Market Attractiveness Analysis by Region, 2023E to 2033F

Figure 13: North America Market Attractiveness Analysis by Application,2023E to 2033F

Figure 14: North America Market Y-o-Y Analysis By Tool Type, 2018H to 2033F

Figure 15: North America Market Value Share Analysis by End Use 2023(E)

Figure 16: North America Market Share Analysis by Country, 2023E & 2033F

Figure 17: Latin America Market Attractiveness Analysis by Application, 2023E to 2033F

Figure 18: Latin America Market Y-o-Y Analysis By Tool Type, 2018H to 2033F

Figure 19: Latin America Market Value Share Analysis by End Use 2023(E)

Figure 20: Latin America Market Share Analysis by Country, 2023E & 2033F

Figure 21: East Asia Market Attractiveness Analysis by Application, 2023E to 2033F

Figure 22: East Asia Market Y-o-Y Analysis By Tool Type, 2018H to 2033F

Figure 23: East Asia Market Value Share Analysis by End Use 2023(E)

Figure 24: East Asia Market Share Analysis by Country, 2023E & 2033F

Figure 25: South Asia & Pacific Market Attractiveness Analysis by Insulation Material , 2023E to 2033F

Figure 26: South Asia & Pacific Market Y-o-Y Analysis By Tool Type, 2018H to 2033F

Figure 27: South Asia & Pacific Market Value Share Analysis by End Use 2023(E)

Figure 28: South Asia & Pacific Market Share Analysis by Country, 2023E & 2033F

Figure 29: Western Europe Market Attractiveness Analysis by Application, 2023E to 2033F

Figure 30: Western Europe Market Y-o-Y Analysis By Tool Type, 2018H to 2033F

Figure 31: Western Europe Market Value Share Analysis by End Use 2023(E)

Figure 32: Western Europe Market Share Analysis by Country, 2023E & 2033F

Figure 33: Eastern Europe Market Attractiveness Analysis by Application,2023E to 2033F

Figure 34: Eastern Europe Market Y-o-Y Analysis By Tool Type,2018H to 2033F

Figure 35: Eastern Europe Market Value Share Analysis by End Use 2023(E)

Figure 36: Eastern Europe Market Share Analysis by Country, 2023E & 2033F

Figure 37: Central Asia Market Attractiveness Analysis by Application, 2023E to 2033F

Figure 38: Central Asia Market Y-o-Y Analysis By Tool Type, 2018H to 2033F

Figure 39: Central Asia Market Value Share Analysis by End Use 2023(E)

Figure 40: Central Asia Market Share Analysis by Country, 2023E & 2033F

Figure 41: Russia & Belarus Market Attractiveness Analysis by Application,2023E to 2033F

Figure 42: Russia & Belarus Market Y-o-Y Analysis By Packaging Format, 2018H to 2033F

Figure 43: Russia & Belarus Market Value Share Analysis by End Use 2023(E)

Figure 44: Russia & Belarus Market Share Analysis by Country, 2023E & 2033F

Figure 45: Balkan Countries Market Attractiveness Analysis by Application,2023E to 2033F

Figure 46: Balkan Countries Market Y-o-Y Analysis By Packaging Format,2018H to 2033F

Figure 47: Balkan Countries Market Value Share Analysis by End Use 2023(E)

Figure 48: Balkan Countries Market Share Analysis by Country, 2023E & 2033F

Figure 49: Baltic Countries Market Attractiveness Analysis by Application,2023E to 2033F

Figure 50: Baltic Countries Market Y-o-Y Analysis By Packaging Format,2018H to 2033F

Figure 51: Baltic Countries Market Value Share Analysis by End Use 2023(E)

Figure 52: Baltic Countries Market Share Analysis by Country, 2023E & 2033F

Figure 53: MEA Market Attractiveness Analysis by Application,2023E to 2033F

Figure 54: MEA Market Y-o-Y Analysis By Tool Type, 2018H to 2033F

Figure 55: MEA Market Value Share Analysis by End Use 2023(E)

Figure 56: MEA Market Share Analysis by Country, 2023E & 2033F

Figure 57: U.S. Market Value Share Analysis, by Application,2023E & 2033F

Figure 58: U.S. Market Value Share Analysis, By Tool Type,2023E & 2033F

Figure 59: U.S. Market Value Share Analysis, by End Use, 2023E & 2033F

Figure 60: Canada Market Value Share Analysis, by Application,2023E & 2033F

Figure 61: Canada Market Value Share Analysis, By Tool Type,2023E & 2033F

Figure 62: Canada Market Value Share Analysis, by End Use, 2023E & 2033F

Figure 63: Brazil Market Value Share Analysis, by Application, 2023E & 2033F

Figure 64: Brazil Market Value Share Analysis, By Tool Type,2023E & 2033F

Figure 65: Brazil Market Value Share Analysis, by End Use,2023E & 2033F

Figure 66: Mexico Market Value Share Analysis, by Application,2023E & 2033F

Figure 67: Mexico Market Value Share Analysis, By Tool Type, 2023E & 2033F

Figure 68: Mexico Market Value Share Analysis, by End Use,2023E & 2033F

Figure 69: Germany Market Value Share Analysis, by Application,2023E & 2033F

Figure 70: Germany Market Value Share Analysis, By Tool Type, 2023E & 2033F

Figure 71: Germany Market Value Share Analysis, by End Use,2023E & 2033F

Figure 72: Italy Market Value Share Analysis, by Application, 2023E & 2033F

Figure 73: Italy Market Value Share Analysis, By Tool Type, 2023E & 2033F

Figure 74: Italy Market Value Share Analysis, by End Use, 2023E & 2033F

Figure 75: France Market Value Share Analysis, by Application,2023E & 2033F

Figure 76: France Market Value Share Analysis, By Tool Type,2023E & 2033F

Figure 77: France Market Value Share Analysis, by End Use, 2023E & 2033F

Figure 78: United Kingdom Market Value Share Analysis, by Application,2023E & 2033F

Figure 79: United Kingdom Market Value Share Analysis, By Packaging Format,2023E & 2033F

Figure 80: United Kingdom Market Value Share Analysis, by End Use, 2023E & 2033F

Figure 81: Spain Market Value Share Analysis, by Application, 2023E & 2033F

Figure 82: Spain Market Value Share Analysis, By Packaging Format,2023E & 2033F

Figure 83: Spain Market Value Share Analysis, by End Use, 2023E & 2033F

Figure 84: Russia Market Value Share Analysis, by Application, 2023E & 2033F

Figure 85: Russia Market Value Share Analysis, By Packaging Format,2023E & 2033F

Figure 86: Russia Market Value Share Analysis, by End Use, 2023E & 2033F

Figure 87: GCC Market Value Share Analysis, by Application, 2023E & 2033F

Figure 88: GCC Market Value Share Analysis, By Packaging Format, 2023E & 2033F

Figure 89: GCC Market Value Share Analysis, by End Use,2023E & 2033F

Figure 90: South Africa Market Value Share Analysis, by Application,2023E & 2033F

Figure 91: South Africa Market Value Share Analysis, By Packaging Format, 2023E & 2033F

Figure 92: South Africa Market Value Share Analysis, by End Use, 2023E & 2033F

Figure 93: Japan Market Value Share Analysis, by Application, 2023E & 2033F

Figure 94: Japan Market Value Share Analysis, By Packaging Format, 2023E & 2033F

Figure 95: Japan Market Value Share Analysis, by End Use, 2023E & 2033F

Figure 96: India Market Value Share Analysis, by Application, 2023E & 2033F

Figure 97: India Market Value Share Analysis, By Tool Type, 2023E & 2033F

Figure 98: India Market Value Share Analysis, by End Use, 2023E & 2033F

Figure 98: China Market Value Share Analysis, by Application,2023E & 2033F

Figure 99: China Market Value Share Analysis, By Tool Type, 2023E & 2033F

Figure 100: China Market Value Share Analysis, by End Use,2023E & 2033F

Figure 101: Australia Market Value Share Analysis, by Application, 2023E & 2033F

Figure 102: Australia Market Value Share Analysis, By Tool Type, 2023E & 2033F

Figure 103: Australia Market Value Share Analysis, by End Use, 2023E & 2033F

Explore Packaging Insights

View Reports

Pulp Molding Tooling Market