Molding Starch Market Size and Share Forecast Outlook 2025 to 2035

The molding starch market is estimated to be valued at USD 543.5 million in 2025 and is projected to reach USD 885.3 million by 2035, registering a CAGR of 5.0% over the forecast period. The market is projected to add an absolute dollar opportunity of USD 341.8 million over the forecast period.The market's evolution is expected to be shaped by rising demand for biodegradable molding solutions, sustainable confectionery production processes, and clean-label ingredients, particularly where environmental sustainability and food safety are paramount.

By 2030, the market is likely to reach USD 693.5 million, accounting for USD 150.0 million in incremental value over the first half of the period. The remaining USD 191.8 million is expected during the second half, suggesting a moderately accelerated growth pattern. Product innovation around modified starches and enhanced functional properties is gaining traction because molding starch offers favorable moisture absorption, mold release, and biodegradability improvement.

Companies such as Cargill Incorporated and Archer Daniels Midland (ADM) are advancing their competitive positions through investment in starch modification technologies and scalable production systems. Innovation-led procurement models are supporting expansion into confectionery manufacturing, food processing applications, and sustainable packaging solutions. Market performance will remain anchored in food safety compliance, quality standards, and sustainable sourcing benchmarks.
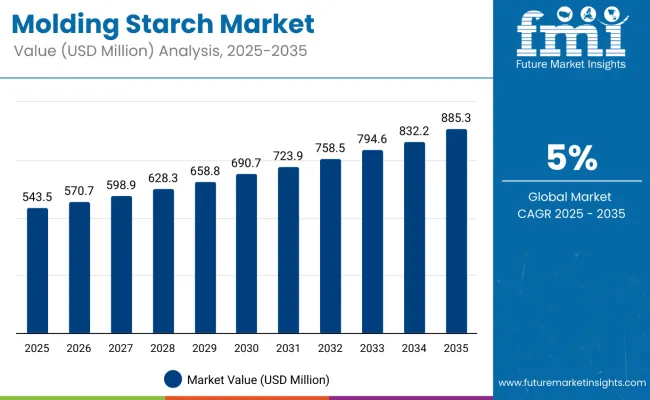
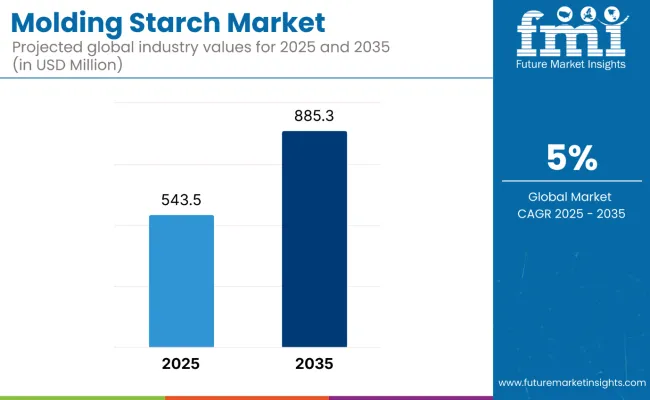
Molding Starch Market

Quick Stats for Molding Starch Market

  • Molding Starch Market Value (2025): USD 543.5 million
  • Molding Starch Market Forecast Value (2035): USD 885.3 million
  • Molding Starch Market Forecast CAGR: 5.0%
  • Leading Segment in Molding Starch Market in 2025: Rapidly Digestible Starch (45.0%)
  • Key Growth Regions in Molding Starch Market: Asia Pacific and Saudi Arabia
  • Top Key Players in Molding Starch Market: Archer Daniels Midland (ADM), Cargill Incorporated, Ingredion Incorporated, Tate & Lyle PLC

Molding Starch Market Value

Metric Value
Estimated Value in (2025E) USD 543.5 million
Forecast Value in (2035F) USD 885.3 million
Forecast CAGR (2025 to 2035) 5.0%

The market holds 18% of the confectionery starch applications market, driven by its essential role in candy manufacturing, mold release properties, and moisture control capabilities. It accounts for around 45% of the molding processing agents market, supported by its function in facilitating efficient molding processes and biodegradable manufacturing solutions. The market contributes nearly 23% to the mold release agents market, particularly for confectionery molding, food-grade applications, and sustainable production processes. It holds close to 2.4% of the broader food starch market, where molding starch serves specialized texture enhancement and processing aid functions. The share in the confectionery ingredients market reaches about 40% through the candies segment, reflecting its preference among manufacturers seeking natural molding solutions for shape formation and quality enhancement applications.

The market is undergoing structural change driven by rising demand for natural and sustainable ingredients across confectionery, food processing, and packaging sectors. Advanced processing methods using modified starch technologies and enzymatic treatments have enhanced functional properties, biodegradability, and processing efficiency, making molding starch a viable alternative to synthetic molding agents and chemical release compounds. Manufacturers are introducing standardized grades and specialized formulations tailored for confectionery production, food processing applications, and sustainable packaging use, expanding their role beyond traditional industrial molding applications.

Why is the Molding Starch Market Growing?

Molding starch's proven biodegradability, moisture absorption properties, and mold release capabilities make it an attractive alternative to synthetic molding agents in confectionery, food processing, and sustainable packaging applications. The natural origin and food-safe characteristics of molding starch align with increasing regulatory requirements and consumer preferences for environmentally friendly production methods.

Growing awareness of sustainable manufacturing practices is further propelling adoption, especially in confectionery production systems and eco-friendly packaging solutions. Consumer demand for clean-label products and sustainable manufacturing, along with innovations in starch modification and processing technology, are also enhancing product functionality and application versatility. Advanced enzymatic treatments and modified starch formulations have improved heat stability, moisture control, and processing efficiency, expanding use cases beyond traditional applications.

As the global food processing and confectionery industries continue to prioritize natural ingredients and sustainable production systems, the market outlook remains favorable. With manufacturers and consumers prioritizing environmental sustainability, food safety, and natural origin, molding starch is well-positioned to expand across various confectionery manufacturing, food processing, and sustainable packaging applications.

Molding Starch Market Analysis by top Investment Segments

The market is segmented by type, application, and region. By type, the market is divided intorapidly digestible starch, slowly digestible starch, and resistant starch. Based on application, the market is categorized into candies, jellies, gummies, marshmallows, and others (puddings, desserts, and bakery fillings). Regionally, the market is classified into North America, Latin America, Europe, Asia Pacific, and the Middle East & Africa.
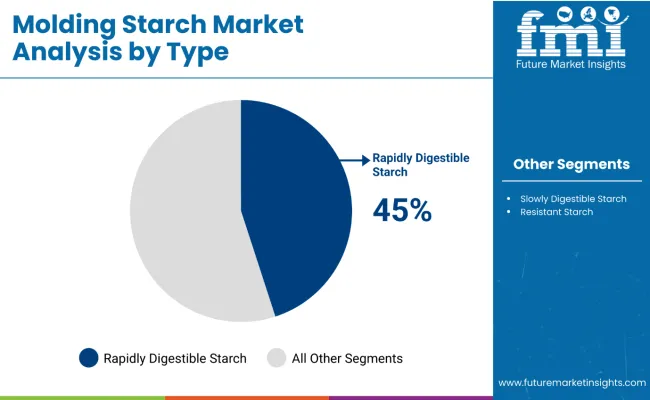
By Type, Rapidly Digestible Starch Accounts for 45% of the Market Share in 2025

Molding Starch Market By Type

The rapidly digestible starch (RDS) segment stands out as the most lucrative portion of the molding starch market, capturing 45% of total revenues in 2025. This dominance is underpinned by RDS’s unique ability to undergo swift enzymatic hydrolysis, delivering precise moisture control and rapid texturizationcritical attributes for high-speed confectionery molding operations. Manufacturers in North America and Europe, which together account for over 60% of global confectionery output, favor RDS for its consistent performance in automated molding lines, where cycle times and dimensional accuracy directly impact throughput and product quality.

Technological advancements in RDS production, such as ultra-fine milling and controlled amylopectinamylose ratioshave further enhanced its thermal stability and mold-release properties, reducing production downtime and waste. Additionally, the clean-label trend has bolstered RDS’s appeal, as it naturally aligns with consumer demand for minimally processed ingredients. With its operational efficiencies, sustainability credentials, and alignment with premium brand requirements, RDS is projected to maintain robust growth through 2035.
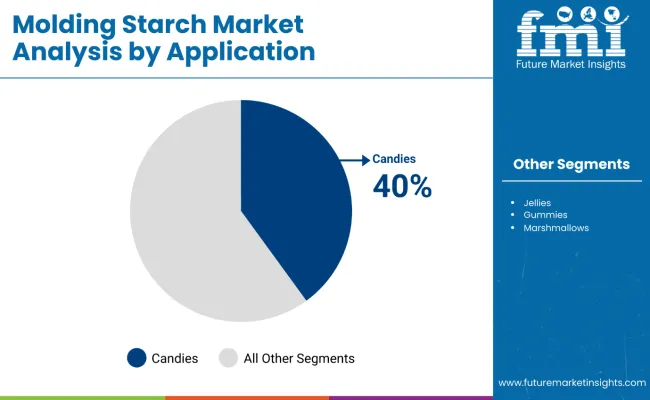
By Application, Candies Account for 40% of the Market Share in 2025

Molding Starch Market By Application

The candies segment emerges as the most lucrative application in the molding starch market, commanding 40% of total share in 2025. This leadership is attributable to candies’ stringent requirements for intricate shapes, high-definition surface finishes, and consistent moisture profilescriteria that molding starch uniquely fulfills through its superior mold-release properties and moisture-wicking capabilities. Modern candy manufacturers, particularly in North America and Europe, have shifted toward automated molding lines where rapid demolding and minimal product adhesion are critical for maintaining throughput and reducing cycle times.

Advances in starch formulation, such as modified amylopectin content and tailored particle size distributions, have further elevated performance, enabling ultra-thin candy coatings and intricate confectionery pieces without compromising texture or shelf stability. Additionally, rising consumer demand for premium and novelty candiesdriven by social media trends and seasonal product launcheshas intensified the need for reliable molding agents that can deliver complex geometries at scale. With global candy sales projected to exceed USD 275 billion by 2030, continued innovation in molding starch is poised to sustain the segment’s robust growth and market dominance.

Drivers, Restraints, and Key Trends of the Molding Starch Market

In 2024, global molding starch consumption increased by 14% year-on-year, with Europe holding a 42% share due to its established confectionery base. Applications include jelly candy molding, gummy casting, and nutraceutical gummies, where starch is used as a dusting and molding medium. Manufacturers are offering modified starch blends that deliver improved moisture control, faster demolding, and consistent surface texture. Growing demand for natural, plant-based excipients supports starch adoption, especially in clean-label confectionery and fortified gummy formulations. With consumer preference for non-synthetic ingredients, molding starch is being increasingly positioned as a versatile, functional processing aid across premium confectionery and pharmaceutical formats.

Health-Conscious and Functional Confectionery Trends Drive Molding Starch Adoption

Confectionery and nutraceutical producers are selecting molding starch to enhance production efficiency, achieve smooth product finishes, and maintain integrity during demolding cycles. Modified starch blends provide consistent moisture absorption, reducing drying times by up to 20% compared to traditional starch bases. In fortified gummies, starch ensures uniform shape retention and prevents stickiness, making it an ideal medium for functional formats with vitamins, minerals, or botanicals.

Adoption in the nutraceutical sector rose 28% in 2024, with starch-based molding enabling large-scale production of functional gummies and jellies. Natural corn and potato starches are increasingly chosen for clean-label positioning, supporting industry transition away from synthetic molding agents. This operational and marketing advantage explains the 35% adoption growth of molding starch in European and North American nutraceutical production facilities last year.

Supply Chain Volatility, Specialized Handling, and Processing Constraints Restrict Expansion

Challenges remain due to fluctuations in raw starch pricing, specialized equipment requirements, and contamination risks. Starch procurement costs vary between USD 450 and USD 620 per metric ton depending on crop yields and export conditions, impacting molding starch pricing and increasing volatility in supply contracts. Processing requires dedicated molding rooms with starch conditioning systems, adding 5 to 7 weeks to facility set-up cycles.

Frequent starch recycling in molding operations adds complexity, requiring dust management, sifting, and microbial control measures, which increase operational costs by 18-22% compared to gelatin or alternative molding media. Limited global suppliers capable of providing high-performance molding starch blends restrict availability, slowing scalability for confectionery players in emerging markets. These cost and infrastructure challenges temper adoption rates despite rising interest in starch as a natural processing excipient.
Analysis of Molding Starch Market by Country

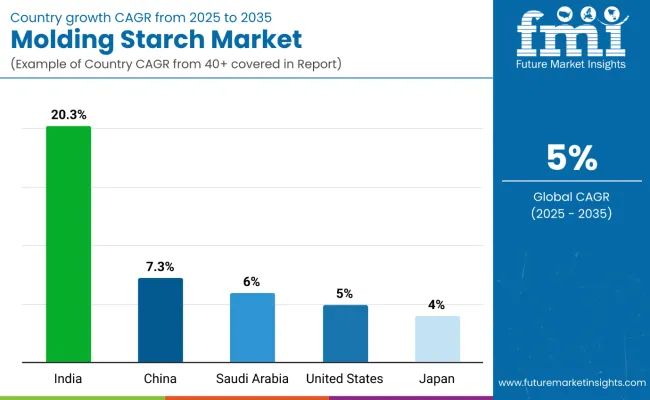
Country Wise Analysis Molding Starch Market

Country CAGR (2025 to 2035)
India 20.3%
China 7.3%
Saudi Arabia 6.0%
United States 5.0%
Japan 4.0%

The market exhibits pronounced regional growth disparities, led by India’s exceptional 20.3% CAGR driven by rapid urbanization, surging confectionery consumption, and substantial government support for food-processing infrastructure. China follows at 7.3%, capitalizing on its massive confectionery production base, modernization of starch facilities, and strategic development of agro-processing clusters. Saudi Arabia records a 6.0% CAGR, underpinned by economic diversification initiatives, expansion of integrated starch modification plants, and incentives for sustainable food manufacturing.

The United States’ mature market grows at 5.0%, sustained by technological upgrades in enzymatic modification, clean-label regulations, and the co-production of starch derivatives in biorefinery models. Japan demonstrates the most modest increase at 4.0%, reflecting its established confectionery culture, emphasis on ultra-pure starch grades, and precision-driven production processes.

The report covers an in-depth analysis of 40+ countries; five top-performing OECD countries are highlighted below.

Production Capacity Trends in Molding Starch Market in India

Revenue from molding starch in India is growing rapidly, reflecting a 20.3% CAGR supported by capacity build-outs to satisfy surging demand from its flourishing confectionery sector and rising processed-food consumption. Installed production volumes are projected to increase from 250 kilotons in 2025 to 410 kilotons by 2035. This expansion is underpinned by significant investments in greenfield starch modification plants and modernization of existing facilities.

Government subsidies for food-processing infrastructure and strategic public-private partnerships have accelerated construction of ultra-fine milling lines and moisture-control units. Leading starch producers are establishing localized supply chains to minimize feedstock transit times and ensure consistent quality.

  • Growing urban confectionery consumption and premium candy launches
  • Expansion of domestic starch modification facilities
  • Increasing adoption of automated molding lines

Output Expansion in Molding Starch Market in China

Demand for molding starch in China is projected with a 7.3% CAGR, driven by the country’s status as the world’s largest confectionery producer. Food-grade starch facilities are undergoing rapid modernization with investments in high-efficiency dryers, extrusion systems, and enzymatic modification units. Provincial governments are incentivizing the development of agro-processing clusters, integrating corn wet-milling with starch refining operations.

Domestic and multinational suppliers are collaborating with leading OEMs to co-develop specialized starch grades tailored for automated molding lines. Controlled particle-size distributions and advanced purification techniques enhance product consistency for intricate candy shapes. Expansion of cold-chain logistics and port infrastructure supports both domestic consumption and export capabilities. Growing consumer interest in premium and artisanal candy varieties sustains demand for high-performance molding starch solutions, reinforcing China’s pivotal role in global supply.

  • Growth in premium and artisanal candy segments
  • Expansion of domestic starch processing capacities
  • Collaborations between starch suppliers and food OEMs

Structural Adoption in Molding Starch Market in Saudi Arabia

Sales of molding starch in Saudi Arabia are undergoing structural transformation, projected to grow at a 6.0% CAGR between 2025 and 2035. Economic diversification initiatives have prompted the establishment of integrated starch modification and drying facilities in key industrial zones. Investments by both local conglomerates and international players focus on advanced starch processing technologies, including ultra-fine milling and moisture-controlled blending systems. Rapidly digestible starch dominates the portfolio, capturing 45.0% of capacity, while Candy applications drive plant design specifications. Government incentives for food-processing investments and sustainable manufacturing practices have accelerated plant commissioning.
  • Government incentives for food sector development
  • Expansion of confectionery manufacturing hubs
  • Rising per capita candy consumption

Growth Dynamics in Molding Starch Market in the United States

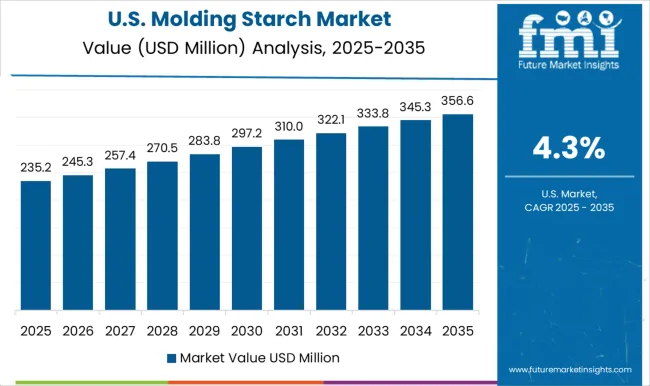
Revenue from molding starch in USA is projected to expand and reflecting a 5.0% CAGR. Investment priorities include upgrading corn-based starch plants with state-of-the-art enzymatic modification units and ultra-fine grinding mills to produce high-performance grades such as rapidly digestible starch (45.0% share). Leading manufacturers are integrating biorefinery concepts to co-produce starch derivatives and biofuels, optimizing resource utilization and sustainability.

Clean-label regulations and consumer preference for non-GMO and organic ingredients drive the development of specialized molding starch formulations. Automated molding lines in confectionery plants benefit from improved mold-release and moisture-control properties, reducing cycle times and waste. Strategic R&D collaborations with major candy OEMs tailor products to seasonal and functional candy trends.
  • High adoption of automated molding systems
  • Strict regulatory compliance driving quality enhancements
  • Growth in premium and functional candies

Adoption Patterns in Molding Starch Market in Japan

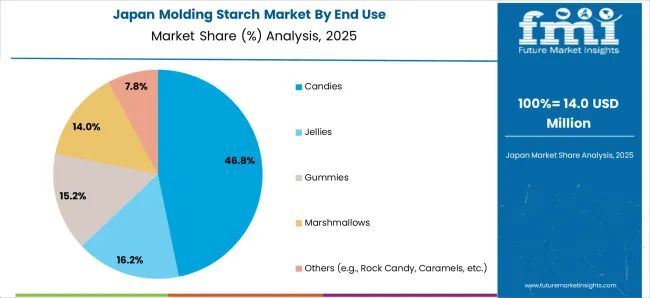
Revenue from molding starch in Japan is expected to grow at a 4.0% CAGR, driven by the country’s established confectionery culture and consistent demand for premium textures. Production facilities focus on ultra-purification, membrane filtration, and precise particle-size control to meet exacting quality standards. Rapidly Digestible Starch leads with 45.0% of capacity, serving the high-definition candy and confectionery segments that require intricate shapes and smooth surfaces.

Collaboration between starch suppliers and leading confectionery brands on co-development of customized grades enhances market responsiveness. Government support for sustainable food processing and R&D funding for enzyme-assisted starch modification further fuel capacity additions. Seasonal confectionery launches and functional food innovations drive steady demand for molding starch.
  • Focus on intricate candy designs and textures
  • Investments in ultra-pure starch grades
  • Strong seasonal confectionery traditions

Competitive Landscape of Molding Starch Market

Molding Starch Market By Company

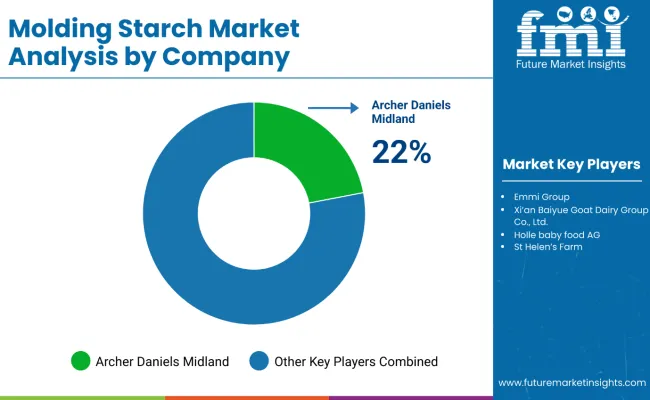
The market is moderately consolidated, dominated by a handful of global ingredient suppliers with advanced starch modification and production capabilities. Archer Daniels Midland (ADM) and Cargill Incorporated lead the market for high-performance starch grades, supplying Rapidly Digestible Starch with superior moisture-control and mold-release properties for high-speed confectionery molding. Their strength lies in proprietary enzyme-assisted modification processes and large-scale wet-milling facilities that ensure consistent grade quality and regulatory compliance.

Ingredion Incorporated differentiates through its portfolio of customized starch blends and clean-label formulations, offering specialized particle-size distributions and tailored amylopectin: amylose ratios for niche confectionery and bakery applications. Tate & Lyle PLC focuses on sustainable sourcing and energy-efficient drying technologies, targeting premium candy and food packaging applications with low-residue, biodegradable starch grades.

Regional players such as Roquette SA and Grain Processing Corporation emphasize localized production and supply-chain agility, ensuring minimal feedstock transit times and rapid technical support for domestic confectionery manufacturers. Meanwhile, specialty starch producers are investing in continuous-flow processing and membrane-filtration systems to enhance thermal stability and reduce production waste.

Entry barriers remain high, driven by capital-intensive plant investments, strict food-safety regulations, and the need for deep technical expertise in starch chemistry. Competitive advantage increasingly depends on scale of modification capacity, proprietary enzyme technologies, and the ability to deliver clean-label, biodegradable molding solutions at consistent quality and global logistics standards.

Key Developments in the Molding Starch Market

In April 2024, Roquette unveiled a flexible addition to its LYCAGEL® hydroxypropyl pea starch range at Vitafoods Europe, highlighting innovations for vegetarian and vegan softgel supplements. In collaboration with Qualicaps, the company showcased its expanded portfolio, offering insights on efficiency, quality, sustainability, and tailored support for nutraceutical formulation challenges.

Report Scope - Molding Starch Market

Items Values
Quantitative Units (2025) USD 543.5 Million
Type Rapidly Digestible Starch, Slowly Digestible Starch, Resistant Starch
Application Candies, Jellies, Gummies, Marshmallows, and Others (puddings, desserts, and bakery fillings)
Regions Covered North America, Europe, Asia-Pacific, Latin America, Middle East & Africa
Countries Covered United States, Canada, Germany, France, United Kingdom, China, Japan, India, Brazil, South Africa, Australia and 40+ countries
Key Companies Profiled Archer Daniels Midland (ADM), Cargill Incorporated, Ingredion Incorporated, Tate & Lyle PLC, Roquette SA
Additional Attributes Dollar sales by type and application sector; growing usage in high-speed confectionery molding ; stable demand in eco-friendly packaging; innovations in enzyme-assisted starch modification and ultra-fine milling enhance functionality, purity, and regulatory compliance

Key Segmentation

By End Use:

  • Candies
  • Jellies
  • Gummies
  • Marshmallows
  • Others (e.g., Rock Candy, Caramels, etc.)

By Region:

  • North America
  • Latin America
  • Western Europe
  • Eastern Europe
  • Asia Pacific excluding Japan
  • Japan
  • Middle East & Africa

Table of Content

  1. Executive Summary
    • Global Market Outlook
    • Demand-side Trends
    • Supply-side Trends
    • Technology Roadmap Analysis
    • Analysis and Recommendations
  2. Market Overview
    • Market Coverage / Taxonomy
    • Market Definition / Scope / Limitations
  3. Market Background
    • Market Dynamics
      • Drivers
      • Restraints
      • Opportunity
      • Trends
    • Scenario Forecast
      • Demand in Optimistic Scenario
      • Demand in Likely Scenario
      • Demand in Conservative Scenario
    • Opportunity Map Analysis
    • Product Life Cycle Analysis
    • Supply Chain Analysis
      • Supply Side Participants and their Roles
        • Producers
        • Mid-Level Participants (Traders/ Agents/ Brokers)
        • Wholesalers and Distributors
      • Value Added and Value Created at Node in the Supply Chain
      • List of Raw Material Suppliers
      • List of Existing and Potential Buyer’s
    • Investment Feasibility Matrix
    • Value Chain Analysis
      • Profit Margin Analysis
      • Wholesalers and Distributors
      • Retailers
    • PESTLE and Porter’s Analysis
    • Regulatory Landscape
      • By Key Regions
      • By Key Countries
    • Regional Parent Market Outlook
    • Production and Consumption Statistics
    • Import and Export Statistics
  4. Global Market Analysis 2020 to 2024 and Forecast, 2025 to 2035
    • Historical Market Size Value (USD Million) & Volume (Metric Tons) Analysis, 2020 to 2024
    • Current and Future Market Size Value (USD Million) & Volume (Metric Tons) Projections, 2025 to 2035
      • Y-o-Y Growth Trend Analysis
      • Absolute $ Opportunity Analysis
  5. Global Market Pricing Analysis 2020 to 2024 and Forecast 2025 to 2035
  6. Global Market Analysis 2020 to 2024 and Forecast 2025 to 2035, By Type
    • Introduction / Key Findings
    • Historical Market Size Value (USD Million) & Volume (Metric Tons) Analysis By Type, 2020 to 2024
    • Current and Future Market Size Value (USD Million) & Volume (Metric Tons) Analysis and Forecast By Type, 2025 to 2035
      • Rapidly Digestible Starch
      • Slowly Digestible Starch
      • Resistant Starch
    • Y-o-Y Growth Trend Analysis By Type, 2020 to 2024
    • Absolute $ Opportunity Analysis By Type, 2025 to 2035
  7. Global Market Analysis 2020 to 2024 and Forecast 2025 to 2035, By Application
    • Introduction / Key Findings
    • Historical Market Size Value (USD Million) & Volume (Metric Tons) Analysis By Application, 2020 to 2024
    • Current and Future Market Size Value (USD Million) & Volume (Metric Tons) Analysis and Forecast By Application, 2025 to 2035
      • Candies
      • Jellies
      • Gummies
      • Marshmallows
      • Others (Puddings, Desserts, and Bakery Fillings)
    • Y-o-Y Growth Trend Analysis By Application, 2020 to 2024
    • Absolute $ Opportunity Analysis By Application, 2025 to 2035
  8. Global Market Analysis 2020 to 2024 and Forecast 2025 to 2035, By Region
    • Introduction
    • Historical Market Size Value (USD Million) & Volume (Metric Tons) Analysis By Region, 2020 to 2024
    • Current Market Size Value (USD Million) & Volume (Metric Tons) Analysis and Forecast By Region, 2025 to 2035
      • North America
      • Latin America
      • Western Europe
      • Eastern Europe
      • East Asia
      • South Asia & Pacific
      • Middle East and Africa
    • Market Attractiveness Analysis By Region
  9. North America Market Analysis 2020 to 2024 and Forecast 2025 to 2035, By Country
    • Historical Market Size Value (USD Million) & Volume (Metric Tons) Trend Analysis By Market Taxonomy, 2020 to 2024
    • Market Size Value (USD Million) & Volume (Metric Tons) Forecast By Market Taxonomy, 2025 to 2035
      • By Country
        • USA
        • Canada
        • Mexico
      • By Type
      • By Application
    • Market Attractiveness Analysis
      • By Country
      • By Type
      • By Application
    • Key Takeaways
  10. Latin America Market Analysis 2020 to 2024 and Forecast 2025 to 2035, By Country
    • Historical Market Size Value (USD Million) & Volume (Metric Tons) Trend Analysis By Market Taxonomy, 2020 to 2024
    • Market Size Value (USD Million) & Volume (Metric Tons) Forecast By Market Taxonomy, 2025 to 2035
      • By Country
        • Brazil
        • Argentina
        • Rest of LATAM
      • By Type
      • By Application
    • Market Attractiveness Analysis
      • By Country
      • By Type
      • By Application
    • Key Takeaways
  11. Western Europe Market Analysis 2020 to 2024 and Forecast 2025 to 2035, By Country
    • Historical Market Size Value (USD Million) & Volume (Metric Tons) Trend Analysis By Market Taxonomy, 2020 to 2024
    • Market Size Value (USD Million) & Volume (Metric Tons) Forecast By Market Taxonomy, 2025 to 2035
      • By Country
        • Germany
        • Italy
        • France
        • UK
        • Spain
        • BENELUX
        • Nordic
        • Rest of W.Europe
      • By Type
      • By Application
    • Market Attractiveness Analysis
      • By Country
      • By Type
      • By Application
    • Key Takeaways
  12. Eastern Europe Market Analysis 2020 to 2024 and Forecast 2025 to 2035, By Country
    • Historical Market Size Value (USD Million) & Volume (Metric Tons) Trend Analysis By Market Taxonomy, 2020 to 2024
    • Market Size Value (USD Million) & Volume (Metric Tons) Forecast By Market Taxonomy, 2025 to 2035
      • By Country
        • Russia
        • Hungary
        • Poland
        • Balkan & Baltics
        • Rest of E. Europe
      • By Type
      • By Application
    • Market Attractiveness Analysis
      • By Country
      • By Type
      • By Application
    • Key Takeaways
  13. East Asia Market Analysis 2020 to 2024 and Forecast 2025 to 2035, By Country
    • Historical Market Size Value (USD Million) & Volume (Metric Tons) Trend Analysis By Market Taxonomy, 2020 to 2024
    • Market Size Value (USD Million) & Volume (Metric Tons) Forecast By Market Taxonomy, 2025 to 2035
      • By Country
        • China
        • Japan
        • South Korea
      • By Type
      • By Application
    • Market Attractiveness Analysis
      • By Country
      • By Type
      • By Application
    • Key Takeaways
  14. South Asia & Pacific Market Analysis 2020 to 2024 and Forecast 2025 to 2035, By Country
    • Historical Market Size Value (USD Million) & Volume (Metric Tons) Trend Analysis By Market Taxonomy, 2020 to 2024
    • Market Size Value (USD Million) & Volume (Metric Tons) Forecast By Market Taxonomy, 2025 to 2035
      • By Country
        • India
        • Australia & New Zealand
        • ASEAN
        • Rest of SAP
      • By Type
      • By Application
    • Market Attractiveness Analysis
      • By Country
      • By Type
      • By Application
    • Key Takeaways
  15. Middle East and Africa Market Analysis 2020 to 2024 and Forecast 2025 to 2035, By Country
    • Historical Market Size Value (USD Million) & Volume (Metric Tons) Trend Analysis By Market Taxonomy, 2020 to 2024
    • Market Size Value (USD Million) & Volume (Metric Tons) Forecast By Market Taxonomy, 2025 to 2035
      • By Country
        • GCC Countries
        • Northern Africa
        • South Africa
        • Turkiye
        • Rest of MEA
      • By Type
      • By Application
    • Market Attractiveness Analysis
      • By Country
      • By Type
      • By Application
    • Key Takeaways
  16. Key Countries Market Analysis
    • USA
      • Pricing Analysis
      • Market Share Analysis, 2024
        • By Type
        • By Application
    • Canada
      • Pricing Analysis
      • Market Share Analysis, 2024
        • By Type
        • By Application
    • Brazil
      • Pricing Analysis
      • Market Share Analysis, 2024
        • By Type
        • By Application
    • Mexico
      • Pricing Analysis
      • Market Share Analysis, 2024
        • By Type
        • By Application
    • Argentina
      • Pricing Analysis
      • Market Share Analysis, 2024
        • By Type
        • By Application
  17. Market Structure Analysis
    • Competition Dashboard
    • Competition Benchmarking
    • Market Share Analysis of Top Players
      • By Regional
      • By Type
      • By Application
  18. Competition Analysis
    • Competition Deep Dive
      • Archer Daniels Midland
        • Overview
        • Product Portfolio
        • Profitability by Market Segments (Product/Age /Sales Channel/Region)
        • Sales Footprint
        • Strategy Overview
          • Marketing Strategy
          • Product Strategy
          • Channel Strategy
      • Tate & Lyle PLC
        • Overview
        • Product Portfolio
        • Profitability by Market Segments (Product/Age /Sales Channel/Region)
        • Sales Footprint
        • Strategy Overview
          • Marketing Strategy
          • Product Strategy
          • Channel Strategy
      • Ingredion
        • Overview
        • Product Portfolio
        • Profitability by Market Segments (Product/Age /Sales Channel/Region)
        • Sales Footprint
        • Strategy Overview
          • Marketing Strategy
          • Product Strategy
          • Channel Strategy
      • Tereos Starch & Sweeteners
        • Overview
        • Product Portfolio
        • Profitability by Market Segments (Product/Age /Sales Channel/Region)
        • Sales Footprint
        • Strategy Overview
          • Marketing Strategy
          • Product Strategy
          • Channel Strategy
      • Everest Starch Pvt. Ltd.
        • Overview
        • Product Portfolio
        • Profitability by Market Segments (Product/Age /Sales Channel/Region)
        • Sales Footprint
        • Strategy Overview
          • Marketing Strategy
          • Product Strategy
          • Channel Strategy
      • Beneo GmbH
        • Overview
        • Product Portfolio
        • Profitability by Market Segments (Product/Age /Sales Channel/Region)
        • Sales Footprint
        • Strategy Overview
          • Marketing Strategy
          • Product Strategy
          • Channel Strategy
      • Kerry Group
        • Overview
        • Product Portfolio
        • Profitability by Market Segments (Product/Age /Sales Channel/Region)
        • Sales Footprint
        • Strategy Overview
          • Marketing Strategy
          • Product Strategy
          • Channel Strategy
      • Cooperatie Avebe U.A
        • Overview
        • Product Portfolio
        • Profitability by Market Segments (Product/Age /Sales Channel/Region)
        • Sales Footprint
        • Strategy Overview
          • Marketing Strategy
          • Product Strategy
          • Channel Strategy
      • Cargill Inc.
        • Overview
        • Product Portfolio
        • Profitability by Market Segments (Product/Age /Sales Channel/Region)
        • Sales Footprint
        • Strategy Overview
          • Marketing Strategy
          • Product Strategy
          • Channel Strategy
      • Emsland-Starke GmbH
        • Overview
        • Product Portfolio
        • Profitability by Market Segments (Product/Age /Sales Channel/Region)
        • Sales Footprint
        • Strategy Overview
          • Marketing Strategy
          • Product Strategy
          • Channel Strategy
  19. Assumptions & Acronyms Used
  20. Research Methodology

List of Tables

  • Table 1: Global Market Value (USD Million) Forecast by Region, 2020-2035
  • Table 2: Global Market Volume (Metric Tons) Forecast by Region, 2020-2035
  • Table 3: Global Market Value (USD Million) Forecast by Type, 2020-2035
  • Table 4: Global Market Volume (Metric Tons) Forecast by Type, 2020-2035
  • Table 5: Global Market Value (USD Million) Forecast by Application, 2020-2035
  • Table 6: Global Market Volume (Metric Tons) Forecast by Application, 2020-2035
  • Table 7: North America Market Value (USD Million) Forecast by Country, 2020-2035
  • Table 8: North America Market Volume (Metric Tons) Forecast by Country, 2020-2035
  • Table 9: North America Market Value (USD Million) Forecast by Type, 2020-2035
  • Table 10: North America Market Volume (Metric Tons) Forecast by Type, 2020-2035
  • Table 11: North America Market Value (USD Million) Forecast by Application, 2020-2035
  • Table 12: North America Market Volume (Metric Tons) Forecast by Application, 2020-2035
  • Table 13: Latin America Market Value (USD Million) Forecast by Country, 2020-2035
  • Table 14: Latin America Market Volume (Metric Tons) Forecast by Country, 2020-2035
  • Table 15: Latin America Market Value (USD Million) Forecast by Type, 2020-2035
  • Table 16: Latin America Market Volume (Metric Tons) Forecast by Type, 2020-2035
  • Table 17: Latin America Market Value (USD Million) Forecast by Application, 2020-2035
  • Table 18: Latin America Market Volume (Metric Tons) Forecast by Application, 2020-2035
  • Table 19: Western Europe Market Value (USD Million) Forecast by Country, 2020-2035
  • Table 20: Western Europe Market Volume (Metric Tons) Forecast by Country, 2020-2035
  • Table 21: Western Europe Market Value (USD Million) Forecast by Type, 2020-2035
  • Table 22: Western Europe Market Volume (Metric Tons) Forecast by Type, 2020-2035
  • Table 23: Western Europe Market Value (USD Million) Forecast by Application, 2020-2035
  • Table 24: Western Europe Market Volume (Metric Tons) Forecast by Application, 2020-2035
  • Table 25: Eastern Europe Market Value (USD Million) Forecast by Country, 2020-2035
  • Table 26: Eastern Europe Market Volume (Metric Tons) Forecast by Country, 2020-2035
  • Table 27: Eastern Europe Market Value (USD Million) Forecast by Type, 2020-2035
  • Table 28: Eastern Europe Market Volume (Metric Tons) Forecast by Type, 2020-2035
  • Table 29: Eastern Europe Market Value (USD Million) Forecast by Application, 2020-2035
  • Table 30: Eastern Europe Market Volume (Metric Tons) Forecast by Application, 2020-2035
  • Table 31: East Asia Market Value (USD Million) Forecast by Country, 2020-2035
  • Table 32: East Asia Market Volume (Metric Tons) Forecast by Country, 2020-2035
  • Table 33: East Asia Market Value (USD Million) Forecast by Type, 2020-2035
  • Table 34: East Asia Market Volume (Metric Tons) Forecast by Type, 2020-2035
  • Table 35: East Asia Market Value (USD Million) Forecast by Application, 2020-2035
  • Table 36: East Asia Market Volume (Metric Tons) Forecast by Application, 2020-2035
  • Table 37: South Asia & Pacific Market Value (USD Million) Forecast by Country, 2020-2035
  • Table 38: South Asia & Pacific Market Volume (Metric Tons) Forecast by Country, 2020-2035
  • Table 39: South Asia & Pacific Market Value (USD Million) Forecast by Type, 2020-2035
  • Table 40: South Asia & Pacific Market Volume (Metric Tons) Forecast by Type, 2020-2035
  • Table 41: South Asia & Pacific Market Value (USD Million) Forecast by Application, 2020-2035
  • Table 42: South Asia & Pacific Market Volume (Metric Tons) Forecast by Application, 2020-2035
  • Table 43: Middle East and Africa Market Value (USD Million) Forecast by Country, 2020-2035
  • Table 44: Middle East and Africa Market Volume (Metric Tons) Forecast by Country, 2020-2035
  • Table 45: Middle East and Africa Market Value (USD Million) Forecast by Type, 2020-2035
  • Table 46: Middle East and Africa Market Volume (Metric Tons) Forecast by Type, 2020-2035
  • Table 47: Middle East and Africa Market Value (USD Million) Forecast by Application, 2020-2035
  • Table 48: Middle East and Africa Market Volume (Metric Tons) Forecast by Application, 2020-2035

List of Figures

  • Figure 1: Global Market Volume (Metric Tons) Forecast 2020-2035
  • Figure 2: Global Market Pricing Analysis
  • Figure 3: Global Market Value (USD Million) Forecast 2020-2035
  • Figure 4: Global Market Value Share and BPS Analysis by Type, 2025 and 2035
  • Figure 5: Global Market Y-o-Y Growth Comparison by Type, 2025-2035
  • Figure 6: Global Market Attractiveness Analysis by Type
  • Figure 7: Global Market Value Share and BPS Analysis by Application, 2025 and 2035
  • Figure 8: Global Market Y-o-Y Growth Comparison by Application, 2025-2035
  • Figure 9: Global Market Attractiveness Analysis by Application
  • Figure 10: Global Market Value (USD Million) Share and BPS Analysis by Region, 2025 and 2035
  • Figure 11: Global Market Y-o-Y Growth Comparison by Region, 2025-2035
  • Figure 12: Global Market Attractiveness Analysis by Region
  • Figure 13: North America Market Incremental $ Opportunity, 2025-2035
  • Figure 14: Latin America Market Incremental $ Opportunity, 2025-2035
  • Figure 15: Western Europe Market Incremental $ Opportunity, 2025-2035
  • Figure 16: Eastern Europe Market Incremental $ Opportunity, 2025-2035
  • Figure 17: East Asia Market Incremental $ Opportunity, 2025-2035
  • Figure 18: South Asia & Pacific Market Incremental $ Opportunity, 2025-2035
  • Figure 19: Middle East and Africa Market Incremental $ Opportunity, 2025-2035
  • Figure 20: North America Market Value Share and BPS Analysis by Country, 2025 and 2035
  • Figure 21: North America Market Value Share and BPS Analysis by Type, 2025 and 2035
  • Figure 22: North America Market Y-o-Y Growth Comparison by Type, 2025-2035
  • Figure 23: North America Market Attractiveness Analysis by Type
  • Figure 24: North America Market Value Share and BPS Analysis by Application, 2025 and 2035
  • Figure 25: North America Market Y-o-Y Growth Comparison by Application, 2025-2035
  • Figure 26: North America Market Attractiveness Analysis by Application
  • Figure 27: Latin America Market Value Share and BPS Analysis by Country, 2025 and 2035
  • Figure 28: Latin America Market Value Share and BPS Analysis by Type, 2025 and 2035
  • Figure 29: Latin America Market Y-o-Y Growth Comparison by Type, 2025-2035
  • Figure 30: Latin America Market Attractiveness Analysis by Type
  • Figure 31: Latin America Market Value Share and BPS Analysis by Application, 2025 and 2035
  • Figure 32: Latin America Market Y-o-Y Growth Comparison by Application, 2025-2035
  • Figure 33: Latin America Market Attractiveness Analysis by Application
  • Figure 34: Western Europe Market Value Share and BPS Analysis by Country, 2025 and 2035
  • Figure 35: Western Europe Market Value Share and BPS Analysis by Type, 2025 and 2035
  • Figure 36: Western Europe Market Y-o-Y Growth Comparison by Type, 2025-2035
  • Figure 37: Western Europe Market Attractiveness Analysis by Type
  • Figure 38: Western Europe Market Value Share and BPS Analysis by Application, 2025 and 2035
  • Figure 39: Western Europe Market Y-o-Y Growth Comparison by Application, 2025-2035
  • Figure 40: Western Europe Market Attractiveness Analysis by Application
  • Figure 41: Eastern Europe Market Value Share and BPS Analysis by Country, 2025 and 2035
  • Figure 42: Eastern Europe Market Value Share and BPS Analysis by Type, 2025 and 2035
  • Figure 43: Eastern Europe Market Y-o-Y Growth Comparison by Type, 2025-2035
  • Figure 44: Eastern Europe Market Attractiveness Analysis by Type
  • Figure 45: Eastern Europe Market Value Share and BPS Analysis by Application, 2025 and 2035
  • Figure 46: Eastern Europe Market Y-o-Y Growth Comparison by Application, 2025-2035
  • Figure 47: Eastern Europe Market Attractiveness Analysis by Application
  • Figure 48: East Asia Market Value Share and BPS Analysis by Country, 2025 and 2035
  • Figure 49: East Asia Market Value Share and BPS Analysis by Type, 2025 and 2035
  • Figure 50: East Asia Market Y-o-Y Growth Comparison by Type, 2025-2035
  • Figure 51: East Asia Market Attractiveness Analysis by Type
  • Figure 52: East Asia Market Value Share and BPS Analysis by Application, 2025 and 2035
  • Figure 53: East Asia Market Y-o-Y Growth Comparison by Application, 2025-2035
  • Figure 54: East Asia Market Attractiveness Analysis by Application
  • Figure 55: South Asia & Pacific Market Value Share and BPS Analysis by Country, 2025 and 2035
  • Figure 56: South Asia & Pacific Market Value Share and BPS Analysis by Type, 2025 and 2035
  • Figure 57: South Asia & Pacific Market Y-o-Y Growth Comparison by Type, 2025-2035
  • Figure 58: South Asia & Pacific Market Attractiveness Analysis by Type
  • Figure 59: South Asia & Pacific Market Value Share and BPS Analysis by Application, 2025 and 2035
  • Figure 60: South Asia & Pacific Market Y-o-Y Growth Comparison by Application, 2025-2035
  • Figure 61: South Asia & Pacific Market Attractiveness Analysis by Application
  • Figure 62: Middle East and Africa Market Value Share and BPS Analysis by Country, 2025 and 2035
  • Figure 63: Middle East and Africa Market Value Share and BPS Analysis by Type, 2025 and 2035
  • Figure 64: Middle East and Africa Market Y-o-Y Growth Comparison by Type, 2025-2035
  • Figure 65: Middle East and Africa Market Attractiveness Analysis by Type
  • Figure 66: Middle East and Africa Market Value Share and BPS Analysis by Application, 2025 and 2035
  • Figure 67: Middle East and Africa Market Y-o-Y Growth Comparison by Application, 2025-2035
  • Figure 68: Middle East and Africa Market Attractiveness Analysis by Application
  • Figure 69: Global Market - Tier Structure Analysis
  • Figure 70: Global Market - Company Share Analysis

Frequently Asked Questions

How big is the molding starch market in 2025?

The global molding starch market is estimated to be valued at USD 543.5 million in 2025.

What will be the size of molding starch market in 2035?

The molding starch market size is projected to reach USD 885.3 million by 2035.

How much will be the molding starch market growth between 2025 and 2035?

The molding starch market is expected to grow at a 5.0% CAGR between 2025 and 2035.

Which type is projected to lead in the molding starch market in 2025?

The rapidly digestible starch segment is projected to lead in the molding starch market with 45.0% market share in 2025.

Which application segment to contribute significant share in the molding starch market in 2025?

In terms of application, the candies segment is expected to command 40.0% share in the molding starch market in 2025.

Explore Similar Insights

Future Market Insights

Molding Starch Market