Auto Glass Moldings Market Size, Share, and Forecast Outlook 2025 to 2035

The auto glass moldings market is projected to grow from USD 3.8 billion in 2025 to USD 5.8 billion by 2035, registering a CAGR of 4.4% over the forecast period. Growth in the market is expected to be sustained by the increasing volume of vehicle production, rising replacement rates for damaged windshields, and greater demand for aerodynamic designs that require precision sealing solutions. Asia Pacific remains the dominant production hub, while North America and Europe continue to lead in aftersales demand.
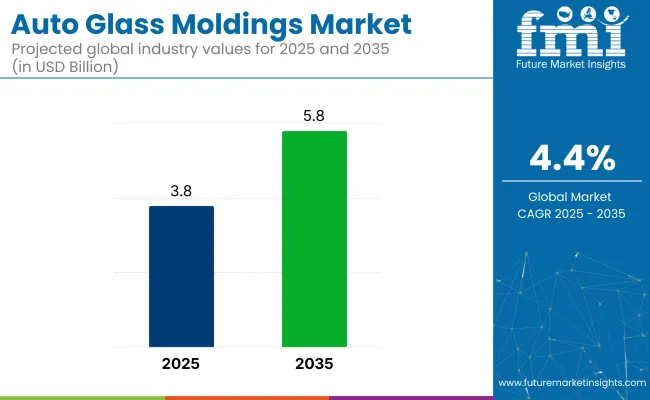
Quick Stats in the Auto Glass Moldings Market

  • Market Value (2025): USD 3.8 billion
  • Forecast Value (2035): USD 5.8 billion
  • Forecast CAGR: 4.4%
  • Top Product Width Segment: Windshield Molding (38% market share in 2025)
  • Leading Material Type: EPDM Rubber (46% market share in 2025)
  • Key Growth Country: India (6.0% CAGR)

Auto Glass Moldings Market

In 2025, the auto glass moldings market holds a modest but functionally important share across its broader parent markets. Within the global automotive glass market, it contributes approximately 5-7%, as moldings are essential for securing and sealing windshields and windows. In the automotive components market, its share is around 1-2%, reflecting its niche status among thousands of parts.

Within the automotive exterior parts market, the contribution is estimated at 3-4%, driven by its role in weatherproofing and design continuity. In the automotive aftermarket, it holds about 2-3%, due to steady demand for replacement moldings. In the vehicle body parts market, the share stands near 1-2%, as moldings represent a small yet necessary component of overall body assembly.

Material innovation, especially with EPDM rubber, thermoplastics, and UV-resistant compounds, is enhancing molding longevity and flexibility. Automated molding application systems in OEM assembly lines are helping reduce labor costs and improve fit precision. As vehicle designs evolve with sleeker rooflines and panoramic windshields, auto glass moldings are becoming more complex in shape and function, positioning the category for steady growth across both OEM and aftermarket channels.

Analyzing Auto Glass Moldings Market by Top Investment Segments for 2025

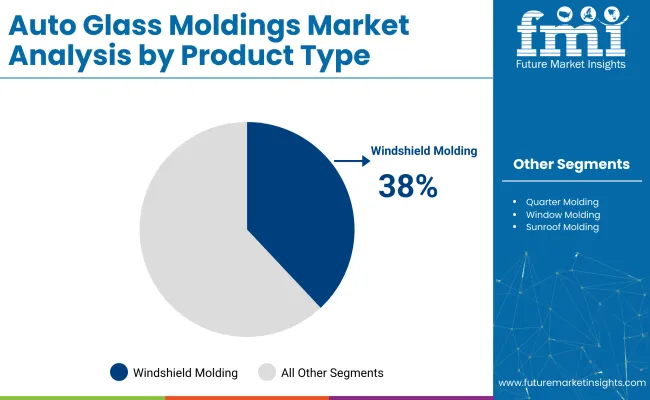
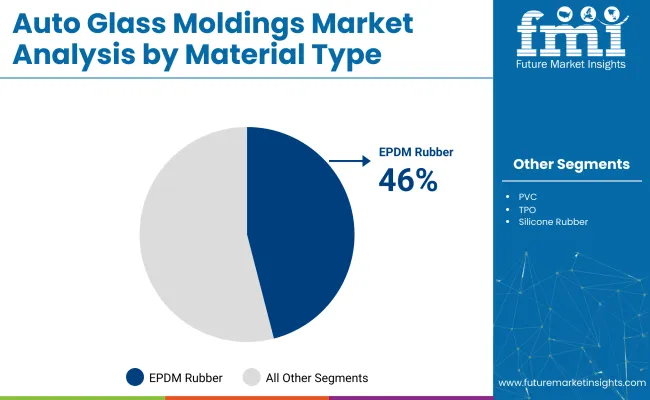
Windshield moldings are projected to dominate the product width segment with a 38% market share by 2025, while EPDM rubber is expected to lead the material type segment with a 46% share. Passenger cars are set to capture 70% of the end-use segment.

Windshield Moldings to Lead Product Width Segment with 38% Market Share

Windshield moldings are projected to lead the product width segment, accounting for 38% of the global market share by 2025. These components are essential for sealing the perimeter of the windshield and preventing water and air leakage.
  • Windshield moldings have been widely adopted in automotive assembly lines to provide aerodynamic efficiency, reduce noise, and enhance visual appeal.
  • Increasing passenger safety regulations and consumer preferences for sleek vehicle profiles have supported the demand for precision-fit windshield moldings. These parts are being custom-engineered by OEMs to integrate seamlessly with complex windshield designs in modern vehicle models.

Auto Glass Moldings Market Analysis By Product Type

EPDM Rubber to Dominate Material Type Segment with 46% Market Share

EPDM rubber is projected to dominate the material type segment, capturing 46% of the global market share by 2025. This material is favored for its flexibility, weather resistance, and long service life.
  • Moldings made from EPDM rubber have been used extensively in sealing applications due to their resistance to UV rays, ozone, and temperature fluctuations.
  • Auto manufacturers prefer EPDM rubber for molding production because it ensures reliable performance in varying climates. It has also been selected for its recyclability and cost-effectiveness, supporting its increased usage across both economy and premium vehicle categories.

Auto Glass Moldings Market Analysis By Material Type

Passenger Cars to Dominate End-Use Segment with 70% Market Share

Passenger cars are expected to lead the end-use segment, holding 70% of the global market share by 2025. This dominance is supported by the high volume of passenger vehicle production worldwide.

  • Auto glass moldings have been extensively used in passenger cars to improve weather sealing, vibration reduction, and overall design aesthetics.
  • Rising consumer demand for low-noise, energy-efficient cars, OEMs are installing high-quality moldings during vehicle assembly. Continuous improvements in glass architecture and aerodynamic vehicle profiles have further driven the adoption of precise, durable molding systems in sedans, SUVs, and electric vehicles.

First Fit (OEM) to Lead Sales Channel Segment with 75% Market Share

First fit (OEM) is projected to dominate the sales channel segment, securing 75% of the market share by 2025. This is due to increased vehicle production and integration of custom-fitted components at the manufacturing stage.

  • Moldings are being directly installed by OEMs to meet strict design and performance standards during initial vehicle assembly. Their integration ensures seamless compatibility and long-term functionality.
  • Global automotive OEMs are partnering with molding manufacturers to develop lightweight, durable solutions that meet industry regulations. The growing shift toward factory-installed accessories has reinforced the preference for OEM-supplied moldings in both domestic and export-oriented markets

Top Auto Glass Moldings Market Dynamics

The auto glass moldings market is witnessing steady growth due to rising vehicle production, demand for aerodynamic designs, and greater emphasis on noise and weather insulation. OEMs and aftermarket suppliers are focusing on durability, precision fit, and material innovation to meet evolving design and performance standards across passenger and commercial vehicles.

Strong Demand for Windshield and Window Sealing Applications

Auto glass moldings are critical for sealing windshields, side windows, and rear glass to prevent water leakage, wind intrusion, and noise. These components enhance vehicle comfort, structural integrity, and safety. As automotive designs shift toward sleeker profiles and frameless windows, moldings are engineered to provide seamless integration and high adhesion to diverse glass types.

  • Used in windshields and side windows to prevent water, wind, and noise intrusion.
  • Essential for maintaining vehicle cabin comfort and glass structural support.
  • Adapted to modern frameless and flush-mount glass designs for aesthetic fit.

Adoption of Advanced Materials and High-Performance Coatings

Manufacturers are developing moldings using high-durability rubber, EPDM, and thermoplastic elastomers (TPEs) that offer UV resistance, flexibility, and long-term sealing. Co-extruded and flocked moldings are gaining popularity for improved performance in harsh environments. Special coatings are applied to resist weathering, improve bonding with adhesives, and enhance friction control during glass movement.
  • Advanced materials like EPDM and TPEs provide weather and UV resistance.
  • Flocked and coated moldings enhance performance under extreme conditions.
  • Co-extrusion techniques ensure durability, sealing strength, and fit precision.

Analysis of Top Countries Manufacturing, Integrating, and Supplying Auto Glass Moldings Globally

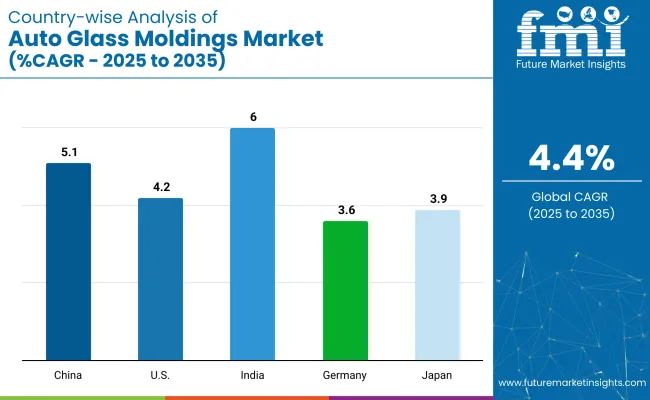
Country Wise Analysis Of Auto Glass Moldings Market Cagr 2025 To 2035

Countries CAGR (2025 to 2035)
India 6.0%
China 5.1%
United States 4.2%
Japan 3.9%
Germany 3.6%

The global auto glass moldings market is projected to grow steadily through 2035, supported by rising demand for precision-fit sealing, lightweight trim components, and improved aerodynamic insulation. Regional growth is influenced by OEM design shifts, EV platform integration, and localized molding production.

India leads the top five countries with a CAGR of 6.0%, followed by China at 5.1%, as both countries scale automotive manufacturing and local part sourcing. The United States (4.2%), Japan (3.9%), and Germany (3.6%) reflect consistent demand tied to vehicle refresh cycles, platform redesigns, and regulatory compliance.

BRICS economies such as China and India are focused on high-volume production and cost-efficient moldings. In contrast, OECD markets like Germany, Japan, and the United States are emphasizing quality, fit precision, and material sustainability.

The report covers insights across more than 40 countries. The five below are highlighted for their strategic influence and growth trajectory.

Growth Outlook for Auto Glass Moldings Market in India

Indian market is projected to grow at a CAGR of 6.0%, supported by strong expansion in the domestic vehicle manufacturing sector and rising demand for localized part supply. The country is witnessing high demand from the compact and mid-size car segments, where cost-effective, easy-to-install moldings are prioritized. India's warm climate and dusty conditions also drive the need for UV- and abrasion-resistant materials in sealing applications. Local manufacturers are investing in extrusion capacity to serve growing demand from OEMs and aftermarket distributors.

  • Compact vehicle production is creating demand for cost-efficient moldings.
  • UV- and dust-resistant sealing materials are widely adopted.
  • Local extrusion facilities are scaling output for OEM supply.

Demand Forecast for Auto Glass Moldings Market in China

China’s market is expected to grow at a CAGR of 5.1%, fueled by continued growth in electric vehicle manufacturing and a strong domestic supply base. Moldings are increasingly used in EV models to enhance noise insulation and reduce drag. Local joint ventures are expanding their capacity to produce co-extruded profiles that meet aerodynamic and aesthetic needs. China also benefits from its role as a major auto glass producer, allowing close integration between glass and molding systems during vehicle assembly.

  • EV manufacturers are using advanced moldings to improve noise reduction.
  • Domestic suppliers are investing in co-extrusion for complex profiles.
  • Close integration with local glass production supports supply efficiency.

Future Trends in Auto Glass Moldings Market in the United States

The USA market is growing at a CAGR of 4.2%, driven by steady demand from both OEM platforms and aftermarket replacements. The USA market places strong emphasis on moldings that combine flame resistance, noise insulation, and structural flexibility. High-volume segments such as SUVs and light trucks are adopting custom profiles for improved water sealing and fit. Environmental compliance is also pushing manufacturers to explore recyclable materials in molding compounds for domestic assembly and service networks.

  • High-volume SUV production is increasing the need for robust moldings.
  • Multi-functional profiles are being used in aftermarket and OEM channels.
  • Recyclable materials are gaining interest for use in vehicle trim systems.

Expansion Analysis of Auto Glass Moldings Market in Japan

Japan’s market is forecast to expand at a CAGR of 3.9%, shaped by the country’s focus on compact vehicles and engineering precision. Moldings in Japan are often customized to meet ultra-low tolerance standards for hybrid cars and high-efficiency sedans. Local OEMs prefer seamless, single-piece profiles that reduce noise and improve cabin aerodynamics. Japan’s domestic rubber and polymer industries provide a reliable base for high-quality molding inputs, particularly for window and windshield applications.

  • Moldings with tight tolerances are used for aerodynamic efficiency.
  • One-piece profiles reduce air leakage in compact and hybrid models.
  • Local rubber suppliers ensure consistency in sealing performance.

Analysis of Auto Glass Moldings Market in Germany

Germany’s market is projected to grow at a CAGR of 3.6%, supported by demand from luxury OEMs and a strong focus on vehicle design precision. Germany stands out for its emphasis on flush-mounted windows, which require moldings that offer both sealing capability and visual continuity. Automakers are using advanced thermoplastic elastomers to meet performance requirements in premium electric and hybrid vehicles. The aftermarket also plays a role in maintaining molding quality across aging fleets.

  • Flush-mount glass systems are driving need for precision moldings.
  • Premium EV models are using specialized thermoplastic compounds.
  • Retrofit demand is growing in high-end vehicle segments.

Leading Auto Glass Moldings Manufacturers

The auto glass moldings market is moderately consolidated, with key players such as TOYODA GOSEI Co., Ltd., Cooper Standard Automotive, and HWASEUNG leading through strong OEM partnerships and material innovation. TOYODA GOSEI is widely recognized for its high-precision rubber and plastic moldings used in sealing systems for windshields and side windows. Cooper Standard Automotive offers a broad portfolio of weatherstrips and glass run channels, with a focus on lightweight and durable solutions for enhanced vehicle aerodynamics.

HWASEUNG contributes significantly with advanced EPDM-based moldings designed for both acoustic performance and environmental resistance. FlexiTrim (Meteor-creative) and Hebei Shida Seal Group serve regional and aftermarket needs, offering customized sealing solutions for passenger and commercial vehicles.

Recent Auto Glass Moldings Industry News

  • In January 2025, Kaizen Glass Solutions launched an on-site ADAS calibration training program for auto glass technicians to meet the rising need for in-house dynamic calibration of sensor-equipped windshields.
  • In April 2025, AGC Inc. introduced its FeelInGlass® HUD band at CES, featuring an integrated micro-LED display laminated into the windshield.

Report Coverage and Scope Summary

Report Attributes Details
Market Size (2025) USD 3.8 billion
Projected Market Size (2035) USD 5.8 billion
CAGR (2025 to 2035) 4.4%
Base Year for Estimation 2024
Historical Period 2020 to 2024
Projections Period 2025 to 2035
Quantitative Units USD billion for market value
Product Types Analyzed (Segment 1) Windshield Molding, Quarter Molding, Window Molding, Sunroof Molding
Material Types Analyzed (Segment 2) EPDM, PVC, TPO, Silicone Rubber, Others
End Uses Analyzed (Segment 3) Passenger Cars, Light Commercial Vehicles, Heavy Commercial Vehicles
Sales Channels Analyzed First Fit, Aftermarket
Regions Covered North America, Latin America, Eastern Europe, Western Europe, South Asia & Pacific, East Asia, Middle East & Africa
Countries Covered United States, Canada, Germany, United Kingdom, France, Japan, China, India, South Korea, Brazil
Key Players FlexiTrim (Meteor-creative), Cooper Standard Automotive, TOYODA GOSEI Co., Ltd., Hebei Shida Seal Group, Bharat Seats Ltd., HWASEUNG
Additional Attributes Dollar sales by product type and end use, growing vehicle production, rising aftermarket replacements, and increasing preference for weather-resistant and noise-insulating materials.

Leading Players in the Auto Glass Moldings Industry

  • FlexiTrim (Meteor-creative)
  • Cooper Standard Automotive
  • TOYODA GOSEI Co., Ltd.
  • Hebei Shida Seal Group
  • Bharat Seats Ltd.
  • HWASEUNG

Auto Glass Moldings Market Analyzed by Key Investment Segments

By Product Type:

The market is segmented by product type into windshield molding, quarter molding, window molding, and sunroof molding.

By Material Type:

Based on material type, the market includes EPDM (Ethylene Propylene Diene Monomer), PVC (Polyvinyl Chloride), TPO (Thermoplastic Olefin), silicone rubber, and other materials.

By End Use:

By end use, the market is categorized into passenger cars, light commercial vehicles, and heavy commercial vehicles.

By Sales Channel:

The sales channel segmentation includes first-fit and aftermarket segments.

By Region:

Regionally, the market spans North America, Latin America, Eastern Europe, Western Europe, South Asia & Pacific, East Asia, and the Middle East & Africa.

Table of Content

  1. Executive Summary
    • Global Market Outlook
    • Demand-side Trends
    • Supply-side Trends
    • Technology Roadmap Analysis
    • Analysis and Recommendations
  2. Market Overview
    • Market Coverage / Taxonomy
    • Market Definition / Scope / Limitations
  3. Market Background
    • Market Dynamics
      • Drivers
      • Restraints
      • Opportunity
      • Trends
    • Scenario Forecast
      • Demand in Optimistic Scenario
      • Demand in Likely Scenario
      • Demand in Conservative Scenario
    • Opportunity Map Analysis
    • Product Life Cycle Analysis
    • Supply Chain Analysis
      • Supply Side Participants and their Roles
        • Producers
        • Mid-Level Participants (Traders/ Agents/ Brokers)
        • Wholesalers and Distributors
      • Value Added and Value Created at Node in the Supply Chain
      • List of Raw Material Suppliers
      • List of Existing and Potential Buyer’s
    • Investment Feasibility Matrix
    • Value Chain Analysis
      • Profit Margin Analysis
      • Wholesalers and Distributors
      • Retailers
    • PESTLE and Porter’s Analysis
    • Regulatory Landscape
      • By Key Regions
      • By Key Countries
    • Regional Parent Market Outlook
    • Production and Consumption Statistics
    • Import and Export Statistics
  4. Global Market Analysis 2020 to 2024 and Forecast, 2025 to 2035
    • Historical Market Size Value (USD Billion) & Volume (Metric tons) Analysis, 2020 to 2024
    • Current and Future Market Size Value (USD Billion) & Volume (Metric tons) Projections, 2025 to 2035
      • Y-o-Y Growth Trend Analysis
      • Absolute $ Opportunity Analysis
  5. Global Market Pricing Analysis 2020 to 2024 and Forecast 2025 to 2035
  6. Global Market Analysis 2020 to 2024 and Forecast 2025 to 2035, By Product Type
    • Introduction / Key Findings
    • Historical Market Size Value (USD Billion) & Volume (Metric tons) Analysis By Product Type, 2020 to 2024
    • Current and Future Market Size Value (USD Billion) & Volume (Metric tons) Analysis and Forecast By Product Type, 2025 to 2035
      • Windshield Molding
      • Quarter Molding
      • Window Molding
      • Sunroof Molding
    • Y-o-Y Growth Trend Analysis By Product Type, 2020 to 2024
    • Absolute $ Opportunity Analysis By Product Type, 2025 to 2035
  7. Global Market Analysis 2020 to 2024 and Forecast 2025 to 2035, By Material Type
    • Introduction / Key Findings
    • Historical Market Size Value (USD Billion) & Volume (Metric tons) Analysis By Material Type, 2020 to 2024
    • Current and Future Market Size Value (USD Billion) & Volume (Metric tons) Analysis and Forecast By Material Type, 2025 to 2035
      • EPDM
      • PVC
      • TPO
      • Silicone Rubber
      • Others
    • Y-o-Y Growth Trend Analysis By Material Type, 2020 to 2024
    • Absolute $ Opportunity Analysis By Material Type, 2025 to 2035
  8. Global Market Analysis 2020 to 2024 and Forecast 2025 to 2035, By End Use
    • Introduction / Key Findings
    • Historical Market Size Value (USD Billion) & Volume (Metric tons) Analysis By End Use, 2020 to 2024
    • Current and Future Market Size Value (USD Billion) & Volume (Metric tons) Analysis and Forecast By End Use, 2025 to 2035
      • Passenger Cars
      • Light Commercial Vehicles
      • Heavy Commercial Vehicles
    • Y-o-Y Growth Trend Analysis By End Use, 2020 to 2024
    • Absolute $ Opportunity Analysis By End Use, 2025 to 2035
  9. Global Market Analysis 2020 to 2024 and Forecast 2025 to 2035, By Sales Channel
    • Introduction / Key Findings
    • Historical Market Size Value (USD Billion) & Volume (Metric tons) Analysis By Sales Channel, 2020 to 2024
    • Current and Future Market Size Value (USD Billion) & Volume (Metric tons) Analysis and Forecast By Sales Channel, 2025 to 2035
      • First Fit
      • Aftermarket
    • Y-o-Y Growth Trend Analysis By Sales Channel, 2020 to 2024
    • Absolute $ Opportunity Analysis By Sales Channel, 2025 to 2035
  10. Global Market Analysis 2020 to 2024 and Forecast 2025 to 2035, By Region
    • Introduction
    • Historical Market Size Value (USD Billion) & Volume (Metric tons) Analysis By Region, 2020 to 2024
    • Current Market Size Value (USD Billion) & Volume (Metric tons) Analysis and Forecast By Region, 2025 to 2035
      • North America
      • Latin America
      • Western Europe
      • Eastern Europe
      • East Asia
      • South Asia & Pacific
      • Middle East and Africa
    • Market Attractiveness Analysis By Region
  11. North America Market Analysis 2020 to 2024 and Forecast 2025 to 2035, By Country
    • Historical Market Size Value (USD Billion) & Volume (Metric tons) Trend Analysis By Market Taxonomy, 2020 to 2024
    • Market Size Value (USD Billion) & Volume (Metric tons) Forecast By Market Taxonomy, 2025 to 2035
      • By Country
        • USA
        • Canada
        • Mexico
      • By Product Type
      • By Material Type
      • By End Use
      • By Sales Channel
    • Market Attractiveness Analysis
      • By Country
      • By Product Type
      • By Material Type
      • By End Use
      • By Sales Channel
    • Key Takeaways
  12. Latin America Market Analysis 2020 to 2024 and Forecast 2025 to 2035, By Country
    • Historical Market Size Value (USD Billion) & Volume (Metric tons) Trend Analysis By Market Taxonomy, 2020 to 2024
    • Market Size Value (USD Billion) & Volume (Metric tons) Forecast By Market Taxonomy, 2025 to 2035
      • By Country
        • Brazil
        • Argentina
        • Rest of LATAM
      • By Product Type
      • By Material Type
      • By End Use
      • By Sales Channel
    • Market Attractiveness Analysis
      • By Country
      • By Product Type
      • By Material Type
      • By End Use
      • By Sales Channel
    • Key Takeaways
  13. Western Europe Market Analysis 2020 to 2024 and Forecast 2025 to 2035, By Country
    • Historical Market Size Value (USD Billion) & Volume (Metric tons) Trend Analysis By Market Taxonomy, 2020 to 2024
    • Market Size Value (USD Billion) & Volume (Metric tons) Forecast By Market Taxonomy, 2025 to 2035
      • By Country
        • Germany
        • Italy
        • France
        • UK
        • Spain
        • BENELUX
        • Nordic
        • Rest of W.Europe
      • By Product Type
      • By Material Type
      • By End Use
      • By Sales Channel
    • Market Attractiveness Analysis
      • By Country
      • By Product Type
      • By Material Type
      • By End Use
      • By Sales Channel
    • Key Takeaways
  14. Eastern Europe Market Analysis 2020 to 2024 and Forecast 2025 to 2035, By Country
    • Historical Market Size Value (USD Billion) & Volume (Metric tons) Trend Analysis By Market Taxonomy, 2020 to 2024
    • Market Size Value (USD Billion) & Volume (Metric tons) Forecast By Market Taxonomy, 2025 to 2035
      • By Country
        • Russia
        • Hungary
        • Poland
        • Balkan & Baltics
        • Rest of E. Europe
      • By Product Type
      • By Material Type
      • By End Use
      • By Sales Channel
    • Market Attractiveness Analysis
      • By Country
      • By Product Type
      • By Material Type
      • By End Use
      • By Sales Channel
    • Key Takeaways
  15. East Asia Market Analysis 2020 to 2024 and Forecast 2025 to 2035, By Country
    • Historical Market Size Value (USD Billion) & Volume (Metric tons) Trend Analysis By Market Taxonomy, 2020 to 2024
    • Market Size Value (USD Billion) & Volume (Metric tons) Forecast By Market Taxonomy, 2025 to 2035
      • By Country
        • China
        • Japan
        • South Korea
      • By Product Type
      • By Material Type
      • By End Use
      • By Sales Channel
    • Market Attractiveness Analysis
      • By Country
      • By Product Type
      • By Material Type
      • By End Use
      • By Sales Channel
    • Key Takeaways
  16. South Asia & Pacific Market Analysis 2020 to 2024 and Forecast 2025 to 2035, By Country
    • Historical Market Size Value (USD Billion) & Volume (Metric tons) Trend Analysis By Market Taxonomy, 2020 to 2024
    • Market Size Value (USD Billion) & Volume (Metric tons) Forecast By Market Taxonomy, 2025 to 2035
      • By Country
        • India
        • Australia & New Zealand
        • ASEAN
        • Rest of SAP
      • By Product Type
      • By Material Type
      • By End Use
      • By Sales Channel
    • Market Attractiveness Analysis
      • By Country
      • By Product Type
      • By Material Type
      • By End Use
      • By Sales Channel
    • Key Takeaways
  17. Middle East and Africa Market Analysis 2020 to 2024 and Forecast 2025 to 2035, By Country
    • Historical Market Size Value (USD Billion) & Volume (Metric tons) Trend Analysis By Market Taxonomy, 2020 to 2024
    • Market Size Value (USD Billion) & Volume (Metric tons) Forecast By Market Taxonomy, 2025 to 2035
      • By Country
        • GCC Countries
        • Northern Africa
        • South Africa
        • Turkiye
        • Rest of MEA
      • By Product Type
      • By Material Type
      • By End Use
      • By Sales Channel
    • Market Attractiveness Analysis
      • By Country
      • By Product Type
      • By Material Type
      • By End Use
      • By Sales Channel
    • Key Takeaways
  18. Key Countries Market Analysis
    • USA
      • Pricing Analysis
      • Market Share Analysis, 2024
        • By Product Type
        • By Material Type
        • By End Use
        • By Sales Channel
    • Canada
      • Pricing Analysis
      • Market Share Analysis, 2024
        • By Product Type
        • By Material Type
        • By End Use
        • By Sales Channel
    • Brazil
      • Pricing Analysis
      • Market Share Analysis, 2024
        • By Product Type
        • By Material Type
        • By End Use
        • By Sales Channel
    • Mexico
      • Pricing Analysis
      • Market Share Analysis, 2024
        • By Product Type
        • By Material Type
        • By End Use
        • By Sales Channel
    • Argentina
      • Pricing Analysis
      • Market Share Analysis, 2024
        • By Product Type
        • By Material Type
        • By End Use
        • By Sales Channel
  19. Market Structure Analysis
    • Competition Dashboard
    • Competition Benchmarking
    • Market Share Analysis of Top Players
      • By Regional
      • By Product Type
      • By Material Type
      • By End Use
      • By Sales Channel
  20. Competition Analysis
    • Competition Deep Dive
      • FlexiTrim (Meteor-creative)
        • Overview
        • Product Portfolio
        • Profitability by Market Segments (Product/Age /Sales Channel/Region)
        • Sales Footprint
        • Strategy Overview
          • Marketing Strategy
          • Product Strategy
          • Channel Strategy
      • Cooper Standard Automotive
        • Overview
        • Product Portfolio
        • Profitability by Market Segments (Product/Age /Sales Channel/Region)
        • Sales Footprint
        • Strategy Overview
          • Marketing Strategy
          • Product Strategy
          • Channel Strategy
      • TOYODA GOSEI Co., Ltd.
        • Overview
        • Product Portfolio
        • Profitability by Market Segments (Product/Age /Sales Channel/Region)
        • Sales Footprint
        • Strategy Overview
          • Marketing Strategy
          • Product Strategy
          • Channel Strategy
      • Hebei Shida Seal Group
        • Overview
        • Product Portfolio
        • Profitability by Market Segments (Product/Age /Sales Channel/Region)
        • Sales Footprint
        • Strategy Overview
          • Marketing Strategy
          • Product Strategy
          • Channel Strategy
      • Bharat Seats Ltd.
        • Overview
        • Product Portfolio
        • Profitability by Market Segments (Product/Age /Sales Channel/Region)
        • Sales Footprint
        • Strategy Overview
          • Marketing Strategy
          • Product Strategy
          • Channel Strategy
      • HWASEUNG
        • Overview
        • Product Portfolio
        • Profitability by Market Segments (Product/Age /Sales Channel/Region)
        • Sales Footprint
        • Strategy Overview
          • Marketing Strategy
          • Product Strategy
          • Channel Strategy
  21. Assumptions & Acronyms Used
  22. Research Methodology

List of Tables

  • Table 1: Global Market Value (USD Billion) Forecast by Region, 2020 to 2035
  • Table 2: Global Market Volume (Metric tons) Forecast by Region, 2020 to 2035
  • Table 3: Global Market Value (USD Billion) Forecast by Product Type, 2020 to 2035
  • Table 4: Global Market Volume (Metric tons) Forecast by Product Type, 2020 to 2035
  • Table 5: Global Market Value (USD Billion) Forecast by Material Type, 2020 to 2035
  • Table 6: Global Market Volume (Metric tons) Forecast by Material Type, 2020 to 2035
  • Table 7: Global Market Value (USD Billion) Forecast by End Use, 2020 to 2035
  • Table 8: Global Market Volume (Metric tons) Forecast by End Use, 2020 to 2035
  • Table 9: Global Market Value (USD Billion) Forecast by Sales Channel, 2020 to 2035
  • Table 10: Global Market Volume (Metric tons) Forecast by Sales Channel, 2020 to 2035
  • Table 11: North America Market Value (USD Billion) Forecast by Country, 2020 to 2035
  • Table 12: North America Market Volume (Metric tons) Forecast by Country, 2020 to 2035
  • Table 13: North America Market Value (USD Billion) Forecast by Product Type, 2020 to 2035
  • Table 14: North America Market Volume (Metric tons) Forecast by Product Type, 2020 to 2035
  • Table 15: North America Market Value (USD Billion) Forecast by Material Type, 2020 to 2035
  • Table 16: North America Market Volume (Metric tons) Forecast by Material Type, 2020 to 2035
  • Table 17: North America Market Value (USD Billion) Forecast by End Use, 2020 to 2035
  • Table 18: North America Market Volume (Metric tons) Forecast by End Use, 2020 to 2035
  • Table 19: North America Market Value (USD Billion) Forecast by Sales Channel, 2020 to 2035
  • Table 20: North America Market Volume (Metric tons) Forecast by Sales Channel, 2020 to 2035
  • Table 21: Latin America Market Value (USD Billion) Forecast by Country, 2020 to 2035
  • Table 22: Latin America Market Volume (Metric tons) Forecast by Country, 2020 to 2035
  • Table 23: Latin America Market Value (USD Billion) Forecast by Product Type, 2020 to 2035
  • Table 24: Latin America Market Volume (Metric tons) Forecast by Product Type, 2020 to 2035
  • Table 25: Latin America Market Value (USD Billion) Forecast by Material Type, 2020 to 2035
  • Table 26: Latin America Market Volume (Metric tons) Forecast by Material Type, 2020 to 2035
  • Table 27: Latin America Market Value (USD Billion) Forecast by End Use, 2020 to 2035
  • Table 28: Latin America Market Volume (Metric tons) Forecast by End Use, 2020 to 2035
  • Table 29: Latin America Market Value (USD Billion) Forecast by Sales Channel, 2020 to 2035
  • Table 30: Latin America Market Volume (Metric tons) Forecast by Sales Channel, 2020 to 2035
  • Table 31: Western Europe Market Value (USD Billion) Forecast by Country, 2020 to 2035
  • Table 32: Western Europe Market Volume (Metric tons) Forecast by Country, 2020 to 2035
  • Table 33: Western Europe Market Value (USD Billion) Forecast by Product Type, 2020 to 2035
  • Table 34: Western Europe Market Volume (Metric tons) Forecast by Product Type, 2020 to 2035
  • Table 35: Western Europe Market Value (USD Billion) Forecast by Material Type, 2020 to 2035
  • Table 36: Western Europe Market Volume (Metric tons) Forecast by Material Type, 2020 to 2035
  • Table 37: Western Europe Market Value (USD Billion) Forecast by End Use, 2020 to 2035
  • Table 38: Western Europe Market Volume (Metric tons) Forecast by End Use, 2020 to 2035
  • Table 39: Western Europe Market Value (USD Billion) Forecast by Sales Channel, 2020 to 2035
  • Table 40: Western Europe Market Volume (Metric tons) Forecast by Sales Channel, 2020 to 2035
  • Table 41: Eastern Europe Market Value (USD Billion) Forecast by Country, 2020 to 2035
  • Table 42: Eastern Europe Market Volume (Metric tons) Forecast by Country, 2020 to 2035
  • Table 43: Eastern Europe Market Value (USD Billion) Forecast by Product Type, 2020 to 2035
  • Table 44: Eastern Europe Market Volume (Metric tons) Forecast by Product Type, 2020 to 2035
  • Table 45: Eastern Europe Market Value (USD Billion) Forecast by Material Type, 2020 to 2035
  • Table 46: Eastern Europe Market Volume (Metric tons) Forecast by Material Type, 2020 to 2035
  • Table 47: Eastern Europe Market Value (USD Billion) Forecast by End Use, 2020 to 2035
  • Table 48: Eastern Europe Market Volume (Metric tons) Forecast by End Use, 2020 to 2035
  • Table 49: Eastern Europe Market Value (USD Billion) Forecast by Sales Channel, 2020 to 2035
  • Table 50: Eastern Europe Market Volume (Metric tons) Forecast by Sales Channel, 2020 to 2035
  • Table 51: East Asia Market Value (USD Billion) Forecast by Country, 2020 to 2035
  • Table 52: East Asia Market Volume (Metric tons) Forecast by Country, 2020 to 2035
  • Table 53: East Asia Market Value (USD Billion) Forecast by Product Type, 2020 to 2035
  • Table 54: East Asia Market Volume (Metric tons) Forecast by Product Type, 2020 to 2035
  • Table 55: East Asia Market Value (USD Billion) Forecast by Material Type, 2020 to 2035
  • Table 56: East Asia Market Volume (Metric tons) Forecast by Material Type, 2020 to 2035
  • Table 57: East Asia Market Value (USD Billion) Forecast by End Use, 2020 to 2035
  • Table 58: East Asia Market Volume (Metric tons) Forecast by End Use, 2020 to 2035
  • Table 59: East Asia Market Value (USD Billion) Forecast by Sales Channel, 2020 to 2035
  • Table 60: East Asia Market Volume (Metric tons) Forecast by Sales Channel, 2020 to 2035
  • Table 61: South Asia & Pacific Market Value (USD Billion) Forecast by Country, 2020 to 2035
  • Table 62: South Asia & Pacific Market Volume (Metric tons) Forecast by Country, 2020 to 2035
  • Table 63: South Asia & Pacific Market Value (USD Billion) Forecast by Product Type, 2020 to 2035
  • Table 64: South Asia & Pacific Market Volume (Metric tons) Forecast by Product Type, 2020 to 2035
  • Table 65: South Asia & Pacific Market Value (USD Billion) Forecast by Material Type, 2020 to 2035
  • Table 66: South Asia & Pacific Market Volume (Metric tons) Forecast by Material Type, 2020 to 2035
  • Table 67: South Asia & Pacific Market Value (USD Billion) Forecast by End Use, 2020 to 2035
  • Table 68: South Asia & Pacific Market Volume (Metric tons) Forecast by End Use, 2020 to 2035
  • Table 69: South Asia & Pacific Market Value (USD Billion) Forecast by Sales Channel, 2020 to 2035
  • Table 70: South Asia & Pacific Market Volume (Metric tons) Forecast by Sales Channel, 2020 to 2035
  • Table 71: Middle East and Africa Market Value (USD Billion) Forecast by Country, 2020 to 2035
  • Table 72: Middle East and Africa Market Volume (Metric tons) Forecast by Country, 2020 to 2035
  • Table 73: Middle East and Africa Market Value (USD Billion) Forecast by Product Type, 2020 to 2035
  • Table 74: Middle East and Africa Market Volume (Metric tons) Forecast by Product Type, 2020 to 2035
  • Table 75: Middle East and Africa Market Value (USD Billion) Forecast by Material Type, 2020 to 2035
  • Table 76: Middle East and Africa Market Volume (Metric tons) Forecast by Material Type, 2020 to 2035
  • Table 77: Middle East and Africa Market Value (USD Billion) Forecast by End Use, 2020 to 2035
  • Table 78: Middle East and Africa Market Volume (Metric tons) Forecast by End Use, 2020 to 2035
  • Table 79: Middle East and Africa Market Value (USD Billion) Forecast by Sales Channel, 2020 to 2035
  • Table 80: Middle East and Africa Market Volume (Metric tons) Forecast by Sales Channel, 2020 to 2035

List of Figures

  • Figure 1: Global Market Volume (Metric tons) Forecast 2020 to 2035
  • Figure 2: Global Market Pricing Analysis
  • Figure 3: Global Market Value (USD Billion) Forecast 2020 to 2035
  • Figure 4: Global Market Value Share and BPS Analysis by Product Type, 2025 and 2035
  • Figure 5: Global Market Y-o-Y Growth Comparison by Product Type, 2025 to 2035
  • Figure 6: Global Market Attractiveness Analysis by Product Type
  • Figure 7: Global Market Value Share and BPS Analysis by Material Type, 2025 and 2035
  • Figure 8: Global Market Y-o-Y Growth Comparison by Material Type, 2025 to 2035
  • Figure 9: Global Market Attractiveness Analysis by Material Type
  • Figure 10: Global Market Value Share and BPS Analysis by End Use, 2025 and 2035
  • Figure 11: Global Market Y-o-Y Growth Comparison by End Use, 2025 to 2035
  • Figure 12: Global Market Attractiveness Analysis by End Use
  • Figure 13: Global Market Value Share and BPS Analysis by Sales Channel, 2025 and 2035
  • Figure 14: Global Market Y-o-Y Growth Comparison by Sales Channel, 2025 to 2035
  • Figure 15: Global Market Attractiveness Analysis by Sales Channel
  • Figure 16: Global Market Value (USD Billion) Share and BPS Analysis by Region, 2025 and 2035
  • Figure 17: Global Market Y-o-Y Growth Comparison by Region, 2025 to 2035
  • Figure 18: Global Market Attractiveness Analysis by Region
  • Figure 19: North America Market Incremental $ Opportunity, 2025 to 2035
  • Figure 20: Latin America Market Incremental $ Opportunity, 2025 to 2035
  • Figure 21: Western Europe Market Incremental $ Opportunity, 2025 to 2035
  • Figure 22: Eastern Europe Market Incremental $ Opportunity, 2025 to 2035
  • Figure 23: East Asia Market Incremental $ Opportunity, 2025 to 2035
  • Figure 24: South Asia & Pacific Market Incremental $ Opportunity, 2025 to 2035
  • Figure 25: Middle East and Africa Market Incremental $ Opportunity, 2025 to 2035
  • Figure 26: North America Market Value Share and BPS Analysis by Country, 2025 and 2035
  • Figure 27: North America Market Value Share and BPS Analysis by Product Type, 2025 and 2035
  • Figure 28: North America Market Y-o-Y Growth Comparison by Product Type, 2025 to 2035
  • Figure 29: North America Market Attractiveness Analysis by Product Type
  • Figure 30: North America Market Value Share and BPS Analysis by Material Type, 2025 and 2035
  • Figure 31: North America Market Y-o-Y Growth Comparison by Material Type, 2025 to 2035
  • Figure 32: North America Market Attractiveness Analysis by Material Type
  • Figure 33: North America Market Value Share and BPS Analysis by End Use, 2025 and 2035
  • Figure 34: North America Market Y-o-Y Growth Comparison by End Use, 2025 to 2035
  • Figure 35: North America Market Attractiveness Analysis by End Use
  • Figure 36: North America Market Value Share and BPS Analysis by Sales Channel, 2025 and 2035
  • Figure 37: North America Market Y-o-Y Growth Comparison by Sales Channel, 2025 to 2035
  • Figure 38: North America Market Attractiveness Analysis by Sales Channel
  • Figure 39: Latin America Market Value Share and BPS Analysis by Country, 2025 and 2035
  • Figure 40: Latin America Market Value Share and BPS Analysis by Product Type, 2025 and 2035
  • Figure 41: Latin America Market Y-o-Y Growth Comparison by Product Type, 2025 to 2035
  • Figure 42: Latin America Market Attractiveness Analysis by Product Type
  • Figure 43: Latin America Market Value Share and BPS Analysis by Material Type, 2025 and 2035
  • Figure 44: Latin America Market Y-o-Y Growth Comparison by Material Type, 2025 to 2035
  • Figure 45: Latin America Market Attractiveness Analysis by Material Type
  • Figure 46: Latin America Market Value Share and BPS Analysis by End Use, 2025 and 2035
  • Figure 47: Latin America Market Y-o-Y Growth Comparison by End Use, 2025 to 2035
  • Figure 48: Latin America Market Attractiveness Analysis by End Use
  • Figure 49: Latin America Market Value Share and BPS Analysis by Sales Channel, 2025 and 2035
  • Figure 50: Latin America Market Y-o-Y Growth Comparison by Sales Channel, 2025 to 2035
  • Figure 51: Latin America Market Attractiveness Analysis by Sales Channel
  • Figure 52: Western Europe Market Value Share and BPS Analysis by Country, 2025 and 2035
  • Figure 53: Western Europe Market Value Share and BPS Analysis by Product Type, 2025 and 2035
  • Figure 54: Western Europe Market Y-o-Y Growth Comparison by Product Type, 2025 to 2035
  • Figure 55: Western Europe Market Attractiveness Analysis by Product Type
  • Figure 56: Western Europe Market Value Share and BPS Analysis by Material Type, 2025 and 2035
  • Figure 57: Western Europe Market Y-o-Y Growth Comparison by Material Type, 2025 to 2035
  • Figure 58: Western Europe Market Attractiveness Analysis by Material Type
  • Figure 59: Western Europe Market Value Share and BPS Analysis by End Use, 2025 and 2035
  • Figure 60: Western Europe Market Y-o-Y Growth Comparison by End Use, 2025 to 2035
  • Figure 61: Western Europe Market Attractiveness Analysis by End Use
  • Figure 62: Western Europe Market Value Share and BPS Analysis by Sales Channel, 2025 and 2035
  • Figure 63: Western Europe Market Y-o-Y Growth Comparison by Sales Channel, 2025 to 2035
  • Figure 64: Western Europe Market Attractiveness Analysis by Sales Channel
  • Figure 65: Eastern Europe Market Value Share and BPS Analysis by Country, 2025 and 2035
  • Figure 66: Eastern Europe Market Value Share and BPS Analysis by Product Type, 2025 and 2035
  • Figure 67: Eastern Europe Market Y-o-Y Growth Comparison by Product Type, 2025 to 2035
  • Figure 68: Eastern Europe Market Attractiveness Analysis by Product Type
  • Figure 69: Eastern Europe Market Value Share and BPS Analysis by Material Type, 2025 and 2035
  • Figure 70: Eastern Europe Market Y-o-Y Growth Comparison by Material Type, 2025 to 2035
  • Figure 71: Eastern Europe Market Attractiveness Analysis by Material Type
  • Figure 72: Eastern Europe Market Value Share and BPS Analysis by End Use, 2025 and 2035
  • Figure 73: Eastern Europe Market Y-o-Y Growth Comparison by End Use, 2025 to 2035
  • Figure 74: Eastern Europe Market Attractiveness Analysis by End Use
  • Figure 75: Eastern Europe Market Value Share and BPS Analysis by Sales Channel, 2025 and 2035
  • Figure 76: Eastern Europe Market Y-o-Y Growth Comparison by Sales Channel, 2025 to 2035
  • Figure 77: Eastern Europe Market Attractiveness Analysis by Sales Channel
  • Figure 78: East Asia Market Value Share and BPS Analysis by Country, 2025 and 2035
  • Figure 79: East Asia Market Value Share and BPS Analysis by Product Type, 2025 and 2035
  • Figure 80: East Asia Market Y-o-Y Growth Comparison by Product Type, 2025 to 2035
  • Figure 81: East Asia Market Attractiveness Analysis by Product Type
  • Figure 82: East Asia Market Value Share and BPS Analysis by Material Type, 2025 and 2035
  • Figure 83: East Asia Market Y-o-Y Growth Comparison by Material Type, 2025 to 2035
  • Figure 84: East Asia Market Attractiveness Analysis by Material Type
  • Figure 85: East Asia Market Value Share and BPS Analysis by End Use, 2025 and 2035
  • Figure 86: East Asia Market Y-o-Y Growth Comparison by End Use, 2025 to 2035
  • Figure 87: East Asia Market Attractiveness Analysis by End Use
  • Figure 88: East Asia Market Value Share and BPS Analysis by Sales Channel, 2025 and 2035
  • Figure 89: East Asia Market Y-o-Y Growth Comparison by Sales Channel, 2025 to 2035
  • Figure 90: East Asia Market Attractiveness Analysis by Sales Channel
  • Figure 91: South Asia & Pacific Market Value Share and BPS Analysis by Country, 2025 and 2035
  • Figure 92: South Asia & Pacific Market Value Share and BPS Analysis by Product Type, 2025 and 2035
  • Figure 93: South Asia & Pacific Market Y-o-Y Growth Comparison by Product Type, 2025 to 2035
  • Figure 94: South Asia & Pacific Market Attractiveness Analysis by Product Type
  • Figure 95: South Asia & Pacific Market Value Share and BPS Analysis by Material Type, 2025 and 2035
  • Figure 96: South Asia & Pacific Market Y-o-Y Growth Comparison by Material Type, 2025 to 2035
  • Figure 97: South Asia & Pacific Market Attractiveness Analysis by Material Type
  • Figure 98: South Asia & Pacific Market Value Share and BPS Analysis by End Use, 2025 and 2035
  • Figure 99: South Asia & Pacific Market Y-o-Y Growth Comparison by End Use, 2025 to 2035
  • Figure 100: South Asia & Pacific Market Attractiveness Analysis by End Use
  • Figure 101: South Asia & Pacific Market Value Share and BPS Analysis by Sales Channel, 2025 and 2035
  • Figure 102: South Asia & Pacific Market Y-o-Y Growth Comparison by Sales Channel, 2025 to 2035
  • Figure 103: South Asia & Pacific Market Attractiveness Analysis by Sales Channel
  • Figure 104: Middle East and Africa Market Value Share and BPS Analysis by Country, 2025 and 2035
  • Figure 105: Middle East and Africa Market Value Share and BPS Analysis by Product Type, 2025 and 2035
  • Figure 106: Middle East and Africa Market Y-o-Y Growth Comparison by Product Type, 2025 to 2035
  • Figure 107: Middle East and Africa Market Attractiveness Analysis by Product Type
  • Figure 108: Middle East and Africa Market Value Share and BPS Analysis by Material Type, 2025 and 2035
  • Figure 109: Middle East and Africa Market Y-o-Y Growth Comparison by Material Type, 2025 to 2035
  • Figure 110: Middle East and Africa Market Attractiveness Analysis by Material Type
  • Figure 111: Middle East and Africa Market Value Share and BPS Analysis by End Use, 2025 and 2035
  • Figure 112: Middle East and Africa Market Y-o-Y Growth Comparison by End Use, 2025 to 2035
  • Figure 113: Middle East and Africa Market Attractiveness Analysis by End Use
  • Figure 114: Middle East and Africa Market Value Share and BPS Analysis by Sales Channel, 2025 and 2035
  • Figure 115: Middle East and Africa Market Y-o-Y Growth Comparison by Sales Channel, 2025 to 2035
  • Figure 116: Middle East and Africa Market Attractiveness Analysis by Sales Channel
  • Figure 117: Global Market - Tier Structure Analysis
  • Figure 118: Global Market - Company Share Analysis

Frequently Asked Questions

What is the projected size of the global auto glass moldings market by 2035?

The global market is expected to reach USD 5.8 billion by 2035.

What is the estimated market size of the global auto glass moldings market in 2025?

The market size is projected to be USD 3.8 billion in 2025.

What is the CAGR of the auto glass moldings market from 2025 to 2035?

The market is forecast to grow at a CAGR of 4.4% during the period from 2025 to 2035.

Which product type segment leads the auto glass moldings market in 2025?

Windshield moldings are expected to lead the product width segment with a 38% market share in 2025.

Which country is expected to record the highest CAGR in the auto glass moldings market from 2025 to 2035?

India is expected to grow at the highest CAGR of 6.0% during the forecast period.

Explore Similar Insights

Future Market Insights

Auto Glass Moldings Market