
- Market Size (2026)
- USD 580.3 Mn
- Forecast (2036)
- USD 884.1 Mn
- CAGR (2026 to 2036)
- 4.3%
How big is Hydrapulper Market in 2026?
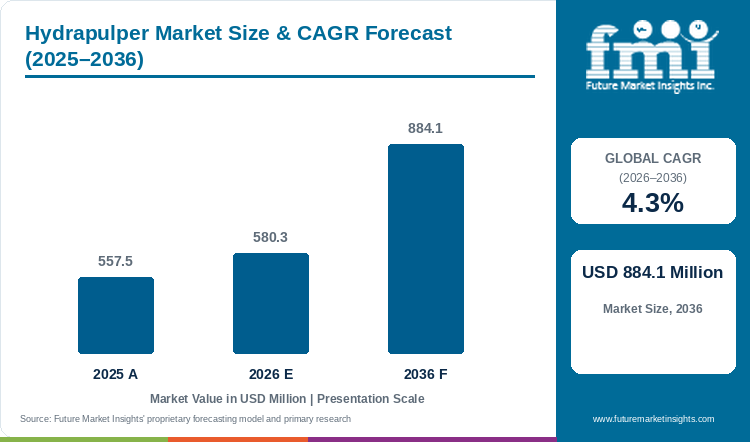
The hydrapulper market evolved from a 2025 valuation of USD 557.5 million to USD 580.3 million in 2026, and is set to achieve USD 884.1 million by 2036, reflecting a 4.3% CAGR.
Containerboard and boxboard mills are replacing older high-wear pulper tubs with low-shear detrashing hydrapulpers because e-commerce waste bales contain heavy plastic tape and wet-strength glue loads. The global hydrapulper market was valued at USD 557.5 million in 2025 and is estimated to reach USD 580.3 million in 2026. Industry valuation is projected to reach USD 884.1 million by 2036, expanding at a compound annual growth rate (CAGR) of 4.3% between 2026 and 2036. Evidence synthesized by FMI indicates that batch hydrapulper systems capture 70.4% of 2026 operation mode demand because multi-ply board mills weigh separate charges of old corrugated containers and virgin kraft pulp for each board layer. In July 2026, DS Smith started up an ANDRITZ stock preparation and reject-handling line rated at 1,650 tons per day for recycled packaging papers at its Porcari mill in Italy [1]. Equipment builders are also winning greenfield mill orders, with General Emballage selecting ANDRITZ in April 2026 to supply a 350,000-ton-per-year containerboard line in Algeria [2]. Rapid rotor wear from bale sand and multi-year mill capital budget cycles remain the primary restraints moderating new equipment orders through 2036.
Key Market Trends & Insights
- By operation mode: Batch Hydrapulper Systems hold an estimated 70.4% share in 2026 because discrete charge cycles provide exact recipe control for virgin market pulp and specialty broke.
- By rotor position and geometry: Vertical V-Type Hydrapulper units represent 74.1% in 2026 as bottom-mounted Vokes and helico rotors generate strong downward vortex draw across standard mill bays.
- By pulp consistency: Low Consistency 3% to 6% systems account for 39.2% in 2026 because continuous ragger and junk-trap detrashing loops require pumpable slurry dilution.
- By raw furnish: Recycled Corrugated Waste OCC secures 43.0% in 2026 owing to e-commerce shipping box recovery and testliner mill stock-preparation upgrades.
- By end-use mill application: Containerboard and Corrugated Packaging Mills command 48.5% in 2026 through high-tonnage linerboard and fluting repulping lines.
Regional Highlights
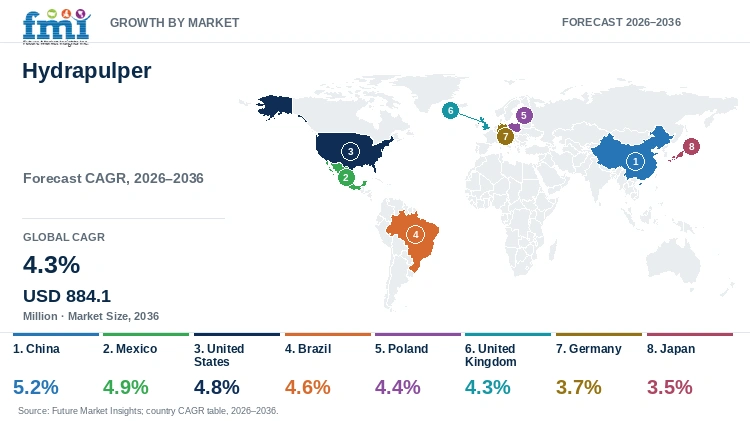
- Top national expansion: China leads national growth projections at a 5.2% CAGR through 2036 under large-scale folding boxboard and recycled containerboard mill modernizations.
- Broader country progression: Mexico tracks at a 4.9% CAGR ahead of the United States at 4.8% and Brazil at 4.6%, whereas Japan advances at a 3.5% CAGR.
Market Size & Forecast
Table 1: Market Size and Forecast for the Hydrapulper Market (USD million and CAGR percentage), 2025 to 2036
| Metric | Value |
|---|---|
| 2025 Market Size | USD 557.5 million |
| Estimated Market Size in 2026 | USD 580.3 million |
| Projected Market Size by 2036 | USD 884.1 million |
| CAGR, 2026 to 2036 | 4.3% |
| Added Value, 2026 to 2036 | USD 303.8 million |
Recycled containerboard and tissue mills lose valuable production hours when conventional pulper rotors chop plastic mailers and shipping labels into fine sticky fragments that blind downstream screens. Commercial running the pulper at controlled consistency allows fiber-to-fiber rubbing to lift ink and plastic film off the paper fibers intact so detrashing drums can reject them cleanly. Per a January 2026 recycling study in Waste Management, slushing printed and coated wastepaper at 10% consistency for 20 to 60 minutes cut pulp unevenness by up to 80% before flotation cleaning [3]. Mill engineers therefore pair medium-consistency hydrapulpers with paper recycling detrashing loops to lower screen maintenance downtime and boost clean fiber yield.
Installed Repulping Tonnage and Equipment Unit Sizing
Table 2: Installed Repulping Tonnage and Equipment Unit Sizing for the Hydrapulper Market (USD million and operational ranges), 2025 to 2036
| Metric | 2025 | 2026 | 2036 |
|---|---|---|---|
| Market size (USD million) | 557.5 | 580.3 | 884.1 |
| Annual new and rebuild hydrapulper deliveries (units) | 1,120 to 1,260 | 1,165 to 1,310 | 1,720 to 1,940 |
| Repulped fiber processed on new lines (million metric tons/year) | 58.0 to 64.5 | 60.5 to 67.2 | 92.0 to 102.5 |
| Average OEM system realization per unit (USD thousand) | 442.5 to 497.8 | 443.0 to 498.1 | 455.7 to 514.0 |
Operational note: Equipment unit ranges combine complete greenfield D-shape and vertical tub hydrapulper installations (USD 650K to USD 1.8M) with replacement rotor, extraction plate, and detrashing rebuild packages (USD 180K to USD 380K).
Commercial packaging mills slushing 800 to 1,650 tons per day of post-consumer supermarket and fulfillment waste need continuous hydrapulpers fitted with automatic ragger wire winches and heavy junk traps. In August 2026, ANDRITZ confirmed that Xuong Giang Paper started up a new stock preparation and pulping line for packaging and tissue paper in Vietnam [4]. Producers of recycled paper packaging routinely order tungsten-carbide coated rotor vanes and conically drilled extraction plates so continuous pulpers run more than 12 months between rebuilds.
Per Capita & Paper Mill Capital Indicators
Table 3: Per Capita and Paper Mill Capital Indicators for the Hydrapulper Market (USD), 2025 to 2036
| Metric | 2025 | 2026 | 2036 |
|---|---|---|---|
| World population (billion) | 8.2 | 8.3 | 9.0 |
| Market value per 1,000 people (USD) | 68.0 | 69.9 | 98.2 |
| Annual hydrapulper capex and wear-part outlay per active paper mill (USD thousand) | 148.0 to 168.0 | 154.0 to 175.0 | 232.0 to 264.0 |
| Energy-saving D-type and eccentric-vortex rotor share (%) | 52.0% to 56.0% | 54.0% to 58.0% | 69.0% to 74.0% |
Table 4: Mill Fleet & Segment Indicators for the Hydrapulper Market (USD and percentages), 2026
| Metric | Value | Institutional Reference Basis |
|---|---|---|
| Market size, 2026 | USD 580.3 million | 2026 global valuation baseline |
| Active pulp, paper, board & molded-fiber mills global | 3,550 mills | Commercial virgin, OCC & deinking mill sites |
| Market value per active mill site | USD 163,464.8 | Annualized new equipment & rotor rebuild outlay |
| Batch Hydrapulper Systems segment value, 2026 | USD 408.5 million | 70.4% operation mode allocation |
High industrial electricity prices are pushing pulp and board mills to cut power consumption in the stock-preparation hall by combining energy-saving rotor geometries with enzyme-assisted bale softening. Per a June 2025 study in Polymers, treating bleached kraft pulp with cellulase enzymes before mechanical processing reduced refining power demand by up to 50% while raising finished sheet strength [5]. Manufacturers of wet-molded fibre and specialty cartonboard are installing heated batch hydrapulpers with automated enzyme dosing to shorten batch slushing times and lower utility costs.
Analyst Perspective
"Paper mill engineers no longer evaluate hydrapulpers solely on tub volume; they judge pulping systems on kilowatt-hours consumed per ton of deflaked fiber and how cleanly the detrashing loop rejects plastic tape without losing good cellulose. Equipment suppliers that bundle eccentric D-shape tubs, wear-resistant rotors, and automated reject compactors will capture the lion's share of mill rebuild budgets through 2036."
- Nandini Roy Choudhury, Principal Consultant, Future Market Insights.
How is the hydrapulper market segmented?
The hydrapulper market is segmented by operation mode and rotor position and geometry, pulp consistency, raw furnish and end-use mill application. In 2026, Batch Hydrapulper Systems are projected at 70.4% and Vertical V-Type Hydrapulper at 74.1% and Low Consistency 3% to 6% at 39.2%, Recycled Corrugated Waste OCC at 43.0% and Containerboard and Corrugated Packaging Mills at 48.5%.
By operation mode: Batch Hydrapulper Systems and Continuous Hydrapulper Lines.
By rotor position and geometry: Vertical V-Type Hydrapulper and Horizontal D-Type Pulper.
By pulp consistency: Low Consistency 3% to 6%, Medium Consistency 6% to 12%, and High Consistency 12% to 18%.
By raw furnish: Recycled Corrugated Waste OCC, Deinking Sorted Graphic Paper, and Virgin Wood Pulp Bales.
By end-use mill application: Containerboard and Corrugated Packaging Mills, Folding Boxboard and Cartonboard Mills, Tissue and Hygiene Paper Mills and Molded Fiber and Specialty Pulp Plants.
Why do Batch Hydrapulper Systems lead the operation mode category?
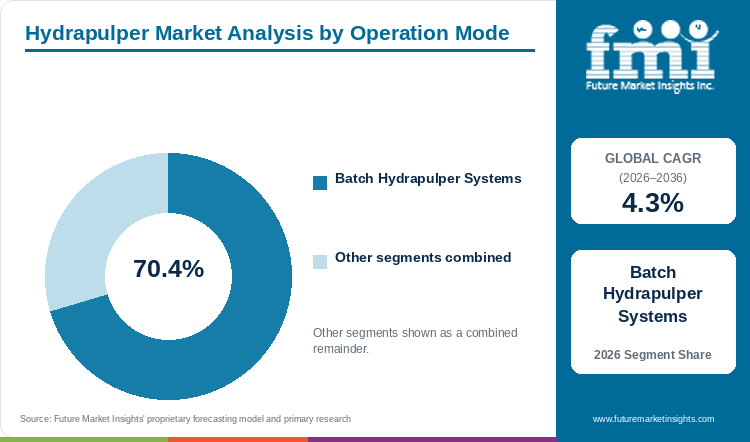
Batch Hydrapulper Systems hold an estimated 70.4% of operation mode demand in 2026, anchored by recipe flexibility across multi-ply board, tissue, and molded-fiber mills.
Table 5: Operation Mode Share for the Hydrapulper Market (percentage share), 2026
| Operation Mode | Share (2026) |
|---|---|
| Batch Hydrapulper Systems | 70.4% |
| Continuous Hydrapulper Lines | 29.6% |
| Total | 100.0% |
*Note: Operation mode shares reflect global 2026 revenue allocations across batch slushing tubs and continuous stock-preparation pulpers.
Table 6: Operation Mode Leadership and Market Growth for the Hydrapulper Market (segment and CAGR percentage), 2026 to 2036
| Metric | Value |
|---|---|
| Global CAGR (2026 to 2036) | 4.3% |
| Leading Segment | Batch Hydrapulper Systems |
Multi-ply folding boxboard and tissue and specialty paper machines require separate top-liner, filler-ply and back-liner stock chests fed with exact ratios of bleached hardwood, softwood and broke. Batch hydrapulper systems allow operators to weigh exact bale charges on load cells, adjust dwell time for wet-strength broke, and dump a fully deflaked batch before switching grades. Commercial packaging producers installing pulp moulding machines also rely on batch hydrapulpers to prepare exact slurry recipes for thermoformed foodservice trays.
- Batch Hydrapulper Systems hold 70.4% of operation mode value in 2026 because discrete charge cycles prevent cross-grade contamination across multi-ply board mills.
- In November 2025, ANDRITZ commissioned pulping and stock preparation systems at Genera in Vonore and Tennessee, to supply non-wood pulp to thermoformed molded-fiber packaging lines [6].
What sustains Vertical V-Type Hydrapulper leadership in the rotor position and geometry segment?
Vertical V-Type Hydrapulper units represent 74.1% of the rotor position and geometry category in 2026, supported by 360-degree vortex circulation and compact basement installation.
Vertical cylindrical and D-shaped tubs fitted with a bottom-mounted vertical-axis rotor draw floating pulp bales downward into the high-shear deflaking zone between the rotor vanes and the perforated extraction bedplate. Unlike horizontal side-entry pulpers that are mainly confined to under-machine broke pits with low ceiling clearance, vertical hydrapulpers handle main-line bale slushing across virgin and recycled stock preparation halls. Mills supplying moulded fibre pulp packaging favor vertical D-tub geometries because the flat wall breaks up surface vortex rotation and submerges buoyant bales 30% faster.
- Vertical V-Type Hydrapulper units represent 74.1% of rotor position and geometry demand in 2026 as bottom-mounted rotors submerge whole pulp bales rapidly.
- In January 2025, ANDRITZ secured an order from Sun Paper in Nanning and China and to supply two stock preparation lines, under-machine pulpers and broke systems for PM11 and PM12 [7].
How does Low Consistency 3% to 6% lead the pulp consistency category?
Low Consistency 3% to 6% systems account for 39.2% of pulp consistency volume in 2026, driven by continuous OCC slushing and centrifugal trash separation.
Wet slushing of post-consumer corrugated bales at 3.5% to 5.5% dry-solids consistency creates a free-flowing hydraulic vortex that allows heavy metal staples and stones to settle into the junk trap while spinning baling wire onto a continuous ragger rope. Whereas high-consistency 15% helical pulpers require batch dumping and auxiliary dilution towers, low-consistency hydrapulpers pump accepted stock directly through screen plates to high-density cleaners. Containerboard plants manufacturing corrugated board packaging pair low-consistency tubs with secondary detrashing drums to maximize daily throughput.
- Low Consistency 3% to 6% systems account for 39.2% of pulp consistency demand in 2026 because high-tonnage OCC lines require continuous pumping and ragger extraction.
- In February 2026, ANDRITZ completed the start-up of a high-capacity OCC stock preparation and reject line at Indah Kiat Pulp and Paper in Indonesia [8].
Why does Recycled Corrugated Waste OCC lead the raw furnish category?
Recycled Corrugated Waste OCC secures 43.0% of raw furnish value in 2026, supported by global e-commerce box recovery and containerboard mill capacity additions.
Old corrugated containers represent the largest single fiber stream in the global paper industry, supplying testliner, corrugated medium and unbleached boxboard machines. Because post-consumer OCC bales contain 5% to 12% non-fiber contaminants including plastic strapping, hot-melt glue and polystyrene foam, mills must invest in heavy-duty hydrapulpers with continuous purge loops. Mills producing pulp liner grades also blend repulped OCC with virgin kraft to balance burst strength against raw material cost.
- Recycled Corrugated Waste OCC secures 43.0% of raw furnish demand in 2026 as containerboard mills expand secondary fiber repulping capacity.
- In February 2025, circular economy researchers publishing in Heliyon modeled nonlinear multi-objective old corrugated container collection and repulping networks to cut greenhouse gas emissions [9].
What gives Containerboard and Corrugated Packaging Mills the leading position in end-use mill application?
Containerboard and Corrugated Packaging Mills command 48.5% of end-use mill application share in 2026, anchored by large-scale linerboard and fluting machine rebuilds.
Modern containerboard machines operate at web widths exceeding 7.5 meters and line speeds of 1,200 meters per minute, requiring stock preparation halls that slush more than 1,000 metric tons of fiber every 24 hours. Graphic paper mill closures across North America and Europe are frequently converted into recycled containerboard lines, requiring complete replacement of legacy virgin-pulp beaters with high-capacity OCC hydrapulpers. Specialty mills producing hemp-based packaging and agricultural-residue boards also install dedicated hydrapulpers to blend long bast fibers into recycled containerboard furnishes.
- Containerboard and Corrugated Packaging Mills command 48.5% of end-use mill application value in 2026 because newsprint-to-linerboard machine conversions require new OCC pulpers.
- In August 2026, ANDRITZ received a repeat order from Nanning Sun Paper in China to supply fiberline, recovery and approach-flow stock preparation systems for high-grade packaging paper [10].
What are the drivers, restraints, and opportunities in the hydrapulper market?
In the hydrapulper market, recycled containerboard mill conversions and molded-fiber packaging lines drive adoption whereas high electrical power draw and abrasive contaminant wear restrain margins and variable-frequency D-tub retrofits unlock energy savings.
- Driver: Global containerboard mill conversions and molded-fiber packaging plant buildouts require continuous detrashing and batch hydrapulpers.
- Restraint: Abrasive sand, glass and metal staples in post-consumer waste bales accelerate rotor vane and extraction plate wear, increasing mill maintenance downtime.
- Opportunity: Conversion of circular cylindrical pulpers with eccentric D-shape baffles, permanent-magnet synchronous drives, and enzymatic slushing skids cuts specific power use by 15% to 25%.
Growth Analysis and Future Potential: Qualitative Demand Catalysts
Higher municipal paper recovery targets and corporate plastic-replacement pledges are forcing packaging mills to process lower-grade mixed paper and wet-strength beverage cartons that demand intensive hydrodynamic deflaking. When mills attempt to slush poly-coated liquid board or cross-linked wet-strength carrier board in standard beaters, unseparated fiber flakes blind fine screen slots and reduce fiber yield. Chemical and mechanical stock-preparation programs utilizing sulfamic acid deinking and descaling protocols with high-consistency hydrapulpers restore brightness and cleanliness across recycled furnishes. In August 2026, industrial environmental researchers reporting in Processes documented that recycled packaging paper mills generate 1,000 to 2,000 milligrams per liter of suspended solids from stickies and fillers, confirming the need for efficient front-end pulper contaminant removal [11].
Risk Assessment of the Hydrapulper Market: Operational and Formulation Friction
Adhesive-induced agglomeration of micro-stickies and high specific power consumption during prolonged slushing represent the primary operational challenges confronting hydrapulper operators. Excessive rotor tip speed in the pulper tub fragments pressure-sensitive shipping labels and hot-melt spine glues into particles smaller than 150 microns that pass through slotted screens and deposit on paper machine wires. In January 2026, green chemistry reviewers publishing in Bioresource Technology Reports noted that conventional pulping and biomass valorization remain highly energy-intensive and require optimized mechanical-chemical interaction [12]. Mill engineers consequently cap hydrapulper residence times and offload secondary deflaking to detrashing drums and low-intensity fiberizers.
Commercial Opportunity Analysis: Formulation Differentiation and Value-Add Formats
Machinery suppliers generate high-margin aftermarket and rebuild business by offering drop-in energy-saving rotors, hardened screen plates, and turnkey recycled containerboard pulping systems. Corrugated box makers shifting toward lighter basis-weight linerboard need front-end hydrapulpers that remove plastic film and baling wire without shortening recycled cellulose fibers. In October 2025, Kadant Black Clawson and Cascades started up a lightweight recycled containerboard stock-preparation line engineered to process post-consumer corrugated waste at high yield [13]. Equipment vendors that guarantee measurable kilowatt-hour savings per ton of pulp with over 95% coarse plastic removal win repeat mill modernization contracts.
Hydrapulper Market by Country (2026 to 2036)
FMI country modeling indicates that China leads hydrapulper expansion at a 5.2% CAGR through 2036, while Japan advances at a 3.5% CAGR. Commercial adoption across Asian mega-mills, Latin American recycled containerboard plants, and European circular-packaging lines depends on recovered paper collection grades and industrial electricity costs.
Table 7: Country CAGR and Primary Growth Levers for the Hydrapulper Market (CAGR percentage and operational drivers), 2026 to 2036
| Country | CAGR (2026 to 2036) | Primary Growth Lever |
|---|---|---|
| China | 5.2% | Integrated virgin-and-OCC board machine buildouts and molded-fiber export plants |
| Mexico | 4.9% | Nearshored appliance and beverage corrugated box mill expansions in Nuevo Leon |
| United States | 4.8% | High-recovery OCC containerboard mill retrofits and graphic-to-liner conversions |
| Brazil | 4.6% | Eucalyptus kraft-to-packaging integration and 350 t/d recycled OCC line startups |
| Poland | 4.4% | Central European e-commerce testliner capacity and Schumacher/Mondi mill upgrades |
| United Kingdom | 4.3% | Domestic recycled containerboard modernization and beverage carton repulping loops |
| Germany | 3.7% | Energy-saving rotor retrofits and high-consistency deinking stock preparation |
| Japan | 3.5% | Press-section and pulper energy efficiency rebuilds across high-recovery OCC mills |
Source: Future Market Insights analysis
China Hydrapulper Market Outlook (2026 to 2036)
Demand for hydrapulpers in China is projected to expand at a leading 5.2% CAGR through 2036, driven by large folding boxboard and testliner and corrugating medium lines in Guangxi, Shandong and Anhui provinces. Commercial following national bans on unsorted foreign wastepaper imports, packaging mills in China rely on domestic post-consumer corrugated bales that require multi-stage detrashing hydrapulpers to hold sheet strength. In July 2026, ANDRITZ received a repeat order from Asian producer Minhan Paper to supply a 700-ton-per-day OCC line with a FibreSolve pulper and a 100-ton-per-day broke system [14]. Commercial ongoing capacity additions by Sun Paper and Liansheng Pulp and Paper sustain steady orders for both 1,500-ton-per-day continuous pulpers and under-machine broke tubs.
Key takeaway: In China, mega-scale packaging board machine installations and domestic OCC upgrading are projected to drive leading hydrapulper demand.
Mexico Hydrapulper Market Outlook (2026 to 2036)
Whereas Asian growth centers on integrated virgin-and-board mega-sites, Mexico scales hydrapulper procurement at a 4.9% CAGR between 2026 and 2036 to supply corrugated shipping cartons for nearshored automotive, electronics and appliance factories. Containerboard mills in Monterrey, Estado de Mexico, and Queretaro import old corrugated containers from the United States and slush them with domestic mixed waste in continuous D-type hydrapulpers. In October 2026, the USDA Foreign Agricultural Service documented how Latin American industrial and agro-processing trade corridors continue to modernize logistics and processing infrastructure [15]. Water scarcity across northern industrial parks in Mexico compels mill engineers to specify medium-consistency hydrapulpers and closed-loop white-water clarification systems that minimize freshwater draw per ton of linerboard.
Key takeaway: In Mexico, nearshored manufacturing box demand and industrial water-reuse mandates are forecast to accelerate medium-consistency hydrapulper installations.
United States Hydrapulper Market Outlook (2026 to 2036)
Unlike fiber-deficit regions, the United States benefits from an abundant domestic old corrugated container recovery rate exceeding 70%, which anchors hydrapulper valuation growth at a 4.8% CAGR through 2036. Containerboard producers and molded-fiber startups in the Southeast and Midwest are actively converting idled newsprint and uncoated freesheet mills into 100% recycled linerboard and foodservice packaging plants. In March 2026, Kadant Black Clawson demonstrated its Hydrapulper DR D-style tub with raised rotor and HydraPurge detrashing system engineered to remove up to 80% of coarse contaminants [16]. Elevated e-commerce tape and poly-mailer contamination in residential single-stream recycling bales forces mills in the United States to retrofit older circular tubs with continuous ragger and drum-purging modules.
Key takeaway: In the United States, paper-to-containerboard mill conversions and single-stream contaminant detrashing retrofits are anticipated to sustain strong hydrapulper orders.
Brazil Hydrapulper Market Outlook (2026 to 2036)
Brazil records a 4.6% CAGR from 2026 to 2036 as major pulp and paper groups integrate world-scale eucalyptus kraft pulp mills with downstream recycled corrugated and folding boxboard lines. Historically focused on exporting bleached market pulp bales, producers in Parana and Sao Paulo are now adding domestic OCC stock preparation lines to serve Latin American food and beverage exporters. In August 2026, researchers reporting in Advanced Functional Materials demonstrated that combining lignin-reinforced particles with wet-ground kraft pulp in mill beaters and pulpers substantially boosts packaging sheet tensile and burst strength [17]. Paper mills in Brazil install dual-line stock preparation halls combining vertical batch hydrapulpers for virgin eucalyptus liner plies with continuous low-consistency OCC pulpers for fluting medium.
Key takeaway: In Brazil, downstream packaging integration at eucalyptus mills and new 350-ton-per-day OCC lines are estimated to support steady hydrapulper investment.
Poland Hydrapulper Market Outlook (2026 to 2036)
Poland leads European Union growth at a 4.4% CAGR through 2036 because Central European e-commerce fulfillment centers and furniture exporters generate high demand for lightweight testliner and fluting. Paper mills along the Vistula and Oder industrial corridors have expanded recycled containerboard capacity to supply box plants in Poland and Germany, driving orders for high-capacity continuous hydrapulpers and reject compactors. In August 2025, biobased materials scientists publishing in ACS Applied Polymer Materials analyzed 100% virgin, 85/15 blend and 100% recycled kraft papers for industrial laminate and packaging applications [18]. High coal-transition electricity costs in Poland compel mill managers to prioritize variable-frequency hydrapulper drives and low-pressure-drop screen plates that cut specific slushing power.
Key takeaway: In Poland, Central European testliner mill expansions and industrial electricity cost pressures are slated to drive demand for energy-efficient hydrapulpers.
United Kingdom Hydrapulper Market Outlook (2026 to 2036)
What distinguishes the United Kingdom is its reliance on domestic wastepaper collection and dedicated liquid-packaging-board repulping mills in Wales, Kent, and North West England. Market value for hydrapulpers in the United Kingdom is projected to advance at a 4.3% CAGR between 2026 and 2036. Under national Simpler Recycling and extended producer responsibility reforms, mills in the United Kingdom are upgrading high-consistency batch and drum hydrapulpers capable of stripping polyethylene and aluminum barrier layers from post-consumer beverage cartons without losing long virgin fibers. In November 2025, ANDRITZ announced a tissue production and stock preparation order from European producer Fapajal to expand high-efficiency fiber processing [19]. Tissue and board mills in the United Kingdom favor turnkey rotor-and-bedplate rebuilds that raise slushing capacity.
Key takeaway: In the United Kingdom, beverage-carton fiber recovery and domestic tissue-and-board mill rebuilds are expected to sustain hydrapulper retrofit spending.
Germany Hydrapulper Market Outlook (2026 to 2036)
Whereas Eastern European markets add greenfield tonnage, Germany focuses hydrapulper capital expenditure on decarbonization, energy-saving rotor retrofits and closed-loop reject dewatering across Europe's largest paper-producing base. Industry valuation for hydrapulpers in Germany is forecast to progress at a 3.7% CAGR from 2026 to 2036. In October 2026, ANDRITZ reported third-quarter 2026 Pulp and Paper revenue growth of 8.8% to EUR 767.3 million, supported by European mill modernization and service upgrades [20]. Containerboard and specialty paper mills in Germany replace older cylindrical tubs with Voith IntensaPulper and ANDRITZ FibreSolve eccentric geometries that cut slushing power by up to 25%, helping mills comply with strict national industrial energy-efficiency audits.
Key takeaway: In Germany, industrial decarbonization audits and high electricity tariffs are forecast to anchor demand for eccentric low-energy hydrapulper rebuilds.
Japan Hydrapulper Market Outlook (2026 to 2036)
Unlike markets still building out wastepaper collection and Japan already operates one of the world's highest recovered paper utilization rates above 65%, resulting in a mature, replacement-driven 3.5% CAGR through 2036. Paperboard and tissue producers in Shizuoka, Ehime, and Hokkaido prioritize ultra-gentle high-consistency slushing and enzymatic deinking that preserve fiber length across multi-cycle recycled furnishes. In October 2026, Valmet documented how East Asian folding boxboard producers specialize multi-machine mill lines to reduce energy use and total operating costs [21]. Mill engineers in Japan also specify corrosion-resistant duplex stainless-steel hydrapulper tubs and precision ceramic-coated rotors to handle closed-loop white-water chemistries with minimal maintenance labor across commercial buyer accounts in Japan.
Key takeaway: In Japan, multi-cycle recycled fiber preservation and mill energy-efficiency rebuilds are predicted to sustain steady replacement demand for precision hydrapulpers.
Full report country CAGRs cover North America and Latin America with Western Europe and Eastern Europe. Additional regional coverage spans East Asia, South Asia and Pacific, and Middle East and Africa.
Who are the notable companies in the hydrapulper market?
ANDRITZ AG, Valmet Oyj, Voith GmbH & Co. KGaA and Kadant Inc., Bellmer GmbH, Parason Machinery India Pvt. Ltd. and International Paper Company, Graphic Packaging Holding Company, Stora Enso Oyj and Smurfit Westrock plc are the notable companies in the hydrapulper market.
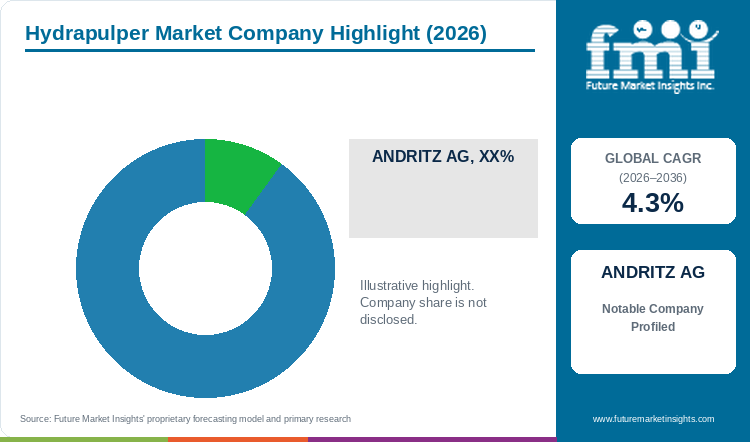
Competitive positioning in the hydrapulper industry spans full-line stock-preparation machinery OEMs, specialized pulping rotor and detrashing equipment builders, and vertically integrated paperboard mill operators that co-engineer and deploy repulping lines. ANDRITZ AG and Valmet Oyj with Voith GmbH & Co. KGaA and Kadant Inc. engineer complete batch and continuous hydrapulper tubs, rotors, raggers and reject treatment systems. Bellmer GmbH and Parason Machinery India Pvt. Ltd. supply regional pulping units, extraction bedplates and stock-preparation rebuilds, whereas International Paper Company and Graphic Packaging Holding Company with Stora Enso Oyj and Smurfit Westrock plc anchor global mill demand and closed-loop beverage-carton and OCC repulping partnerships.
- Full-Line Stock Preparation and Hydrapulper OEMs: ANDRITZ AG, Valmet Oyj, Voith GmbH & Co. KGaA, and Kadant Inc. manufacture complete vertical V-type, D-type, and drum hydrapulper systems with IIoT automation.
- Regional Pulping Equipment and Wear-Part Specialists: Bellmer GmbH and Parason Machinery India Pvt. Ltd. produce batch and continuous pulpers, tungsten-carbide rotors, and conically drilled screen plates.
- Integrated Mill Operators and Repulping Co-Investors: International Paper Company, Graphic Packaging Holding Company, Stora Enso Oyj and Smurfit Westrock plc operate large-scale OCC and barrier-board hydrapulper lines across global mill networks.
Competitive Benchmarking: Hydrapulper Market
Table 8: Competitive Benchmarking for the Hydrapulper Market (qualitative capability ratings), 2026
| Company | Pulping & Detrashing Engineering | Energy-Efficiency Rotor Design | Aftermarket Wear-Part & IIoT Support | Geographic Reach |
|---|---|---|---|---|
| ANDRITZ AG | High | High | High | Global FibreSolve, FibreFlow, and PrimeScreen stock preparation network across Europe, Asia, and Americas |
| Valmet Oyj | High | High | High | Global OptiSlush bale and OCC pulpers, 3D Fiber lines, and Valmet DNA automation |
| Voith GmbH & Co. KGaA | High | High | High | Global IntensaPulper eccentric D-tubs, IntensaDrum, and wear-resistant rotor and screen plates |
| Kadant Inc. | High | High | High | Global Kadant Black Clawson Hydrapulper DR, HydraPurge, Ragger, and Trashwell detrashing systems |
| Bellmer GmbH | Medium | High | Medium | European and international TurboPulper batch and broke pulping systems and mill rebuilds |
| Parason Machinery India Pvt. Ltd. | High | Medium | High | Asia-Pacific, Middle East, and Latin America D-type hydrapulpers and hardened rotor castings |
| International Paper Company | Medium | Medium | Medium | North American and European integrated OCC repulping and containerboard mill operations |
| Graphic Packaging Holding Company | Medium | High | Medium | North American and international coated recycled paperboard and cup-stock repulping plants |
| Stora Enso Oyj | Medium | High | Medium | European integrated pulp, barrier-board, and beverage-carton repulping mill infrastructure |
| Smurfit Westrock plc | High | High | Medium | Global 13.1-million-ton recovered fiber repulping and corrugated mill network across 40 countries |
Evaluation basis: Commercial pulping & Detrashing Engineering evaluates documented capability in continuous OCC slushing, ragger wire extraction and coarse contaminant purging, whereas Energy-Efficiency Rotor Design rates eccentric tub geometry and specific kWh/ton reductions. Aftermarket Wear-Part & IIoT Support measures replacement rotor/bedplate metallurgy and predictive bearing/gearbox telemetry.
Key Developments in the Hydrapulper Market
- ANDRITZ AG expanded its integrated virgin and recycled fiber stock preparation systems from pulping through approach flow in March 2026 [22].
- ANDRITZ AG documented more than 90 PrimeLine paper and board machine and stock-preparation deliveries and major rebuilds in April 2026 [23].
- ANDRITZ AG introduced its Mill-Wide Modernization Solutions in May 2026 to cut energy and freshwater consumption across pulp and packaging mills [24].
Key Players in the Hydrapulper Market
Full-Line Stock Preparation and Hydrapulper OEMs
- ANDRITZ AG
- Valmet Oyj
- Voith GmbH & Co. KGaA
- Kadant Inc.
Regional Pulping Equipment and Wear-Part Specialists
- Bellmer GmbH
- Parason Machinery India Pvt. Ltd.
Integrated Mill Operators and Repulping Co-Investors
- International Paper Company
- Graphic Packaging Holding Company
- Stora Enso Oyj
- Smurfit Westrock plc
Hydrapulper Market - Report Scope
Table 9: Report Scope for the Hydrapulper Market (coverage fields and definitions), 2026 to 2036
| Coverage field | Report scope |
|---|---|
| Market breakdown | Operation Mode; Rotor Position and Geometry; Pulp Consistency; Raw Furnish; End-Use Mill Application |
| Quantitative Units | USD Million |
| Market Definition | Includes commercial OEM equipment and rebuild revenue from vertical and horizontal hydrapulpers (batch tubs, continuous D-shape pulpers, under-machine broke pulpers, and integrated ragger/junk-trap detrashing modules) plus replacement pulper rotors and extraction bedplates. Category Scope Note: Excludes chemical wood-chip digesters, downstream disc/conical refiners, flotation deinking cells, and complete paper machine dry-end sections. |
| Regions Covered | North America; Latin America; Western Europe; Eastern Europe; East Asia; South Asia and Pacific; Middle East and Africa |
| Countries Covered | China, Mexico, United States, Brazil, Poland, United Kingdom, Germany, Japan, and additional countries in the full report |
| Key Companies Covered | ANDRITZ AG, Valmet Oyj, Voith GmbH & Co. KGaA, Kadant Inc., Bellmer GmbH, Parason Machinery India Pvt. Ltd., International Paper Company, Graphic Packaging Holding Company, Stora Enso Oyj, Smurfit Westrock plc |
| Forecast Period | 2026 to 2036 |
| Approach | Primary and secondary research with top-down and bottom-up market triangulation. |
Hydrapulper Market - Research Methodology
Table 10: Research Methodology for the Hydrapulper Market (research methods and approach), 2026 edition
| Method | Approach |
|---|---|
| Primary Research | Structured interviews with stock-preparation engineering directors at ANDRITZ, Valmet, Voith, and Kadant, alongside containerboard mill superintendents to validate new-unit pricing and rotor/bedplate replacement cycles. |
| Secondary Research | Analysis of corporate capital-equipment order releases from ANDRITZ and Valmet, AF&PA and CEPI recovered-paper recycling statistics, and peer-reviewed pulping rheology and deinking studies. |
| Market Sizing and Forecasting | Top-down parent pulp and paper stock-preparation machinery baselines reconciled against bottom-up annual new hydrapulper and rotor-rebuild unit deliveries (1,165 to 1,310 units in 2026) from 2026 to 2036. |
| Country Forecasting Model | Econometric country projections weight commissioned containerboard and cartonboard mill capacity, OCC recovery tonnage, and industrial energy-efficiency retrofit incentives across eight national markets. |
| Operational Benchmark Traceability | Repulped fiber tonnage and per-mill capex indicators in Tables 2, 3, and 4 trace to commercial 350 to 1,650 t/d OCC line specifications and 3% to 18% dry-solids consistency operating windows. |
| Data Triangulation and Validation | Valuation estimates isolate hydrapulper tubs, rotors, extraction plates, and primary detrashing loops while strictly excluding chemical digesters, fine pressure screens, and paper-machine headboxes. |
Hydrapulper Market by Segments
Hydrapulper Market segmented by Operation Mode:
- Batch Hydrapulper Systems
- Continuous Hydrapulper Lines
Hydrapulper Market segmented by Rotor Position and Geometry:
- Vertical V-Type Hydrapulper
- Horizontal D-Type Pulper
Hydrapulper Market segmented by Pulp Consistency:
- Low Consistency 3% to 6%
- Medium Consistency 6% to 12%
- High Consistency 12% to 18%
Hydrapulper Market segmented by Raw Furnish:
- Recycled Corrugated Waste OCC
- Sorted Deinking Sorted Graphic Paper
- Virgin Wood Pulp Bales
Hydrapulper Market segmented by End-Use Mill Application:
- Containerboard and Corrugated Packaging Mills
- Cartonboard and Folding Boxboard and Cartonboard Mills
- Tissue and Hygiene Paper Mills
- Molded Fiber and Specialty Pulp Plants
Hydrapulper Market by Region
- North America
- United States
- Canada
- Latin America
- Brazil
- Mexico
- Argentina
- Chile
- Western Europe
- Germany
- France
- United Kingdom
- Italy
- Spain
- Benelux
- Nordics
- Eastern Europe
- Poland
- Czech Republic
- Romania
- Hungary
- East Asia
- China
- Japan
- South Korea
- South Asia and Pacific
- India
- ASEAN
- Australia and New Zealand
- Middle East and Africa
- GCC Countries
- South Africa
- Türkiye
- Israel
Research Sources and Bibliography
- [1] ANDRITZ AG. (2026 July 14). DS Smith starts up ANDRITZ stock preparation line with Europe's largest FibreFlow drum pulper in Porcari, Italy. ANDRITZ Pulp & Paper Newsroom.
- [2] ANDRITZ AG. (2026 April 23). General Emballage selects ANDRITZ to supply Africa's largest containerboard paper production and stock preparation line. ANDRITZ Pulp & Paper Newsroom.
- [3] du Plooy R. et al. (2026 January 12). Applicability of paper deinking and pulping process parameters for contaminant and silver separation. Waste Management (PMC12795591).
- [4] ANDRITZ AG. (2026 August 13). Xuong Giang Paper successfully starts up ANDRITZ stock preparation and pulping line in Vietnam. ANDRITZ Pulp & Paper Newsroom.
- [5] Lin X. et al. (2025 June 19). Volvariella volvacea Processive Endoglucanase EG1 Treatment for Saving Pulp Refining Energy and Improving Paper Strength. Polymers (PMC12196967).
- [6] ANDRITZ AG. (2025 November 7). Genera starts up ANDRITZ pulping and stock preparation systems for sustainable molded fiber packaging production. ANDRITZ Pulp & Paper Newsroom.
- [7] ANDRITZ AG. (2025 January 23). ANDRITZ to supply stock preparation systems, under-machine pulpers, and seventh P-RC APMP line to Sun Paper Nanning. ANDRITZ Pulp & Paper Newsroom.
- [8] ANDRITZ AG. (2026 February 13). Indah Kiat starts up new high-capacity ANDRITZ OCC stock preparation line and reject treatment system. ANDRITZ Pulp & Paper Newsroom.
- [9] Mondal A. et al. (2025 February 27). A circular economy based nonlinear corrugated waste management and repulping optimization framework. Heliyon (PMC11868656).
- [10] ANDRITZ AG. (2026 August 26). Mill operator Nanning Sun Paper again selects ANDRITZ as supplier for pulp, recovery, and packaging paper approach-flow systems. ANDRITZ Pulp & Paper Newsroom.
- [11] Wang Y. et al. (2026 August 15). Recent Advances in Treatment and Valorization of Pulping and Papermaking Process Streams. Processes (PMC13209709).
- [12] Sajal S. et al. (2026 January 18). Green chemistry strategies in pulping and lignocellulosic biomass valorization. Bioresource Technology Reports (PMC12705535).
- [13] Kadant Inc. (2025 October 14). Kadant Black Clawson and Cascades Successfully Start Up Lightweight Recycled Containerboard Line. Kadant Corporate Newsroom.
- [14] ANDRITZ AG. (2026 July 10). Minhan Paper places repeat order with ANDRITZ for a new OCC stock preparation line. ANDRITZ Pulp and Paper Newsroom.
- [15] USDA Foreign Agricultural Service. (2026 October 23). Latin America Grain, Feed, and Agro-Industrial Processing Trade Update. U.S. Department of Agriculture GAIN Report CO2026-0027.
- [16] Kadant Inc. (2026 March 12). Hydrapulper DR and HydraPurge, Trashwell, Ragger and Washing Drum Complete OCC Detrashing System. Kadant Black Clawson Technical Engineering.
- [17] Chen L. et al. (2026 August 20). Closure of the Performance Gap: High-Strength Lignin-Reinforced Cellulose Packaging Papers from Kraft Pulp. Advanced Functional Materials (PMC13392702).
- [18] Ganser C. et al. (2025 August 8). Wettability and Fiber Characterization of Virgin and Recycled Kraft Papers with Biobased Resins. ACS Applied Polymer Materials (PMC12368696).
- [19] ANDRITZ AG. (2025 November 21). Fapajal, Portugal, orders complete tissue production and stock preparation line from ANDRITZ. ANDRITZ Pulp & Paper Newsroom.
- [20] ANDRITZ AG. (2026 October 29). ANDRITZ achieves high order intake and 8.8% Pulp and Paper revenue growth in Q3 2026. ANDRITZ Corporate Financial Releases.
- [21] Valmet Oyj. (2026 October 22). Liansheng Pulp & Paper BM 2 and East Asian Packaging Board Production Specialization and Smooth Start-Up. Valmet Packaging and Paper Insights.
- [22] ANDRITZ AG. (2026 March 15). ANDRITZ integrated virgin and recycled fiber stock preparation systems from pulping to headbox. ANDRITZ Stock Preparation Division.
- [23] ANDRITZ AG. (2026 April 10). Paper and Board Complete Line Supplier: PrimeLine and Stock Preparation Engineering. ANDRITZ Spectrum Technical Review.
- [24] ANDRITZ AG. (2026 May 5). Mill-Wide Modernization Solutions for Pulp and Packaging Paper Mills. ANDRITZ Pulp & Paper Solutions.
- [25] Voith GmbH & Co. KGaA. (2026 March 18). Intensa Pulping Technology for Intensive Mixing and Energy-Efficient Stock Preparation. Voith Paper Papermaking Systems.
- [26] ANDRITZ AG. (2026 June 12). Stock Preparation Overview: Excellent Fiber Processing for All Paper and Board Grades. ANDRITZ Pulp & Paper Engineering.
- [27] Kadant Fiber Processing. (2026 August 14). Foundations System Overview Hydrapulper DR and Hydrapurge Detrashing Systems. Kadant Knowledge Center.
- [28] Voith GmbH & Co. KGaA. (2026 March 20). Optimization Solutions for Pulping: Wear-Resistant Pulping Rotors and Screen Plates. Voith Paper Stock Preparation.
- [29] ANDRITZ AG. (2026 March 25). High-Consistency Pulping: FibreSolve FSH for Efficient Deflaking and Ink Detachment. ANDRITZ Stock Preparation.
- [30] Valmet Oyj. (2026 March 28). Valmet Bale Pulper for Cost-Efficient Batch and Continuous Repulping of Market Pulps. Valmet Bale Handling and Pulping.
This bibliography is provided for reader reference and is not exhaustive. The full report contains the complete reference list and detailed citations.
This Report Answers
- How large is the hydrapulper market in 2026 and what is forecast for 2036?
- Which e-commerce OCC contaminant and mill energy-cost pressures support demand for hydrapulpers?
- Why do Batch Hydrapulper Systems lead the operation mode category?
- Why does the Vertical V-Type Hydrapulper lead the rotor position and geometry category globally?
- How do growth rates differ across China and Mexico compared to Germany?
- Which leading companies supply turnkey hydrapulper lines versus integrated mill repulping operations?
- What limits rotor service life or causes micro-sticky screen plugging in the hydrapulper market?
- What should mill directors evaluate before retrofitting cylindrical tubs to eccentric D-shape hydrapulpers?
Table of Content
Table of Content
- Key Takeaways
- Market Size and CAGR
- Top Growth Driver
- Fastest Growing Segment
- Leading Region
- Key Companies
- Emerging Opportunities
- Executive Summary
- Global Market Outlook
- Demand-side Trends
- Supply-side Trends
- Technology Roadmap Analysis
- Analysis and Recommendations
- Analyst Perspective (What is happening? Why now? What should investors know?)
- Key Questions Answered
- How large is the market?
- What is the CAGR?
- What are key trends?
- Which region dominates?
- Who are the leaders?
Read More...
- Market Overview
- Market Coverage / Taxonomy
- Market Definition / Scope / Limitations
- Research Methodology
- Chapter Orientation
- Analytical Lens and Working Hypotheses
- Market Structure, Signals, and Trend Drivers
- Benchmarking and Cross-market Comparability
- Market Sizing, Forecasting, and Opportunity Mapping
- Research Design and Evidence Framework
- Desk Research Programme (Secondary Evidence)
- Expert Input and Fieldwork (Primary Evidence)
- Tooling, Models, and Reference Databases
- Data Engineering and Model Build
- Quality Assurance and Audit Trail
- Market Background
- Market Dynamics (Drivers, Restraints, Opportunity, Trends)
- Scenario Forecast (Optimistic, Likely, Conservative)
- Impact Analysis
- AI Impact
- Sustainability Impact
- Regulatory Impact
- Technology Impact
- Consumer / Buyer Analysis
- Purchase Drivers
- Adoption Barriers
- Buyer Journey
- Opportunity Map Analysis
- Product Life Cycle Analysis
- Supply Chain Analysis
- Investment Feasibility Matrix
- Value Chain Analysis
- PESTLE and Porter's Analysis
- Regulatory Landscape
- Regional Parent Market Outlook
- Production and Consumption Statistics
- Import and Export Statistics
- Global Market Analysis and Forecast, 2021 to 2036
- Historical Market Size Value (USD Million) Analysis, 2021 to 2025
- Current and Future Market Size Value (USD Million) Projections, 2026 to 2036
- Y-o-Y Growth Trend Analysis
- Absolute $ Opportunity Analysis
- Global Market Pricing Analysis, 2021 to 2036
- Global Market Analysis and Forecast, By Operation Mode, 2021 to 2036
- Introduction / Key Findings
- Historical Market Size Value (USD Million) Analysis By Operation Mode, 2021 to 2025
- Current and Future Market Size Value (USD Million) Analysis and Forecast By Operation Mode, 2026 to 2036
- Batch Hydrapulper Systems
- Continuous Hydrapulper Lines
- Y-o-Y Growth Trend Analysis By Operation Mode, 2021 to 2025
- Absolute $ Opportunity Analysis By Operation Mode, 2026 to 2036
- Global Market Analysis and Forecast, By Rotor Position and Geometry, 2021 to 2036
- Introduction / Key Findings
- Historical Market Size Value (USD Million) Analysis By Rotor Position and Geometry, 2021 to 2025
- Current and Future Market Size Value (USD Million) Analysis and Forecast By Rotor Position and Geometry, 2026 to 2036
- Vertical V-Type Hydrapulper
- Horizontal D-Type Pulper
- Y-o-Y Growth Trend Analysis By Rotor Position and Geometry, 2021 to 2025
- Absolute $ Opportunity Analysis By Rotor Position and Geometry, 2026 to 2036
- Global Market Analysis and Forecast, By Pulp Consistency, 2021 to 2036
- Introduction / Key Findings
- Historical Market Size Value (USD Million) Analysis By Pulp Consistency, 2021 to 2025
- Current and Future Market Size Value (USD Million) Analysis and Forecast By Pulp Consistency, 2026 to 2036
- Low Consistency 3% to 6%
- Medium Consistency 6% to 12%
- High Consistency 12% to 18%
- Y-o-Y Growth Trend Analysis By Pulp Consistency, 2021 to 2025
- Absolute $ Opportunity Analysis By Pulp Consistency, 2026 to 2036
- Global Market Analysis and Forecast, By Raw Furnish, 2021 to 2036
- Introduction / Key Findings
- Historical Market Size Value (USD Million) Analysis By Raw Furnish, 2021 to 2025
- Current and Future Market Size Value (USD Million) Analysis and Forecast By Raw Furnish, 2026 to 2036
- Recycled Corrugated Waste OCC
- Sorted Deinking Sorted Graphic Paper
- Virgin Wood Pulp Bales
- Y-o-Y Growth Trend Analysis By Raw Furnish, 2021 to 2025
- Absolute $ Opportunity Analysis By Raw Furnish, 2026 to 2036
- Global Market Analysis and Forecast, By End-Use Mill Application, 2021 to 2036
- Introduction / Key Findings
- Historical Market Size Value (USD Million) Analysis By End-Use Mill Application, 2021 to 2025
- Current and Future Market Size Value (USD Million) Analysis and Forecast By End-Use Mill Application, 2026 to 2036
- Containerboard and Corrugated Packaging Mills
- Cartonboard and Folding Boxboard and Cartonboard Mills
- Tissue and Hygiene Paper Mills
- Molded Fiber and Specialty Pulp Plants
- Y-o-Y Growth Trend Analysis By End-Use Mill Application, 2021 to 2025
- Absolute $ Opportunity Analysis By End-Use Mill Application, 2026 to 2036
- Global Market Analysis and Forecast, By Region, 2021 to 2036
- Introduction
- Historical Market Size Value (USD Million) Analysis By Region, 2021 to 2025
- Current Market Size Value (USD Million) Analysis and Forecast By Region, 2026 to 2036
- North America
- Latin America
- Western Europe
- Eastern Europe
- East Asia
- South Asia and Pacific
- Middle East and Africa
- Market Attractiveness Analysis By Region
- North America Market Analysis and Forecast, By Country, 2021 to 2036
- Historical Market Size Value (USD Million) Trend Analysis By Market Taxonomy, 2021 to 2025
- Market Size Value (USD Million) Forecast By Market Taxonomy, 2026 to 2036
- By Country
- United States
- Canada
- By Operation Mode
- By Rotor Position and Geometry
- By Pulp Consistency
- By Raw Furnish
- By End-Use Mill Application
- By Country
- Market Attractiveness Analysis
- By Country
- By Operation Mode
- By Rotor Position and Geometry
- By Pulp Consistency
- By Raw Furnish
- By End-Use Mill Application
- Key Takeaways
- Latin America Market Analysis and Forecast, By Country
- Historical Market Size Value (USD Million) Trend Analysis By Market Taxonomy, 2021 to 2025
- Market Size Value (USD Million) Forecast By Market Taxonomy, 2026 to 2036
- By Country
- Brazil
- Mexico
- Argentina
- Chile
- By Operation Mode
- By Rotor Position and Geometry
- By Pulp Consistency
- By Raw Furnish
- By End-Use Mill Application
- By Country
- Market Attractiveness Analysis
- By Country
- By Operation Mode
- By Rotor Position and Geometry
- By Pulp Consistency
- By Raw Furnish
- By End-Use Mill Application
- Key Takeaways
- Western Europe Market Analysis and Forecast, By Country
- Historical Market Size Value (USD Million) Trend Analysis By Market Taxonomy, 2021 to 2025
- Market Size Value (USD Million) Forecast By Market Taxonomy, 2026 to 2036
- By Country
- Germany
- France
- United Kingdom
- Italy
- Spain
- Benelux
- Nordics
- By Operation Mode
- By Rotor Position and Geometry
- By Pulp Consistency
- By Raw Furnish
- By End-Use Mill Application
- By Country
- Market Attractiveness Analysis
- By Country
- By Operation Mode
- By Rotor Position and Geometry
- By Pulp Consistency
- By Raw Furnish
- By End-Use Mill Application
- Key Takeaways
- Eastern Europe Market Analysis and Forecast, By Country
- Historical Market Size Value (USD Million) Trend Analysis By Market Taxonomy, 2021 to 2025
- Market Size Value (USD Million) Forecast By Market Taxonomy, 2026 to 2036
- By Country
- Poland
- Czech Republic
- Romania
- Hungary
- By Operation Mode
- By Rotor Position and Geometry
- By Pulp Consistency
- By Raw Furnish
- By End-Use Mill Application
- By Country
- Market Attractiveness Analysis
- By Country
- By Operation Mode
- By Rotor Position and Geometry
- By Pulp Consistency
- By Raw Furnish
- By End-Use Mill Application
- Key Takeaways
- East Asia Market Analysis and Forecast, By Country
- Historical Market Size Value (USD Million) Trend Analysis By Market Taxonomy, 2021 to 2025
- Market Size Value (USD Million) Forecast By Market Taxonomy, 2026 to 2036
- By Country
- China
- Japan
- South Korea
- By Operation Mode
- By Rotor Position and Geometry
- By Pulp Consistency
- By Raw Furnish
- By End-Use Mill Application
- By Country
- Market Attractiveness Analysis
- By Country
- By Operation Mode
- By Rotor Position and Geometry
- By Pulp Consistency
- By Raw Furnish
- By End-Use Mill Application
- Key Takeaways
- South Asia and Pacific Market Analysis and Forecast, By Country
- Historical Market Size Value (USD Million) Trend Analysis By Market Taxonomy, 2021 to 2025
- Market Size Value (USD Million) Forecast By Market Taxonomy, 2026 to 2036
- By Country
- India
- ASEAN
- Australia and New Zealand
- By Operation Mode
- By Rotor Position and Geometry
- By Pulp Consistency
- By Raw Furnish
- By End-Use Mill Application
- By Country
- Market Attractiveness Analysis
- By Country
- By Operation Mode
- By Rotor Position and Geometry
- By Pulp Consistency
- By Raw Furnish
- By End-Use Mill Application
- Key Takeaways
- Middle East and Africa Market Analysis and Forecast, By Country
- Historical Market Size Value (USD Million) Trend Analysis By Market Taxonomy, 2021 to 2025
- Market Size Value (USD Million) Forecast By Market Taxonomy, 2026 to 2036
- By Country
- GCC Countries
- South Africa
- Türkiye
- Israel
- By Operation Mode
- By Rotor Position and Geometry
- By Pulp Consistency
- By Raw Furnish
- By End-Use Mill Application
- By Country
- Market Attractiveness Analysis
- By Country
- By Operation Mode
- By Rotor Position and Geometry
- By Pulp Consistency
- By Raw Furnish
- By End-Use Mill Application
- Key Takeaways
- Key Countries Market Analysis
- United States
- Pricing Analysis
- Market Share Analysis, 2025
- By Operation Mode
- By Rotor Position and Geometry
- By Pulp Consistency
- By Raw Furnish
- By End-Use Mill Application
- Canada
- Pricing Analysis
- Market Share Analysis, 2025
- By Operation Mode
- By Rotor Position and Geometry
- By Pulp Consistency
- By Raw Furnish
- By End-Use Mill Application
- Mexico
- Pricing Analysis
- Market Share Analysis, 2025
- By Operation Mode
- By Rotor Position and Geometry
- By Pulp Consistency
- By Raw Furnish
- By End-Use Mill Application
- Brazil
- Pricing Analysis
- Market Share Analysis, 2025
- By Operation Mode
- By Rotor Position and Geometry
- By Pulp Consistency
- By Raw Furnish
- By End-Use Mill Application
- Chile
- Pricing Analysis
- Market Share Analysis, 2025
- By Operation Mode
- By Rotor Position and Geometry
- By Pulp Consistency
- By Raw Furnish
- By End-Use Mill Application
- Germany
- Pricing Analysis
- Market Share Analysis, 2025
- By Operation Mode
- By Rotor Position and Geometry
- By Pulp Consistency
- By Raw Furnish
- By End-Use Mill Application
- United Kingdom
- Pricing Analysis
- Market Share Analysis, 2025
- By Operation Mode
- By Rotor Position and Geometry
- By Pulp Consistency
- By Raw Furnish
- By End-Use Mill Application
- Italy
- Pricing Analysis
- Market Share Analysis, 2025
- By Operation Mode
- By Rotor Position and Geometry
- By Pulp Consistency
- By Raw Furnish
- By End-Use Mill Application
- Spain
- Pricing Analysis
- Market Share Analysis, 2025
- By Operation Mode
- By Rotor Position and Geometry
- By Pulp Consistency
- By Raw Furnish
- By End-Use Mill Application
- France
- Pricing Analysis
- Market Share Analysis, 2025
- By Operation Mode
- By Rotor Position and Geometry
- By Pulp Consistency
- By Raw Furnish
- By End-Use Mill Application
- India
- Pricing Analysis
- Market Share Analysis, 2025
- By Operation Mode
- By Rotor Position and Geometry
- By Pulp Consistency
- By Raw Furnish
- By End-Use Mill Application
- ASEAN
- Pricing Analysis
- Market Share Analysis, 2025
- By Operation Mode
- By Rotor Position and Geometry
- By Pulp Consistency
- By Raw Furnish
- By End-Use Mill Application
- Australia and New Zealand
- Pricing Analysis
- Market Share Analysis, 2025
- By Operation Mode
- By Rotor Position and Geometry
- By Pulp Consistency
- By Raw Furnish
- By End-Use Mill Application
- China
- Pricing Analysis
- Market Share Analysis, 2025
- By Operation Mode
- By Rotor Position and Geometry
- By Pulp Consistency
- By Raw Furnish
- By End-Use Mill Application
- Japan
- Pricing Analysis
- Market Share Analysis, 2025
- By Operation Mode
- By Rotor Position and Geometry
- By Pulp Consistency
- By Raw Furnish
- By End-Use Mill Application
- South Korea
- Pricing Analysis
- Market Share Analysis, 2025
- By Operation Mode
- By Rotor Position and Geometry
- By Pulp Consistency
- By Raw Furnish
- By End-Use Mill Application
- Poland
- Pricing Analysis
- Market Share Analysis, 2025
- By Operation Mode
- By Rotor Position and Geometry
- By Pulp Consistency
- By Raw Furnish
- By End-Use Mill Application
- Hungary
- Pricing Analysis
- Market Share Analysis, 2025
- By Operation Mode
- By Rotor Position and Geometry
- By Pulp Consistency
- By Raw Furnish
- By End-Use Mill Application
- Türkiye
- Pricing Analysis
- Market Share Analysis, 2025
- By Operation Mode
- By Rotor Position and Geometry
- By Pulp Consistency
- By Raw Furnish
- By End-Use Mill Application
- South Africa
- Pricing Analysis
- Market Share Analysis, 2025
- By Operation Mode
- By Rotor Position and Geometry
- By Pulp Consistency
- By Raw Furnish
- By End-Use Mill Application
- United States
- Market Structure Analysis
- Competition Dashboard
- Competition Benchmarking
- Market Share Analysis of Top Players
- By Regional
- By Operation Mode
- By Rotor Position and Geometry
- By Pulp Consistency
- By Raw Furnish
- By End-Use Mill Application
- Emerging Startups
- Innovation Benchmarking
- Competition Analysis
- Competition Deep Dive
- ANDRITZ AG
- Overview
- Product Portfolio
- Profitability by Market Segments
- Sales Footprint
- Strategy Overview
- Marketing Strategy
- Product Strategy
- Channel Strategy
- Valmet Oyj
- Voith GmbH & Co. KGaA
- Kadant Inc.
- Bellmer GmbH
- Parason Machinery India Pvt. Ltd.
- International Paper Company
- Graphic Packaging Holding Company
- Stora Enso Oyj
- Smurfit Westrock plc
- ANDRITZ AG
- Case Studies
- Success Stories
- Recent Developments
- Competition Deep Dive
- Assumptions & Acronyms Used
List of Tables
- Table 1: Global Market Value (USD Million) Forecast by Region, 2021 to 2036
- Table 2: Global Market Value (USD Million) Forecast by Operation Mode, 2021 to 2036
- Table 3: Global Market Value (USD Million) Forecast by Rotor Position and Geometry, 2021 to 2036
- Table 4: Global Market Value (USD Million) Forecast by Pulp Consistency, 2021 to 2036
- Table 5: Global Market Value (USD Million) Forecast by Raw Furnish, 2021 to 2036
- Table 6: Global Market Value (USD Million) Forecast by End-Use Mill Application, 2021 to 2036
- Table 7: North America Market Value (USD Million) Forecast by Country, 2021 to 2036
- Table 8: North America Market Value (USD Million) Forecast by Operation Mode, 2021 to 2036
- Table 9: North America Market Value (USD Million) Forecast by Rotor Position and Geometry, 2021 to 2036
- Table 10: North America Market Value (USD Million) Forecast by Pulp Consistency, 2021 to 2036
- Table 11: North America Market Value (USD Million) Forecast by Raw Furnish, 2021 to 2036
- Table 12: North America Market Value (USD Million) Forecast by End-Use Mill Application, 2021 to 2036
- Table 13: Latin America Market Value (USD Million) Forecast by Country, 2021 to 2036
- Table 14: Latin America Market Value (USD Million) Forecast by Operation Mode, 2021 to 2036
- Table 15: Latin America Market Value (USD Million) Forecast by Rotor Position and Geometry, 2021 to 2036
- Table 16: Latin America Market Value (USD Million) Forecast by Pulp Consistency, 2021 to 2036
- Table 17: Latin America Market Value (USD Million) Forecast by Raw Furnish, 2021 to 2036
- Table 18: Latin America Market Value (USD Million) Forecast by End-Use Mill Application, 2021 to 2036
- Table 19: Western Europe Market Value (USD Million) Forecast by Country, 2021 to 2036
- Table 20: Western Europe Market Value (USD Million) Forecast by Operation Mode, 2021 to 2036
- Table 21: Western Europe Market Value (USD Million) Forecast by Rotor Position and Geometry, 2021 to 2036
- Table 22: Western Europe Market Value (USD Million) Forecast by Pulp Consistency, 2021 to 2036
- Table 23: Western Europe Market Value (USD Million) Forecast by Raw Furnish, 2021 to 2036
- Table 24: Western Europe Market Value (USD Million) Forecast by End-Use Mill Application, 2021 to 2036
- Table 25: Eastern Europe Market Value (USD Million) Forecast by Country, 2021 to 2036
- Table 26: Eastern Europe Market Value (USD Million) Forecast by Operation Mode, 2021 to 2036
- Table 27: Eastern Europe Market Value (USD Million) Forecast by Rotor Position and Geometry, 2021 to 2036
- Table 28: Eastern Europe Market Value (USD Million) Forecast by Pulp Consistency, 2021 to 2036
- Table 29: Eastern Europe Market Value (USD Million) Forecast by Raw Furnish, 2021 to 2036
- Table 30: Eastern Europe Market Value (USD Million) Forecast by End-Use Mill Application, 2021 to 2036
- Table 31: East Asia Market Value (USD Million) Forecast by Country, 2021 to 2036
- Table 32: East Asia Market Value (USD Million) Forecast by Operation Mode, 2021 to 2036
- Table 33: East Asia Market Value (USD Million) Forecast by Rotor Position and Geometry, 2021 to 2036
- Table 34: East Asia Market Value (USD Million) Forecast by Pulp Consistency, 2021 to 2036
- Table 35: East Asia Market Value (USD Million) Forecast by Raw Furnish, 2021 to 2036
- Table 36: East Asia Market Value (USD Million) Forecast by End-Use Mill Application, 2021 to 2036
- Table 37: South Asia and Pacific Market Value (USD Million) Forecast by Country, 2021 to 2036
- Table 38: South Asia and Pacific Market Value (USD Million) Forecast by Operation Mode, 2021 to 2036
- Table 39: South Asia and Pacific Market Value (USD Million) Forecast by Rotor Position and Geometry, 2021 to 2036
- Table 40: South Asia and Pacific Market Value (USD Million) Forecast by Pulp Consistency, 2021 to 2036
- Table 41: South Asia and Pacific Market Value (USD Million) Forecast by Raw Furnish, 2021 to 2036
- Table 42: South Asia and Pacific Market Value (USD Million) Forecast by End-Use Mill Application, 2021 to 2036
- Table 43: Middle East and Africa Market Value (USD Million) Forecast by Country, 2021 to 2036
- Table 44: Middle East and Africa Market Value (USD Million) Forecast by Operation Mode, 2021 to 2036
- Table 45: Middle East and Africa Market Value (USD Million) Forecast by Rotor Position and Geometry, 2021 to 2036
- Table 46: Middle East and Africa Market Value (USD Million) Forecast by Pulp Consistency, 2021 to 2036
- Table 47: Middle East and Africa Market Value (USD Million) Forecast by Raw Furnish, 2021 to 2036
- Table 48: Middle East and Africa Market Value (USD Million) Forecast by End-Use Mill Application, 2021 to 2036
List of Figures
- Figure 1: Global Market Pricing Analysis
- Figure 2: Global Market Value (USD Million) Forecast 2021-2036
- Figure 3: Global Market Value Share and BPS Analysis by Operation Mode, 2026 and 2036
- Figure 4: Global Market Y-o-Y Growth Comparison by Operation Mode, 2026-2036
- Figure 5: Global Market Attractiveness Analysis by Operation Mode
- Figure 6: Global Market Value Share and BPS Analysis by Rotor Position and Geometry, 2026 and 2036
- Figure 7: Global Market Y-o-Y Growth Comparison by Rotor Position and Geometry, 2026-2036
- Figure 8: Global Market Attractiveness Analysis by Rotor Position and Geometry
- Figure 9: Global Market Value Share and BPS Analysis by Pulp Consistency, 2026 and 2036
- Figure 10: Global Market Y-o-Y Growth Comparison by Pulp Consistency, 2026-2036
- Figure 11: Global Market Attractiveness Analysis by Pulp Consistency
- Figure 12: Global Market Value Share and BPS Analysis by Raw Furnish, 2026 and 2036
- Figure 13: Global Market Y-o-Y Growth Comparison by Raw Furnish, 2026-2036
- Figure 14: Global Market Attractiveness Analysis by Raw Furnish
- Figure 15: Global Market Value Share and BPS Analysis by End-Use Mill Application, 2026 and 2036
- Figure 16: Global Market Y-o-Y Growth Comparison by End-Use Mill Application, 2026-2036
- Figure 17: Global Market Attractiveness Analysis by End-Use Mill Application
- Figure 18: Global Market Value (USD Million) Share and BPS Analysis by Region, 2026 and 2036
- Figure 19: Global Market Y-o-Y Growth Comparison by Region, 2026-2036
- Figure 20: Global Market Attractiveness Analysis by Region
- Figure 21: North America Market Incremental Dollar Opportunity, 2026-2036
- Figure 22: Latin America Market Incremental Dollar Opportunity, 2026-2036
- Figure 23: Western Europe Market Incremental Dollar Opportunity, 2026-2036
- Figure 24: Eastern Europe Market Incremental Dollar Opportunity, 2026-2036
- Figure 25: East Asia Market Incremental Dollar Opportunity, 2026-2036
- Figure 26: South Asia and Pacific Market Incremental Dollar Opportunity, 2026-2036
- Figure 27: Middle East and Africa Market Incremental Dollar Opportunity, 2026-2036
- Figure 28: North America Market Value Share and BPS Analysis by Country, 2026 and 2036
- Figure 29: North America Market Value Share and BPS Analysis by Operation Mode, 2026 and 2036
- Figure 30: North America Market Y-o-Y Growth Comparison by Operation Mode, 2026-2036
- Figure 31: North America Market Attractiveness Analysis by Operation Mode
- Figure 32: North America Market Value Share and BPS Analysis by Rotor Position and Geometry, 2026 and 2036
- Figure 33: North America Market Y-o-Y Growth Comparison by Rotor Position and Geometry, 2026-2036
- Figure 34: North America Market Attractiveness Analysis by Rotor Position and Geometry
- Figure 35: North America Market Value Share and BPS Analysis by Pulp Consistency, 2026 and 2036
- Figure 36: North America Market Y-o-Y Growth Comparison by Pulp Consistency, 2026-2036
- Figure 37: North America Market Attractiveness Analysis by Pulp Consistency
- Figure 38: North America Market Value Share and BPS Analysis by Raw Furnish, 2026 and 2036
- Figure 39: North America Market Y-o-Y Growth Comparison by Raw Furnish, 2026-2036
- Figure 40: North America Market Attractiveness Analysis by Raw Furnish
- Figure 41: North America Market Value Share and BPS Analysis by End-Use Mill Application, 2026 and 2036
- Figure 42: North America Market Y-o-Y Growth Comparison by End-Use Mill Application, 2026-2036
- Figure 43: North America Market Attractiveness Analysis by End-Use Mill Application
- Figure 44: Latin America Market Value Share and BPS Analysis by Country, 2026 and 2036
- Figure 45: Latin America Market Value Share and BPS Analysis by Operation Mode, 2026 and 2036
- Figure 46: Latin America Market Y-o-Y Growth Comparison by Operation Mode, 2026-2036
- Figure 47: Latin America Market Attractiveness Analysis by Operation Mode
- Figure 48: Latin America Market Value Share and BPS Analysis by Rotor Position and Geometry, 2026 and 2036
- Figure 49: Latin America Market Y-o-Y Growth Comparison by Rotor Position and Geometry, 2026-2036
- Figure 50: Latin America Market Attractiveness Analysis by Rotor Position and Geometry
- Figure 51: Latin America Market Value Share and BPS Analysis by Pulp Consistency, 2026 and 2036
- Figure 52: Latin America Market Y-o-Y Growth Comparison by Pulp Consistency, 2026-2036
- Figure 53: Latin America Market Attractiveness Analysis by Pulp Consistency
- Figure 54: Latin America Market Value Share and BPS Analysis by Raw Furnish, 2026 and 2036
- Figure 55: Latin America Market Y-o-Y Growth Comparison by Raw Furnish, 2026-2036
- Figure 56: Latin America Market Attractiveness Analysis by Raw Furnish
- Figure 57: Latin America Market Value Share and BPS Analysis by End-Use Mill Application, 2026 and 2036
- Figure 58: Latin America Market Y-o-Y Growth Comparison by End-Use Mill Application, 2026-2036
- Figure 59: Latin America Market Attractiveness Analysis by End-Use Mill Application
- Figure 60: Western Europe Market Value Share and BPS Analysis by Country, 2026 and 2036
- Figure 61: Western Europe Market Value Share and BPS Analysis by Operation Mode, 2026 and 2036
- Figure 62: Western Europe Market Y-o-Y Growth Comparison by Operation Mode, 2026-2036
- Figure 63: Western Europe Market Attractiveness Analysis by Operation Mode
- Figure 64: Western Europe Market Value Share and BPS Analysis by Rotor Position and Geometry, 2026 and 2036
- Figure 65: Western Europe Market Y-o-Y Growth Comparison by Rotor Position and Geometry, 2026-2036
- Figure 66: Western Europe Market Attractiveness Analysis by Rotor Position and Geometry
- Figure 67: Western Europe Market Value Share and BPS Analysis by Pulp Consistency, 2026 and 2036
- Figure 68: Western Europe Market Y-o-Y Growth Comparison by Pulp Consistency, 2026-2036
- Figure 69: Western Europe Market Attractiveness Analysis by Pulp Consistency
- Figure 70: Western Europe Market Value Share and BPS Analysis by Raw Furnish, 2026 and 2036
- Figure 71: Western Europe Market Y-o-Y Growth Comparison by Raw Furnish, 2026-2036
- Figure 72: Western Europe Market Attractiveness Analysis by Raw Furnish
- Figure 73: Western Europe Market Value Share and BPS Analysis by End-Use Mill Application, 2026 and 2036
- Figure 74: Western Europe Market Y-o-Y Growth Comparison by End-Use Mill Application, 2026-2036
- Figure 75: Western Europe Market Attractiveness Analysis by End-Use Mill Application
- Figure 76: Eastern Europe Market Value Share and BPS Analysis by Country, 2026 and 2036
- Figure 77: Eastern Europe Market Value Share and BPS Analysis by Operation Mode, 2026 and 2036
- Figure 78: Eastern Europe Market Y-o-Y Growth Comparison by Operation Mode, 2026-2036
- Figure 79: Eastern Europe Market Attractiveness Analysis by Operation Mode
- Figure 80: Eastern Europe Market Value Share and BPS Analysis by Rotor Position and Geometry, 2026 and 2036
- Figure 81: Eastern Europe Market Y-o-Y Growth Comparison by Rotor Position and Geometry, 2026-2036
- Figure 82: Eastern Europe Market Attractiveness Analysis by Rotor Position and Geometry
- Figure 83: Eastern Europe Market Value Share and BPS Analysis by Pulp Consistency, 2026 and 2036
- Figure 84: Eastern Europe Market Y-o-Y Growth Comparison by Pulp Consistency, 2026-2036
- Figure 85: Eastern Europe Market Attractiveness Analysis by Pulp Consistency
- Figure 86: Eastern Europe Market Value Share and BPS Analysis by Raw Furnish, 2026 and 2036
- Figure 87: Eastern Europe Market Y-o-Y Growth Comparison by Raw Furnish, 2026-2036
- Figure 88: Eastern Europe Market Attractiveness Analysis by Raw Furnish
- Figure 89: Eastern Europe Market Value Share and BPS Analysis by End-Use Mill Application, 2026 and 2036
- Figure 90: Eastern Europe Market Y-o-Y Growth Comparison by End-Use Mill Application, 2026-2036
- Figure 91: Eastern Europe Market Attractiveness Analysis by End-Use Mill Application
- Figure 92: East Asia Market Value Share and BPS Analysis by Country, 2026 and 2036
- Figure 93: East Asia Market Value Share and BPS Analysis by Operation Mode, 2026 and 2036
- Figure 94: East Asia Market Y-o-Y Growth Comparison by Operation Mode, 2026-2036
- Figure 95: East Asia Market Attractiveness Analysis by Operation Mode
- Figure 96: East Asia Market Value Share and BPS Analysis by Rotor Position and Geometry, 2026 and 2036
- Figure 97: East Asia Market Y-o-Y Growth Comparison by Rotor Position and Geometry, 2026-2036
- Figure 98: East Asia Market Attractiveness Analysis by Rotor Position and Geometry
- Figure 99: East Asia Market Value Share and BPS Analysis by Pulp Consistency, 2026 and 2036
- Figure 100: East Asia Market Y-o-Y Growth Comparison by Pulp Consistency, 2026-2036
- Figure 101: East Asia Market Attractiveness Analysis by Pulp Consistency
- Figure 102: East Asia Market Value Share and BPS Analysis by Raw Furnish, 2026 and 2036
- Figure 103: East Asia Market Y-o-Y Growth Comparison by Raw Furnish, 2026-2036
- Figure 104: East Asia Market Attractiveness Analysis by Raw Furnish
- Figure 105: East Asia Market Value Share and BPS Analysis by End-Use Mill Application, 2026 and 2036
- Figure 106: East Asia Market Y-o-Y Growth Comparison by End-Use Mill Application, 2026-2036
- Figure 107: East Asia Market Attractiveness Analysis by End-Use Mill Application
- Figure 108: South Asia and Pacific Market Value Share and BPS Analysis by Country, 2026 and 2036
- Figure 109: South Asia and Pacific Market Value Share and BPS Analysis by Operation Mode, 2026 and 2036
- Figure 110: South Asia and Pacific Market Y-o-Y Growth Comparison by Operation Mode, 2026-2036
- Figure 111: South Asia and Pacific Market Attractiveness Analysis by Operation Mode
- Figure 112: South Asia and Pacific Market Value Share and BPS Analysis by Rotor Position and Geometry, 2026 and 2036
- Figure 113: South Asia and Pacific Market Y-o-Y Growth Comparison by Rotor Position and Geometry, 2026-2036
- Figure 114: South Asia and Pacific Market Attractiveness Analysis by Rotor Position and Geometry
- Figure 115: South Asia and Pacific Market Value Share and BPS Analysis by Pulp Consistency, 2026 and 2036
- Figure 116: South Asia and Pacific Market Y-o-Y Growth Comparison by Pulp Consistency, 2026-2036
- Figure 117: South Asia and Pacific Market Attractiveness Analysis by Pulp Consistency
- Figure 118: South Asia and Pacific Market Value Share and BPS Analysis by Raw Furnish, 2026 and 2036
- Figure 119: South Asia and Pacific Market Y-o-Y Growth Comparison by Raw Furnish, 2026-2036
- Figure 120: South Asia and Pacific Market Attractiveness Analysis by Raw Furnish
- Figure 121: South Asia and Pacific Market Value Share and BPS Analysis by End-Use Mill Application, 2026 and 2036
- Figure 122: South Asia and Pacific Market Y-o-Y Growth Comparison by End-Use Mill Application, 2026-2036
- Figure 123: South Asia and Pacific Market Attractiveness Analysis by End-Use Mill Application
- Figure 124: Middle East and Africa Market Value Share and BPS Analysis by Country, 2026 and 2036
- Figure 125: Middle East and Africa Market Value Share and BPS Analysis by Operation Mode, 2026 and 2036
- Figure 126: Middle East and Africa Market Y-o-Y Growth Comparison by Operation Mode, 2026-2036
- Figure 127: Middle East and Africa Market Attractiveness Analysis by Operation Mode
- Figure 128: Middle East and Africa Market Value Share and BPS Analysis by Rotor Position and Geometry, 2026 and 2036
- Figure 129: Middle East and Africa Market Y-o-Y Growth Comparison by Rotor Position and Geometry, 2026-2036
- Figure 130: Middle East and Africa Market Attractiveness Analysis by Rotor Position and Geometry
- Figure 131: Middle East and Africa Market Value Share and BPS Analysis by Pulp Consistency, 2026 and 2036
- Figure 132: Middle East and Africa Market Y-o-Y Growth Comparison by Pulp Consistency, 2026-2036
- Figure 133: Middle East and Africa Market Attractiveness Analysis by Pulp Consistency
- Figure 134: Middle East and Africa Market Value Share and BPS Analysis by Raw Furnish, 2026 and 2036
- Figure 135: Middle East and Africa Market Y-o-Y Growth Comparison by Raw Furnish, 2026-2036
- Figure 136: Middle East and Africa Market Attractiveness Analysis by Raw Furnish
- Figure 137: Middle East and Africa Market Value Share and BPS Analysis by End-Use Mill Application, 2026 and 2036
- Figure 138: Middle East and Africa Market Y-o-Y Growth Comparison by End-Use Mill Application, 2026-2036
- Figure 139: Middle East and Africa Market Attractiveness Analysis by End-Use Mill Application
- Figure 140: Global Market - Tier Structure Analysis
- Figure 141: Global Market - Company Share Analysis
Frequently Asked Questions
How big is the hydrapulper market in 2026, and what is forecast for 2036?
FMI estimates that the global hydrapulper market size stood at USD 557.5 million in 2025 and reached USD 580.3 million in 2026. Overall industry valuation is on track to hit USD 884.1 million by 2036 as paperboard and molded-fiber mills upgrade stock preparation lines.
What is the CAGR for the hydrapulper market from 2026 to 2036?
The hydrapulper sector is projected to expand at a 4.3% CAGR over the 2026 to 2036 window, adding USD 303.8 million across new mill installations and rotor rebuilds.
Which operation mode segment leads the hydrapulper market?
Batch Hydrapulper Systems hold 70.4% of operation mode demand in 2026 because discrete charge cycles provide exact furnish recipe control across virgin pulp and specialty board mills.
Which rotor position and geometry segment leads the hydrapulper market?
Vertical V-Type Hydrapulper designs represent 74.1% of the rotor geometry category in 2026 as bottom-mounted vortex rotors rapidly submerge and deflake whole pulp bales.
Which country has a notable growth outlook during the assessment period?
China leads national expansion projections at a 5.2% CAGR through 2036, driven by high-capacity folding boxboard machines, domestic OCC upgrading and molded-fiber plant buildouts.
Who are the key players in the market?
ANDRITZ AG, Valmet Oyj, Voith GmbH & Co. KGaA, Kadant Inc., and Bellmer GmbH lead equipment supply with Parason Machinery India Pvt. Ltd. and major mill operators International Paper Company, Graphic Packaging Holding Company, Stora Enso Oyj and Smurfit Westrock plc.
Preview the report firsthand - request a free sample
Get SampleGet the brochure for pricing and purchase details.
Get PDF
