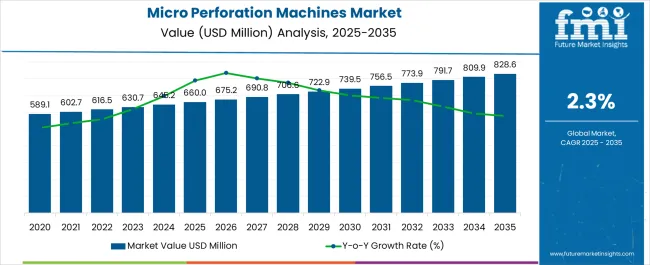
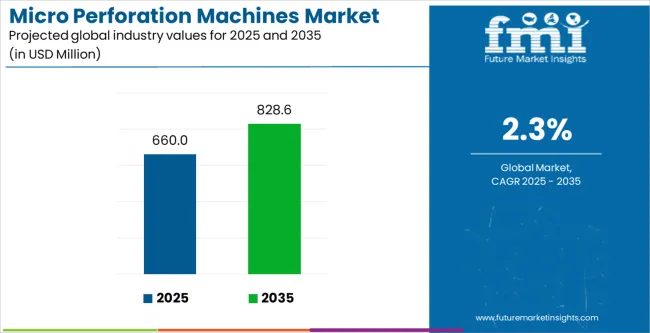
The Micro Perforation Machines Market is estimated to be valued at USD 660.0 million in 2025 and is projected to reach USD 828.6 million by 2035, registering a compound annual growth rate (CAGR) of 2.3% over the forecast period.
| Metric | Value |
|---|---|
| Micro Perforation Machines Market Estimated Value in (2025 E) | USD 660.0 million |
| Micro Perforation Machines Market Forecast Value in (2035 F) | USD 828.6 million |
| Forecast CAGR (2025 to 2035) | 2.3% |
The micro perforation machines market is experiencing consistent growth as industries increasingly prioritize packaging solutions that enhance product freshness, extend shelf life, and improve overall functionality. Rising demand for perforated packaging films in food and beverage applications, particularly in bakery, produce, and ready-to-eat categories, is propelling market adoption.
Advancements in material processing and film technology have also supported the precision and efficiency of modern perforation equipment. Additionally, manufacturers are investing in high-speed, energy-efficient machines that reduce waste and support sustainable packaging practices.
Regulatory trends emphasizing reduced plastic waste and improved food safety standards are further accelerating the uptake of these systems. The market outlook remains favorable as both large enterprises and SMEs seek to optimize packaging efficiency, minimize losses from spoilage, and strengthen consumer convenience through innovative micro perforation technologies.
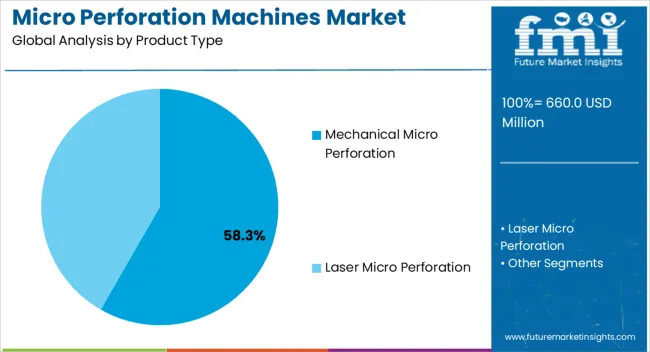
The mechanical micro perforation segment is projected to account for 58.30% of total revenue by 2025, making it the leading product type. Its dominance is attributed to its cost-effectiveness, operational simplicity, and ability to achieve uniform perforation at high production speeds.
Mechanical systems have been widely adopted across food packaging lines, as they ensure consistency and enhance the breathability of packaging films. Their compatibility with a broad range of materials and minimal maintenance requirements further strengthen their adoption.
As packaging manufacturers seek dependable and scalable solutions, mechanical micro perforation continues to stand out as the preferred choice for balancing affordability with performance.
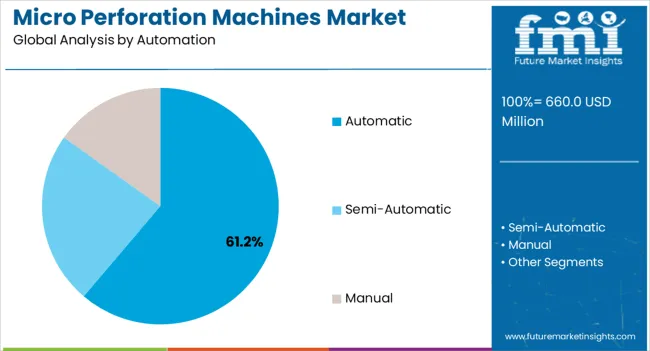
The automatic category is expected to hold 61.20% of total market revenue by 2025 within the automation segment, positioning it as the dominant mode. This growth is being driven by the increasing demand for high throughput, reduced labor dependency, and greater process precision.
Automatic systems enable continuous production with minimal downtime, improving cost efficiency and operational reliability. Enhanced integration with digital monitoring and control systems also contributes to higher product quality and consistency.
The ability of automatic machines to meet large-scale industrial requirements has solidified their leadership in the market, particularly among packaging and food processing companies aiming to optimize productivity.
The global micro perforation machines market has witnessed a significant surge in demand over the years. The increased emphasis on sustainable packaging solutions and the growing awareness of environmental concerns have driven the adoption of micro perforation machines.
These machines enable controlled ventilation and moisture release, extending the shelf life of perishable goods and reducing food waste. The versatility of micro perforation machines and their ability to cater to diverse industries such as food and beverages, pharmaceuticals, and agriculture have fuelled market demand.
The customization options offered by these machines, along with advancements in material science and packaging innovation, have further bolstered their growth. Furthermore, the integration of automation and smart technologies in micro perforation machines has enhanced productivity and operational efficiency, driving market demand.
The micro perforation machines industry is poised for significant growth in the near future, driven by various factors that promise unique opportunities for market players. Micro-perforations enable enhanced breathability, extending the shelf life of perishable goods while reducing food waste. Micro-perforations provide an optimal balance between protection and breathability, ensuring product integrity.
Additionally, advancements in technology have led to the development of high-speed, automated micro-perforated machines, capable of processing large volumes of materials with enhanced precision.
This has attracted the attention of various industries, such as food and beverage, healthcare, and agriculture, where efficient production processes are paramount. Furthermore, emerging markets, particularly in Asia-Pacific and Latin America, present untapped opportunities for micro-perforation machine manufacturers, as these regions witness rapid urbanization, increasing disposable incomes, and evolving consumer preferences.
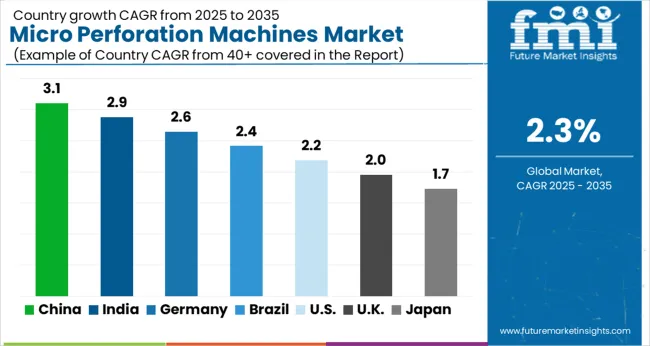
| Country | India |
|---|---|
| Market Size (USD million) by End of Forecast Period (2035) | USD 21.4 million |
| CAGR % 2025 to End of Forecast (2035) | 6.8% |
India's enthusiasm to diversify the micro perforation machines market stems from its strategic vision to bolster its manufacturing sector. India's strong agricultural sector also plays a significant role in driving the demand for micro-perforated machines. The country is one of the world's largest producers of fruits, vegetables, and grains, and there is a growing need for advanced packaging solutions to maintain the freshness and quality of these perishable products. Micro perforation machines offer an effective solution by enabling controlled airflow and moisture release, thereby extending the shelf life of agricultural produce.
Micro perforation machines enable the production of sustainable packaging solutions by incorporating eco-friendly materials and optimizing ventilation properties. As a result, Indian manufacturers are actively exploring and investing in micro perforation machines to meet the evolving consumer preferences for eco-conscious packaging. Furthermore, India's eagerness to diversify the micro-perforated machines market is driven by its commitment to promoting domestic manufacturing, leveraging its agricultural strengths, addressing sustainability concerns, and fostering innovation through research and development.
| Country | China |
|---|---|
| Market Size (USD million) by End of Forecast Period (2035) | USD 63.5 million |
| CAGR % 2025 to End of Forecast (2035) | 5.8% |
The rising emphasis on sustainable packaging solutions in China presents a significant growth driver for the micro perforation machines market. As a result, there is a growing demand for eco-friendly packaging materials and technologies. Micro perforation machines offer a sustainable packaging solution by facilitating better airflow and prolonging the shelf life of products, thereby reducing food waste.
Manufacturers in China are increasingly adopting micro perforated packaging to align with environmental goals and cater to the changing preferences of consumers. The rapid expansion of e-commerce in China has created a surge in demand for efficient and protective packaging solutions and is expected to grow significantly in China.
Mechanical micro perforation machines are renowned for their reliability, precision, and versatility. They utilize mechanical mechanisms such as rotating drums or pins to create micro-perforations in various materials. Mechanical micro perforation machines is their ability to achieve consistent and uniform perforations. The mechanical mechanisms ensure precise control over the size, shape, and density of the micro-perforations, resulting in reliable and standardized output.
This level of consistency is crucial in industries such as food and beverage, where product quality and shelf life preservation are of utmost importance. They can effectively perforate diverse substrates, including packaging films, papers, textiles, and even thin metal foils. Overall, the mechanical micro perforation machine segment dominates the micro-perforated machines market due to its reliability, precision, versatility, adaptability to various materials, robustness, cost-effectiveness, and evolving technological advancements. This segment is anticipated to hold about 60% of the market share by the end of 2025
The automotive and textile industries play a leading role in driving the micro perforation machines market due to their unique requirements and applications that rely heavily on micro-perforated materials and products. These industries leverage micro perforation machines to enhance performance, functionality, and aesthetics in their respective sectors.
Micro-perforated materials are employed in automotive interiors to improve air circulation, ventilation, and acoustic performance. They enable controlled airflow and reduce noise levels within the vehicle cabin, providing enhanced comfort for passengers. Micro perforation machine play a crucial role in producing these materials by creating precise perforations that optimize airflow and acoustic properties.
The automotive industry's demand for micro perforation machine stems from the need to meet stringent quality standards, improve passenger experience, and adhere to evolving regulations on noise reduction and comfort.
Micro-perforated fabrics offer benefits such as improved breathability, moisture management, and thermal regulation. These fabrics find applications in sportswear, active wear, outdoor clothing, and technical textiles. Micro perforation machines enable textile manufacturers to create intricate and precise perforations in fabrics, enhancing their performance characteristics.
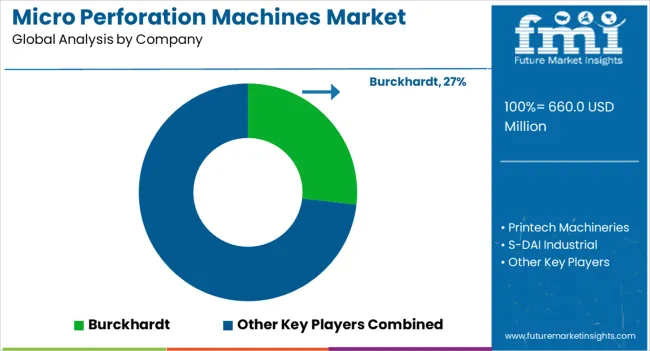
Companies strive to enhance the precision, speed, and automation capabilities of their machines, ensuring they remain at the forefront of innovation.
By incorporating cutting-edge features such as high-speed perforation, advanced controls, and sensor technology, market players can deliver superior performance and efficiency to meet the evolving needs of their customers. By offering versatile solutions, market players can cater to a wide range of industries and applications, allowing customers to achieve optimal results and address specific challenges effectively.
Key Strategies in Micro Perforation Machines Market:
Developing Innovative Product:
The automation and digitization capabilities of micro perforation machines enhancing the market. Market players invest in research and development to integrate advanced technologies such as artificial intelligence, machine learning, and robotics into their machines. This enables improved process control, higher precision, and faster production speeds. Automated systems can analyse data in real-time, optimize perforation patterns, and adjust machine settings for optimal performance, ensuring consistent and efficient operations. Innovation lies in the development of intelligent control systems for micro perforation machines. Market players integrate advanced sensors and analytics capabilities to monitor and optimize machine performance in real-time. These systems can detect and correct any deviations, prevent errors, and provide predictive maintenance insights, resulting in increased uptime and reduced downtime.
Customization:
Customization in the micro perforation machines market is the ability to accommodate different materials. To address this, they develop machines that can handle a wide range of materials, ensuring compatibility and flexibility for their customers. This customization capability enables manufacturers to select the most suitable machine for their specific material requirements, ensuring optimal perforation quality and performance.
Sustainability:
Sustainability is a growing focus in the micro perforation machines market and are incorporating sustainable practices in their machine design and manufacturing processes. They develop energy-efficient machines that minimize resource consumption, utilize eco-friendly materials, and optimize perforation patterns to reduce material waste.
Strategic Expansion:
Companies pursue expansion by entering new geographic markets, establishing partnerships with distributors or agents, and setting up local manufacturing facilities or service centres. This strategic expansion allows market players to better serve customers in different regions, penetrate untapped markets, and strengthen their global presence. By strategically expanding their footprint, market players position themselves for sustained growth and increased market share in the dynamic micro perforation machines market.
Acquisition:
Companies engage in acquisitions to gain access to new technologies, intellectual property, or customer bases. By acquiring complementary businesses, market players can diversify their product portfolios, enter new market segments, or strengthen their market position. Acquisitions also provide opportunities for synergies and operational efficiencies, allowing companies to streamline their operations, leverage shared resources, and drive innovation.
The global micro perforation machines market is estimated to be valued at USD 660.0 million in 2025.
The market size for the micro perforation machines market is projected to reach USD 828.6 million by 2035.
The micro perforation machines market is expected to grow at a 2.3% CAGR between 2025 and 2035.
The key product types in micro perforation machines market are mechanical micro perforation and laser micro perforation.
In terms of automation, automatic segment to command 61.2% share in the micro perforation machines market in 2025.


Full Research Suite comprises of:
Market outlook & trends analysis
Interviews & case studies
Strategic recommendations
Vendor profiles & capabilities analysis
5-year forecasts
8 regions and 60+ country-level data splits
Market segment data splits
12 months of continuous data updates
DELIVERED AS:
PDF EXCEL ONLINE
Micro CHP Market Size and Share Forecast Outlook 2025 to 2035
Micro Irrigation System Market Size and Share Forecast Outlook 2025 to 2035
Micro Flute Paper Market Size and Share Forecast Outlook 2025 to 2035
Microcrystalline Cellulose Market Size and Share Forecast Outlook 2025 to 2035
Micro Balances Market Size and Share Forecast Outlook 2025 to 2035
Micro Perforated Films Packaging Market Size and Share Forecast Outlook 2025 to 2035
Microbial Coagulants Market Size and Share Forecast Outlook 2025 to 2035
Microserver IC Market Size and Share Forecast Outlook 2025 to 2035
Microplate Handling Instruments Market Size and Share Forecast Outlook 2025 to 2035
Microsclerotherapy Treatment Market Size and Share Forecast Outlook 2025 to 2035
MicroLED Photoluminescence Inspection System Market Size and Share Forecast Outlook 2025 to 2035
Micro-Scale VFFS Modules Market Analysis - Size and Share Forecast Outlook 2025 to 2035
Microscope Digital Camera Market Size and Share Forecast Outlook 2025 to 2035
Micro Guide Catheter Market Size and Share Forecast Outlook 2025 to 2035
Micro Battery Market Size and Share Forecast Outlook 2025 to 2035
Microwave Monolithic Integrated Circuits Market Size and Share Forecast Outlook 2025 to 2035
Microhardness Testing System Market Size and Share Forecast Outlook 2025 to 2035
Microchip Electrophoresis Market Size and Share Forecast Outlook 2025 to 2035
Micropipette Puller Market Size and Share Forecast Outlook 2025 to 2035
Microwave Cable Assemblies Market Size and Share Forecast Outlook 2025 to 2035

Thank you!
You will receive an email from our Business Development Manager. Please be sure to check your SPAM/JUNK folder too.
Chat With
MaRIA