Beet Pulp Market Size, Share, and Forecast Outlook 2025 to 2035

The beet pulp market is projected to be valued at approximately USD 325.3 million in 2025, advancing toward a valuation of USD 702.9 million by 2035. This reflects an 8% compound annual growth rate over the forecast period, with consistent demand seen across developed and emerging regions.
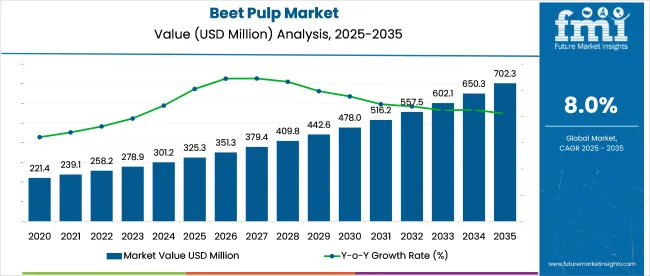
Quick Stats of Beet Pulp Market

  • Market Value (2025): USD 325.3 million
  • Forecast Value (2035): USD 702.9 million
  • Forecast CAGR (2025 to 2035): 8%
  • Leading Segment in 2025: Molassed (61.2% share)
  • Key Growth Region: Asia Pacific (India is the fastest growing market with 11.0% CAGR)
  • Key Players: Amalgamated Sugar, Michigan Sugar, Midwest Agri, Tereos, British Sugar, Nordzucker, Ontario Dehy Inc., American Crystal Sugar, Delta Sugar Company, Nippon Beet Sugar Manufacturing.

Beet Pulp Market Market Value Analysis

Metric Value
Industry Size (2025E) USD 325.3 million
Industry Value (2035F) USD 702.9 million
CAGR (2025 to 2035) 8%

North America, led by the United States, remains the dominant regional contributor, accounting for nearly 88.4% of total revenue in 2023. Despite its current lead, future expansion is expected to be paced by Asian markets, particularly India, where annual growth is anticipated at 8.1%. The broader trend reflects a shift in livestock nutrition practices, where both commercial and small-scale producers seek high-energy, digestible, and cost-effective feed components.

The industry registers varying degrees of share across its parent categories. It accounts for 4.2% of the animal feed market, driven by its niche use in high-fiber formulations. Within the livestock nutrition market, its share is estimated at 5.8%, owing to targeted inclusion in cattle and equine diets. In the equine feed market, its presence is more substantial, comprising nearly 11.3% due to its digestibility and energy benefits.

As a component of the sugar industry by-products market, it contributes about 9.5%, given its derivation from sugar beet processing. Lastly, in the functional fiber ingredients market, beet pulp represents 6.7%, supported by growing awareness of its prebiotic and gut-health advantages.

Recent trials in EU-funded livestock programs have evaluated micronized beet pulp pellets infused with postbiotics and chelated trace minerals. These modified formulations demonstrated a 17% improvement in dry matter digestibility in early-lactation dairy cows without altering total ration energy.

In India, agri-tech cooperatives in Maharashtra and Gujarat have begun contracting local sugar mills to standardize product moisture and fiber ratios for hybrid feed blocks targeted at smallholder buffalo operations. Meanwhile, patent activity from North American feed manufacturers points to extrusion-activated beet pulp blends being tested as an alternative to conventional soybean hulls in high-performance equine diets, especially where dust minimization and respiratory safety are priorities.

Per‑Capita Beet Pulp Consumption

Beet pulp, widely used as animal feed and in industrial applications, shows sharp contrasts in per‑capita availability across major economies. Based on a global allocation of 10 million tonnes, European markets record the highest per‑capita figures, while populous nations such as China and India see minimal availability per person despite significant aggregate volumes. 

  • In the United States, modelled beet pulp consumption averages 4.49 kilograms per person annually, or about 4,490 grams per year. 
  • Germany shows one of the highest levels, at 9.52 kilograms per person annually, or 9,520 grams per year, reflecting heavy use in livestock feed. 
  • France records the highest figure among large markets, with 10.77 kilograms per person annually, or 10,770 grams per year, supported by its cattle and dairy sectors. 
  • China averages just 0.50 kilograms per person annually, equal to 496 grams per year, despite its large aggregate allocation. 
  • The United Kingdom records 5.88 kilograms per person annually, or 5,880 grams per year, reflecting steady agricultural demand. 

Global Context for Beet Pulp Usage 

The top ten economies collectively account for 5 million tonnes, or 50 percent of global beet pulp volume, with Europe alone representing the largest share on a per‑capita basis. The rest of the world absorbs the remaining 5 million tonnes, spread across diverse agricultural markets, where average per‑capita availability remains far lower than in Europe and North America. 
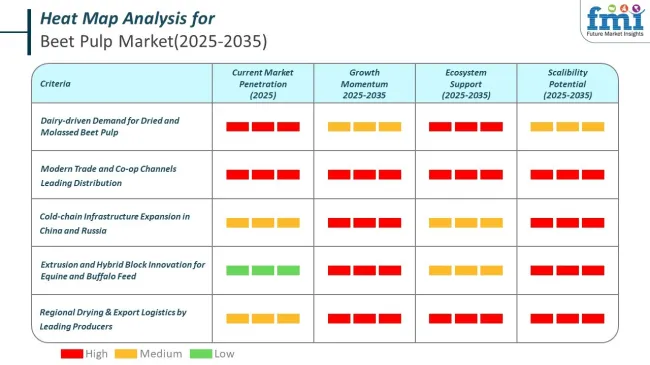
Heat Map For Beet Pulp Market

Analysis of Beet Pulp Market by Top Investment Segments

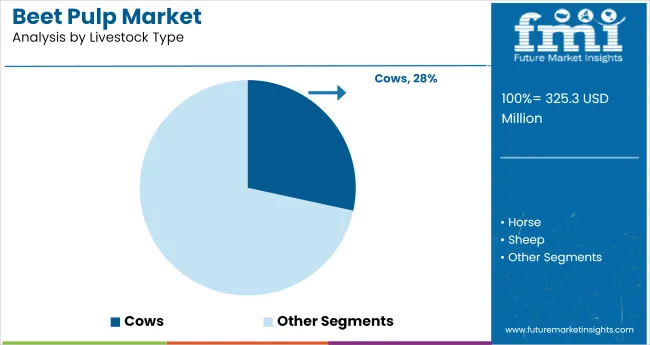
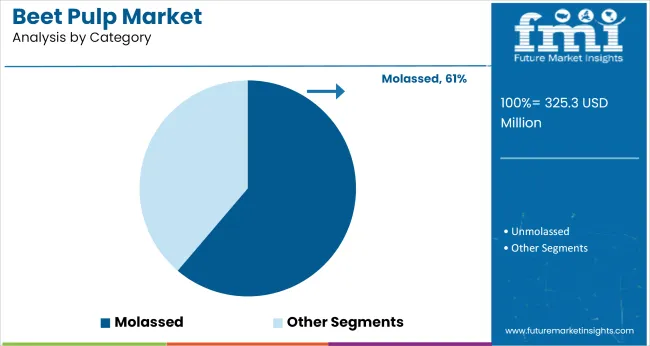
Dried pulp is projected to lead by product type in 2025 with a 42.6% share due to its storability and transport benefits, while cows dominate livestock usage at 28.4% driven by dairy feed demand. Molassed beet pulp leads by category at 61.2%, favored for its energy and taste profile. Modern trade accounts for 36.7% of sales, supported by bulk supply and retail integration.

Product Type Analysis of Dried Pulp Leads with 42.6%

Dried pulp is projected to remain the dominant segment in 2025, capturing around 42.6% of total product-type revenue. Its long shelf life and low moisture content make it suitable for bulk handling, extended storage, and cross-border trade, especially in markets where climatic conditions limit the use of wet or ensiled variants.
  • Feed manufacturers favor dried pulp due to its uniform composition and ease of incorporation into compound feed.
  • Unlike wet and pressed forms, dried pulp offers reduced transportation costs per nutrient unit and minimizes spoilage risks.
  • High digestible fiber content and role in energy supplementation have further expanded its uptake in both commercial ruminant and equine diets.

Cows Dominate Livestock Type Usage in 2025

Beet Pulp Market Analysis By Livestock Type

Cows are expected to lead consumption in 2025, accounting for nearly 28.4% of total livestock-based demand. Their high nutritional requirements and consistent feed intake patterns make beet-derived fiber an ideal supplement, particularly in dairy operations.
  • The digestible fiber in beet pulp supports optimal rumen function, milk yield, and weight maintenance, especially in high-producing breeds.
  • Large-scale commercial dairy farms in North America and Europe are the primary adopters, driven by feed efficiency targets and cost optimization strategies.
  • Seasonal availability of roughage alternatives further strengthens the reliance on product.

Shift Toward Molassed Beet Pulp in 2025

Beet Pulp Market Analysis By Category

Molassed beet pulp is projected to dominate in 2025, holding an estimated 61.2% share of category-based sales. Its enhanced palatability and elevated energy content make it highly favored among livestock owners, particularly in high-performance dairy and equine systems.
  • The addition of molasses not only improves taste but also supplies readily available carbohydrates, supporting feed intake and energy balance.
  • In regions with fluctuating forage quality, molassed pulp serves as a dependable base for total mixed rations.
  • The blend of digestible fiber and sugar content continues to make it a preferred inclusion in structured feed formulations.

Distribution Advantage of Modern Trade with 36.7% Share

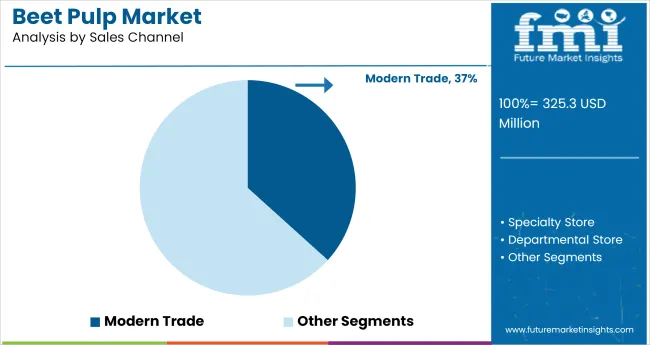
Beet Pulp Market Analysis By Sales Channel

Modern trade is expected to lead sales in 2025, capturing around 36.7% of total distribution share. Its extensive geographic coverage, bulk procurement capabilities, and integration with agricultural cooperatives position it as the most effective channel for beet pulp distribution.

  • Retail chains and agri-input outlets under modern trade provide consistent inventory, pricing transparency, and access to bundled feed solutions, which appeal to commercial livestock producers.
  • The consolidation of procurement by feed operators and dairy networks further strengthens this channel’s reach.
  • Unlike specialty or convenience outlets, modern trade offers logistical efficiencies, supporting large-volume buyers with contract-based supply, credit terms, and better delivery lead times, particularly in export-linked markets.

Top Beet Pulp Market Dynamics

Beet pulp demand is driven by its digestible fiber, cost-efficiency, and role in high-yield livestock nutrition. Industrial integration with sugar processing and global trade expansion are further supporting its position in feed supply chains.

Rising Livestock Feed Demand

Rising emphasis on feed quality and cost-efficient nutrition in livestock farming has accelerated the use of product in structured rations. Dairy, equine, and beef producers are increasingly selecting products for its digestible fiber and stable energy yield. This trend is reinforced by growing awareness of gut health benefits and enhanced nutrient absorption associated with beet-derived fiber. The market is also benefiting from broader adoption in regions shifting toward intensive animal agriculture, where optimized feed conversion ratios are essential for profitability.

  • Beet pulp aids rumen health and milk productivity
  • Cost-effective compared to grain-based feed additives
  • Expanding demand in high-output dairy operations

Industrial Integration and Trade Expansion

Beet pulp demand is also being shaped by strategic alignment with the sugar industry and growth in cross-border trade of processed feed ingredients. With rising global sugar beet production, beet pulp is increasingly captured as a co-product and distributed through formalized supply chains.

Export demand, especially in Asia and the Middle East, is being supported by modern trade networks and long-shelf-life variants like dried and molassed pulp. These developments are positioning product as a reliable commodity in both domestic and export-driven feed economies.
  • Integration with sugar processors ensures steady supply
  • Trade-ready forms enable long-distance shipment
  • Demand growth in import-reliant livestock economies

Top Countries Producing, Processing, and Exporting Beet Pulp

Beet Pulp Market Country Wise Analysis

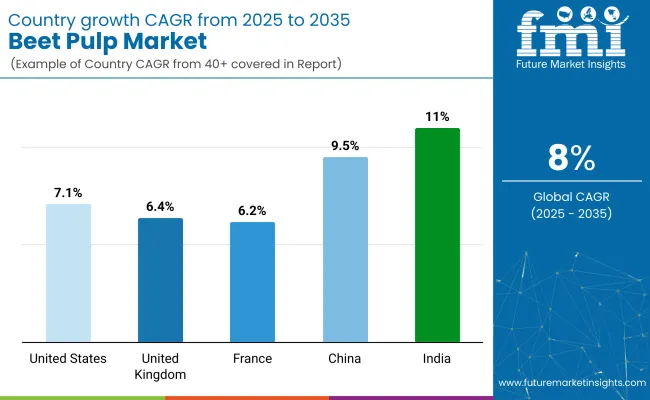
Country CAGR (2025 to 2035)
United States 7.1%
United Kingdom 6.4%
France 6.2%
China 9.5%
India 11.0%

The beet pulp market is projected to expand at an 8% CAGR between 2025 and 2035, led by rising demand in ruminant feed and fermentation substrates. Russia, a BRICS country, outpaces the global trend with 9.4% growth, supported by expansion in sugar beet cultivation and strong regional demand for pelletized feed inputs. Processing clusters in Krasnodar and Voronezh are optimizing drying and densification to meet EU and Middle East export standards.

India follows at 8.7%, where beet pulp is gaining ground as a low-cost fiber additive in compound feeds. Growth is tied to diversification in dairy feed formulations and regional supply chain development in Uttar Pradesh and Maharashtra. ASEAN economies such as Thailand and Vietnam record 8.2%, slightly above trend, driven by increasing usage in aquaculture and contract farming models. OECD nations underperform. France grows at 6.9% due to stagnant sugar beet output, while the United States posts 6.5%, constrained by cost inflation in transportation and drying stages.

The report covers a detailed analysis of 40+ countries and the top five countries have been shared as a reference.
In-depth Analysis of the United States Beet Pulp Market

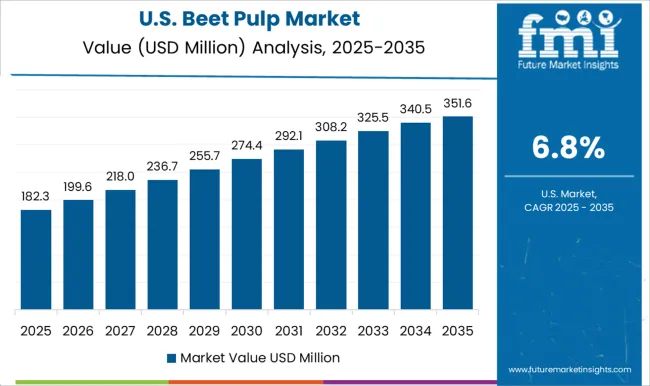
The USA beet pulp market is projected to expand at a 7.1% CAGR through 2025 to 2035. Growth is being underpinned by large dairy and beef herds that require fiber‐rich, low-starch rations to maintain rumen health and support high milk yields. Steady supplies of product from domestic sugar processors in the Upper Midwest and Pacific Northwest ensure price stability, encouraging feed formulators to lock in long-term contracts.

Emphasis on feed efficiency under the Dairy Margin Coverage program is prompting producers to incorporate beet-derived fiber in total mixed rations, while equine owners value the product for its slow-release energy profile. Modern trade chains dedicated to farm inputs are broadening distribution, aided by logistics hubs near grain terminals, enabling reliable year-round availability even during roughage shortages.

  • Energy-dense fiber meets dairy ration targets
  • Stable co-product supply lowers cost volatility
  • National farm retail chains secure last-mile access

Analysis of Sales of Beet Pulp Systems in the United Kingdom

The United Kingdom’s beet pulp market value is expected to rise at a 6.4% CAGR over the forecast horizon. Demand is being driven by a sizable leisure and performance horse population that relies on beet-based fiber to offset limited grazing during colder months. Sugar beet processing clusters in eastern England provide a local co-product stream that is pelleted, stored, and moved through integrated feed mills, keeping transport costs low.

Sectoral focus on gut health and laminitis prevention in horses has been amplified by veterinary guidelines that favor low-starch diets, placing product high on purchasing lists. Dairy herds concentrated in the West Country are supplementing conserved forages with beet-derived fiber to maintain butterfat levels, while online farm stores have accelerated small-lot sales.

  • Equine nutrition standards favor low-starch fiber
  • Local processing reduces feed mill input costs
  • E-commerce channels widen small-holder reach

Detailed Outlook on the Future of Beet Pulp Market in France

France’s beet pulp market is anticipated to progress at a 6.2% CAGR throughout 2025 to 2035. Northern sugar refineries generate consistent product volumes that are pelletized and routed to cooperative feed plants serving the country’s extensive dairy basin. Policy measures aimed at reducing antibiotic use have placed greater emphasis on feed ingredients that promote gut microbiota balance, and beet-derived pectin and hemicellulose are viewed as effective prebiotic sources.

Producer organizations have negotiated collective procurement agreements, securing favorable pricing and minimizing inventory risk. Rising interest in forage extenders during drought-prone summers is encouraging dairies to blend beet pulp with maize silage, safeguarding milk solids. Equine breeding regions such as Normandy are also adopting molassed variants for young stock conditioning.

  • Cooperative contracts stabilize input pricing
  • Prebiotic attributes assist antibiotic reduction goals
  • Forage extender role mitigates summer feed gaps

Growth Analysis and Forecast for China Beet Pulp Market

China’s beet pulp market is forecast to register a 9.5% CAGR between 2025 and 2035. Rapid expansion of commercial dairy clusters in Inner Mongolia and Heilongjiang, combined with large-scale beef feedlots in the Northeast, has amplified demand for digestible fiber that complements high-grain diets. Domestic products output lags consumption, so import volumes from the EU and North America are rising, aided by tariff concessions under recent trade protocols.

Government feed standards targeting improved conversion ratios encourage formulators to replace part of the cereal base with fiber-rich co-products, moderating feed costs without sacrificing energy density. Cold-chain enhancements along rail corridors facilitate long-distance shipment of dried and molassed pellets to inland provinces, reducing spoilage risk and supporting year-round supply.

  • Import dependency fills production shortfall
  • Feed standards reward fiber inclusion efficiency
  • Rail logistics extend reach to interior dairies

Demand Forecast Analysis for Beet Pulp Market in India

India’s beet pulp market is poised to grow at an 11.0% CAGR during the forecast period. Rising milk demand and government initiatives to professionalize dairy farming are accelerating the shift from fodder-based diets to compound feeds that incorporate energy-dense fiber. Pilot sugar beet cultivation programs in Gujarat and Uttar Pradesh are providing an emerging domestic source of pulp, while import channels via west-coast ports backstop supply during lean periods.

Animal nutrition companies are promoting products as a cost-effective replacer for maize and oilseed cakes, highlighting improved rumen health and weight gain. Expansion of organized feed retail in tier-two cities, coupled with digital advisory platforms for smallholders, is broadening market penetration beyond traditional cooperative networks.
  • Pilot beet cultivation supports local sourcing
  • Fiber replacer cuts cereal-based feed costs
  • Digital advisory tools boost rural adoption

Leading Beet Pulp Suppliers

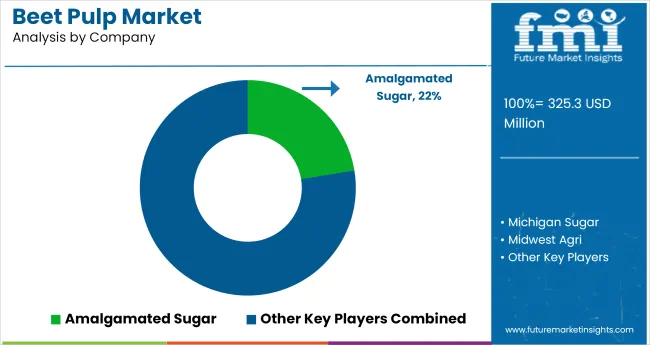
Beet Pulp Market Analysis By Company

The beet pulp industry is shaped by established sugar cooperatives and processing companies focused on by-product valorization and feed-grade fiber optimization. Leading the sector is Amalgamated Sugar, recognized for consistent output and integrated supply chains across North America. Other key players include Michigan Sugar, Midwest Agri, and American Crystal Sugar, all leveraging proximity to beet-growing regions to ensure feedstock security.

European firms such as Tereos, British Sugar, and Nordzucker specialize in molassed and pelleted variants for livestock nutrition. Canadian supplier Ontario Dehy Inc. and Egypt-based Delta Sugar Company enhance global trade flows, while Nippon Beet Sugar Manufacturing brings Asia-Pacific capabilities to the segment. Strategic investments in drying technology and regional distribution continue to strengthen the competitive landscape.

Recent Beet Pulp Industry News

  • In January 2023, American Crystal Sugar Company announced an investment in a new drying facility to increase its dried sugar product (SBP) production capacity. This expansion is aimed at meeting the rising demand for high-quality dried pulp, particularly from the animal feed sector. The facility is expected to be operational and impacting capacity throughout 2024 and 2025.

Leading Players

  • Amalgamated Sugar
  • Michigan Sugar
  • Midwest Agri
  • Tereos
  • British Sugar
  • Nordzucker
  • Ontario Dehy Inc.
  • American Crystal Sugar
  • Delta Sugar Company
  • Nippon Beet Sugar Manufacturing

Report Coverage and Scope Summary

Report Attributes Details
Market Size (2025) USD 325.3 million
Projected Market Size (2035) USD 702.9 million
CAGR (2025 to 2035) 8%
Base Year for Estimation 2024
Historical Period 2020 to 2024
Projections Period 2025 to 2035
Quantitative Units USD million for value
Product Type Analyzed (Segment 1) Wet Pulp, Pressed Pulp, Dried Pulp (Pellets and Shreds), and Ensiled Pulp.
Livestock Type Analyzed (Segment 2) Cow, Horse, Sheep, Goat, Pig, Buffaloes, Mules, and Asses.
Category Type Analyzed (Segment 3) Molassed and Unmolassed.
Sales Channel Analyzed (Segment 4) Modern Trade, Specialty Store, Departmental Store, Convenience Store, and Online Retailers.
Regions Covered North America, Europe, Asia Pacific, Middle East & Africa, Latin America
Countries Covered United States, Canada, Germany, United Kingdom, France, Italy, Spain, China, Japan, South Korea, India, Australia, Brazil, Mexico, Argentina, Saudi Arabia, UAE, South Africa
Key Players Amalgamated Sugar, Michigan Sugar, Midwest Agri, Tereos, British Sugar, Nordzucker, Ontario Dehy Inc., American Crystal Sugar, Delta Sugar Company, Nippon Beet Sugar Manufacturing.
Additional Attributes Dollar sales, share, growth rate, top livestock users, leading product forms, trade dynamics, regional demand shifts, raw material access, pricing trends, and dominant distribution channels.

Key Segments

By Product Type:

The industry is segmented into wet pulp, pressed pulp, dried pulp (pellets and shreds), and ensiled pulp.

By Livestock Type:

The industry is segmented into cow, horse, sheep, goat, pig, buffaloes, mules, and asses.

By Category Type:

The industry finds molassed and unmolassed.

By Sales Channel:

The industry is segmented into modern trade, specialty store, departmental store, convenience store, and online retailers.

By Region:

The industry covers regions including North America, Europe, Asia Pacific, Latin America, and the Middle East & Africa.

Table of Content

  1. Executive Summary
    • Global Market Outlook
    • Demand-side Trends
    • Supply-side Trends
    • Technology Roadmap Analysis
    • Analysis and Recommendations
  2. Market Overview
    • Market Coverage / Taxonomy
    • Market Definition / Scope / Limitations
  3. Market Background
    • Market Dynamics
      • Drivers
      • Restraints
      • Opportunity
      • Trends
    • Scenario Forecast
      • Demand in Optimistic Scenario
      • Demand in Likely Scenario
      • Demand in Conservative Scenario
    • Opportunity Map Analysis
    • Product Life Cycle Analysis
    • Supply Chain Analysis
      • Supply Side Participants and their Roles
        • Producers
        • Mid-Level Participants (Traders/ Agents/ Brokers)
        • Wholesalers and Distributors
      • Value Added and Value Created at Node in the Supply Chain
      • List of Raw Material Suppliers
      • List of Existing and Potential Buyer’s
    • Investment Feasibility Matrix
    • Value Chain Analysis
      • Profit Margin Analysis
      • Wholesalers and Distributors
      • Retailers
    • PESTLE and Porter’s Analysis
    • Regulatory Landscape
      • By Key Regions
      • By Key Countries
    • Regional Parent Market Outlook
    • Production and Consumption Statistics
    • Import and Export Statistics
  4. Global Market Analysis 2020 to 2024 and Forecast, 2025 to 2035
    • Historical Market Size Value (USD Mn) Analysis, 2020 to 2024
    • Current and Future Market Size Value (USD Mn) Projections, 2025 to 2035
      • Y-o-Y Growth Trend Analysis
      • Absolute $ Opportunity Analysis
  5. Global Market Pricing Analysis 2020 to 2024 and Forecast 2025 to 2035
  6. Global Market Analysis 2020 to 2024 and Forecast 2025 to 2035, By Product Type
    • Introduction / Key Findings
    • Historical Market Size Value (USD Mn) Analysis By Product Type, 2020 to 2024
    • Current and Future Market Size Value (USD Mn) Analysis and Forecast By Product Type, 2025 to 2035
      • Wet Pulp
      • Pressed Pulp
      • Dried Pulp
        • Pellets
        • Shreds
      • Ensiled Pulp
    • Y-o-Y Growth Trend Analysis By Product Type, 2020 to 2024
    • Absolute $ Opportunity Analysis By Product Type, 2025 to 2035
  7. Global Market Analysis 2020 to 2024 and Forecast 2025 to 2035, By Livestock Type
    • Introduction / Key Findings
    • Historical Market Size Value (USD Mn) Analysis By Livestock Type, 2020 to 2024
    • Current and Future Market Size Value (USD Mn) Analysis and Forecast By Livestock Type, 2025 to 2035
      • Cow
      • Horse
      • Sheep
      • Goat
      • Pig
      • Buffaloes
      • Mules
      • Asses
    • Y-o-Y Growth Trend Analysis By Livestock Type, 2020 to 2024
    • Absolute $ Opportunity Analysis By Livestock Type, 2025 to 2035
  8. Global Market Analysis 2020 to 2024 and Forecast 2025 to 2035, By Category Type
    • Introduction / Key Findings
    • Historical Market Size Value (USD Mn) Analysis By Category Type, 2020 to 2024
    • Current and Future Market Size Value (USD Mn) Analysis and Forecast By Category Type, 2025 to 2035
      • Molassed
      • Unmolassed
    • Y-o-Y Growth Trend Analysis By Category Type, 2020 to 2024
    • Absolute $ Opportunity Analysis By Category Type, 2025 to 2035
  9. Global Market Analysis 2020 to 2024 and Forecast 2025 to 2035, By Sales Channel
    • Introduction / Key Findings
    • Historical Market Size Value (USD Mn) Analysis By Sales Channel, 2020 to 2024
    • Current and Future Market Size Value (USD Mn) Analysis and Forecast By Sales Channel, 2025 to 2035
      • Modern Trade
      • Specialty Store
      • Departmental Store
      • Convenience Store
      • Online Retailers
    • Y-o-Y Growth Trend Analysis By Sales Channel, 2020 to 2024
    • Absolute $ Opportunity Analysis By Sales Channel, 2025 to 2035
  10. Global Market Analysis 2020 to 2024 and Forecast 2025 to 2035, By Region
    • Introduction
    • Historical Market Size Value (USD Mn) Analysis By Region, 2020 to 2024
    • Current Market Size Value (USD Mn) Analysis and Forecast By Region, 2025 to 2035
      • North America
      • Latin America
      • Western Europe
      • Eastern Europe
      • East Asia
      • South Asia & Pacific
      • Middle East and Africa
    • Market Attractiveness Analysis By Region
  11. North America Market Analysis 2020 to 2024 and Forecast 2025 to 2035, By Country
    • Historical Market Size Value (USD Mn) Trend Analysis By Market Taxonomy, 2020 to 2024
    • Market Size Value (USD Mn) Forecast By Market Taxonomy, 2025 to 2035
      • By Country
        • USA
        • Canada
        • Mexico
      • By Product Type
      • By Livestock Type
      • By Category Type
      • By Sales Channel
    • Market Attractiveness Analysis
      • By Country
      • By Product Type
      • By Livestock Type
      • By Category Type
      • By Sales Channel
    • Key Takeaways
  12. Latin America Market Analysis 2020 to 2024 and Forecast 2025 to 2035, By Country
    • Historical Market Size Value (USD Mn) Trend Analysis By Market Taxonomy, 2020 to 2024
    • Market Size Value (USD Mn) Forecast By Market Taxonomy, 2025 to 2035
      • By Country
        • Brazil
        • Argentina
        • Rest of LATAM
      • By Product Type
      • By Livestock Type
      • By Category Type
      • By Sales Channel
    • Market Attractiveness Analysis
      • By Country
      • By Product Type
      • By Livestock Type
      • By Category Type
      • By Sales Channel
    • Key Takeaways
  13. Western Europe Market Analysis 2020 to 2024 and Forecast 2025 to 2035, By Country
    • Historical Market Size Value (USD Mn) Trend Analysis By Market Taxonomy, 2020 to 2024
    • Market Size Value (USD Mn) Forecast By Market Taxonomy, 2025 to 2035
      • By Country
        • Germany
        • Italy
        • France
        • UK
        • Spain
        • BENELUX
        • Nordic
        • Rest of W.Europe
      • By Product Type
      • By Livestock Type
      • By Category Type
      • By Sales Channel
    • Market Attractiveness Analysis
      • By Country
      • By Product Type
      • By Livestock Type
      • By Category Type
      • By Sales Channel
    • Key Takeaways
  14. Eastern Europe Market Analysis 2020 to 2024 and Forecast 2025 to 2035, By Country
    • Historical Market Size Value (USD Mn) Trend Analysis By Market Taxonomy, 2020 to 2024
    • Market Size Value (USD Mn) Forecast By Market Taxonomy, 2025 to 2035
      • By Country
        • Russia
        • Hungary
        • Poland
        • Balkan & Baltics
        • Rest of E. Europe
      • By Product Type
      • By Livestock Type
      • By Category Type
      • By Sales Channel
    • Market Attractiveness Analysis
      • By Country
      • By Product Type
      • By Livestock Type
      • By Category Type
      • By Sales Channel
    • Key Takeaways
  15. East Asia Market Analysis 2020 to 2024 and Forecast 2025 to 2035, By Country
    • Historical Market Size Value (USD Mn) Trend Analysis By Market Taxonomy, 2020 to 2024
    • Market Size Value (USD Mn) Forecast By Market Taxonomy, 2025 to 2035
      • By Country
        • China
        • Japan
        • South Korea
      • By Product Type
      • By Livestock Type
      • By Category Type
      • By Sales Channel
    • Market Attractiveness Analysis
      • By Country
      • By Product Type
      • By Livestock Type
      • By Category Type
      • By Sales Channel
    • Key Takeaways
  16. South Asia & Pacific Market Analysis 2020 to 2024 and Forecast 2025 to 2035, By Country
    • Historical Market Size Value (USD Mn) Trend Analysis By Market Taxonomy, 2020 to 2024
    • Market Size Value (USD Mn) Forecast By Market Taxonomy, 2025 to 2035
      • By Country
        • India
        • Australia & New Zealand
        • ASEAN
        • Rest of SAP
      • By Product Type
      • By Livestock Type
      • By Category Type
      • By Sales Channel
    • Market Attractiveness Analysis
      • By Country
      • By Product Type
      • By Livestock Type
      • By Category Type
      • By Sales Channel
    • Key Takeaways
  17. Middle East and Africa Market Analysis 2020 to 2024 and Forecast 2025 to 2035, By Country
    • Historical Market Size Value (USD Mn) Trend Analysis By Market Taxonomy, 2020 to 2024
    • Market Size Value (USD Mn) Forecast By Market Taxonomy, 2025 to 2035
      • By Country
        • GCC Countries
        • Northern Africa
        • South Africa
        • Turkiye
        • Rest of MEA
      • By Product Type
      • By Livestock Type
      • By Category Type
      • By Sales Channel
    • Market Attractiveness Analysis
      • By Country
      • By Product Type
      • By Livestock Type
      • By Category Type
      • By Sales Channel
    • Key Takeaways
  18. Key Countries Market Analysis
    • USA
      • Pricing Analysis
      • Market Share Analysis, 2024
        • By Product Type
        • By Livestock Type
        • By Category Type
        • By Sales Channel
    • Canada
      • Pricing Analysis
      • Market Share Analysis, 2024
        • By Product Type
        • By Livestock Type
        • By Category Type
        • By Sales Channel
    • Brazil
      • Pricing Analysis
      • Market Share Analysis, 2024
        • By Product Type
        • By Livestock Type
        • By Category Type
        • By Sales Channel
    • Mexico
      • Pricing Analysis
      • Market Share Analysis, 2024
        • By Product Type
        • By Livestock Type
        • By Category Type
        • By Sales Channel
    • Argentina
      • Pricing Analysis
      • Market Share Analysis, 2024
        • By Product Type
        • By Livestock Type
        • By Category Type
        • By Sales Channel
  19. Market Structure Analysis
    • Competition Dashboard
    • Competition Benchmarking
    • Market Share Analysis of Top Players
      • By Regional
      • By Product Type
      • By Livestock Type
      • By Category Type
      • By Sales Channel
  20. Competition Analysis
    • Competition Deep Dive
      • Amalgamated Sugar
        • Overview
        • Product Portfolio
        • Profitability by Market Segments (Product/Age /Sales Channel/Region)
        • Sales Footprint
        • Strategy Overview
          • Marketing Strategy
          • Product Strategy
          • Channel Strategy
      • Michigan Sugar
        • Overview
        • Product Portfolio
        • Profitability by Market Segments (Product/Age /Sales Channel/Region)
        • Sales Footprint
        • Strategy Overview
          • Marketing Strategy
          • Product Strategy
          • Channel Strategy
      • Midwest Agri
        • Overview
        • Product Portfolio
        • Profitability by Market Segments (Product/Age /Sales Channel/Region)
        • Sales Footprint
        • Strategy Overview
          • Marketing Strategy
          • Product Strategy
          • Channel Strategy
      • Tereos
        • Overview
        • Product Portfolio
        • Profitability by Market Segments (Product/Age /Sales Channel/Region)
        • Sales Footprint
        • Strategy Overview
          • Marketing Strategy
          • Product Strategy
          • Channel Strategy
      • British Sugar
        • Overview
        • Product Portfolio
        • Profitability by Market Segments (Product/Age /Sales Channel/Region)
        • Sales Footprint
        • Strategy Overview
          • Marketing Strategy
          • Product Strategy
          • Channel Strategy
      • Nordzucker
        • Overview
        • Product Portfolio
        • Profitability by Market Segments (Product/Age /Sales Channel/Region)
        • Sales Footprint
        • Strategy Overview
          • Marketing Strategy
          • Product Strategy
          • Channel Strategy
      • Ontario Dehy Inc.
        • Overview
        • Product Portfolio
        • Profitability by Market Segments (Product/Age /Sales Channel/Region)
        • Sales Footprint
        • Strategy Overview
          • Marketing Strategy
          • Product Strategy
          • Channel Strategy
      • American Crystal Sugar
        • Overview
        • Product Portfolio
        • Profitability by Market Segments (Product/Age /Sales Channel/Region)
        • Sales Footprint
        • Strategy Overview
          • Marketing Strategy
          • Product Strategy
          • Channel Strategy
      • Delta Sugar Company
        • Overview
        • Product Portfolio
        • Profitability by Market Segments (Product/Age /Sales Channel/Region)
        • Sales Footprint
        • Strategy Overview
          • Marketing Strategy
          • Product Strategy
          • Channel Strategy
      • Nippon Beet Sugar Manufacturing
        • Overview
        • Product Portfolio
        • Profitability by Market Segments (Product/Age /Sales Channel/Region)
        • Sales Footprint
        • Strategy Overview
          • Marketing Strategy
          • Product Strategy
          • Channel Strategy
  21. Assumptions & Acronyms Used
  22. Research Methodology

List of Tables

  • Table 1: Global Market Value (USD Million) Forecast by Region, 2020-2035
  • Table 2: Global Market Value (USD Million) Forecast by Product Type, 2020-2035
  • Table 3: Global Market Value (USD Million) Forecast by Livestock Type, 2020-2035
  • Table 4: Global Market Value (USD Million) Forecast by Category Type, 2020-2035
  • Table 5: Global Market Value (USD Million) Forecast by Sales Channel, 2020-2035
  • Table 6: North America Market Value (USD Million) Forecast by Country, 2020-2035
  • Table 7: North America Market Value (USD Million) Forecast by Product Type, 2020-2035
  • Table 8: North America Market Value (USD Million) Forecast by Livestock Type, 2020-2035
  • Table 9: North America Market Value (USD Million) Forecast by Category Type, 2020-2035
  • Table 10: North America Market Value (USD Million) Forecast by Sales Channel, 2020-2035
  • Table 11: Latin America Market Value (USD Million) Forecast by Country, 2020-2035
  • Table 12: Latin America Market Value (USD Million) Forecast by Product Type, 2020-2035
  • Table 13: Latin America Market Value (USD Million) Forecast by Livestock Type, 2020-2035
  • Table 14: Latin America Market Value (USD Million) Forecast by Category Type, 2020-2035
  • Table 15: Latin America Market Value (USD Million) Forecast by Sales Channel, 2020-2035
  • Table 16: Western Europe Market Value (USD Million) Forecast by Country, 2020-2035
  • Table 17: Western Europe Market Value (USD Million) Forecast by Product Type, 2020-2035
  • Table 18: Western Europe Market Value (USD Million) Forecast by Livestock Type, 2020-2035
  • Table 19: Western Europe Market Value (USD Million) Forecast by Category Type, 2020-2035
  • Table 20: Western Europe Market Value (USD Million) Forecast by Sales Channel, 2020-2035
  • Table 21: Eastern Europe Market Value (USD Million) Forecast by Country, 2020-2035
  • Table 22: Eastern Europe Market Value (USD Million) Forecast by Product Type, 2020-2035
  • Table 23: Eastern Europe Market Value (USD Million) Forecast by Livestock Type, 2020-2035
  • Table 24: Eastern Europe Market Value (USD Million) Forecast by Category Type, 2020-2035
  • Table 25: Eastern Europe Market Value (USD Million) Forecast by Sales Channel, 2020-2035
  • Table 26: East Asia Market Value (USD Million) Forecast by Country, 2020-2035
  • Table 27: East Asia Market Value (USD Million) Forecast by Product Type, 2020-2035
  • Table 28: East Asia Market Value (USD Million) Forecast by Livestock Type, 2020-2035
  • Table 29: East Asia Market Value (USD Million) Forecast by Category Type, 2020-2035
  • Table 30: East Asia Market Value (USD Million) Forecast by Sales Channel, 2020-2035
  • Table 31: South Asia & Pacific Market Value (USD Million) Forecast by Country, 2020-2035
  • Table 32: South Asia & Pacific Market Value (USD Million) Forecast by Product Type, 2020-2035
  • Table 33: South Asia & Pacific Market Value (USD Million) Forecast by Livestock Type, 2020-2035
  • Table 34: South Asia & Pacific Market Value (USD Million) Forecast by Category Type, 2020-2035
  • Table 35: South Asia & Pacific Market Value (USD Million) Forecast by Sales Channel, 2020-2035
  • Table 36: Middle East and Africa Market Value (USD Million) Forecast by Country, 2020-2035
  • Table 37: Middle East and Africa Market Value (USD Million) Forecast by Product Type, 2020-2035
  • Table 38: Middle East and Africa Market Value (USD Million) Forecast by Livestock Type, 2020-2035
  • Table 39: Middle East and Africa Market Value (USD Million) Forecast by Category Type, 2020-2035
  • Table 40: Middle East and Africa Market Value (USD Million) Forecast by Sales Channel, 2020-2035

List of Figures

  • Figure 1: Global Market Pricing Analysis
  • Figure 2: Global Market Value (USD Million) Forecast 2020-2035
  • Figure 3: Global Market Value Share and BPS Analysis by Product Type, 2025 and 2035
  • Figure 4: Global Market Y-o-Y Growth Comparison by Product Type, 2025-2035
  • Figure 5: Global Market Attractiveness Analysis by Product Type
  • Figure 6: Global Market Value Share and BPS Analysis by Livestock Type, 2025 and 2035
  • Figure 7: Global Market Y-o-Y Growth Comparison by Livestock Type, 2025-2035
  • Figure 8: Global Market Attractiveness Analysis by Livestock Type
  • Figure 9: Global Market Value Share and BPS Analysis by Category Type, 2025 and 2035
  • Figure 10: Global Market Y-o-Y Growth Comparison by Category Type, 2025-2035
  • Figure 11: Global Market Attractiveness Analysis by Category Type
  • Figure 12: Global Market Value Share and BPS Analysis by Sales Channel, 2025 and 2035
  • Figure 13: Global Market Y-o-Y Growth Comparison by Sales Channel, 2025-2035
  • Figure 14: Global Market Attractiveness Analysis by Sales Channel
  • Figure 15: Global Market Value (USD Million) Share and BPS Analysis by Region, 2025 and 2035
  • Figure 16: Global Market Y-o-Y Growth Comparison by Region, 2025-2035
  • Figure 17: Global Market Attractiveness Analysis by Region
  • Figure 18: North America Market Incremental $ Opportunity, 2025-2035
  • Figure 19: Latin America Market Incremental $ Opportunity, 2025-2035
  • Figure 20: Western Europe Market Incremental $ Opportunity, 2025-2035
  • Figure 21: Eastern Europe Market Incremental $ Opportunity, 2025-2035
  • Figure 22: East Asia Market Incremental $ Opportunity, 2025-2035
  • Figure 23: South Asia & Pacific Market Incremental $ Opportunity, 2025-2035
  • Figure 24: Middle East and Africa Market Incremental $ Opportunity, 2025-2035
  • Figure 25: North America Market Value Share and BPS Analysis by Country, 2025 and 2035
  • Figure 26: North America Market Value Share and BPS Analysis by Product Type, 2025 and 2035
  • Figure 27: North America Market Y-o-Y Growth Comparison by Product Type, 2025-2035
  • Figure 28: North America Market Attractiveness Analysis by Product Type
  • Figure 29: North America Market Value Share and BPS Analysis by Livestock Type, 2025 and 2035
  • Figure 30: North America Market Y-o-Y Growth Comparison by Livestock Type, 2025-2035
  • Figure 31: North America Market Attractiveness Analysis by Livestock Type
  • Figure 32: North America Market Value Share and BPS Analysis by Category Type, 2025 and 2035
  • Figure 33: North America Market Y-o-Y Growth Comparison by Category Type, 2025-2035
  • Figure 34: North America Market Attractiveness Analysis by Category Type
  • Figure 35: North America Market Value Share and BPS Analysis by Sales Channel, 2025 and 2035
  • Figure 36: North America Market Y-o-Y Growth Comparison by Sales Channel, 2025-2035
  • Figure 37: North America Market Attractiveness Analysis by Sales Channel
  • Figure 38: Latin America Market Value Share and BPS Analysis by Country, 2025 and 2035
  • Figure 39: Latin America Market Value Share and BPS Analysis by Product Type, 2025 and 2035
  • Figure 40: Latin America Market Y-o-Y Growth Comparison by Product Type, 2025-2035
  • Figure 41: Latin America Market Attractiveness Analysis by Product Type
  • Figure 42: Latin America Market Value Share and BPS Analysis by Livestock Type, 2025 and 2035
  • Figure 43: Latin America Market Y-o-Y Growth Comparison by Livestock Type, 2025-2035
  • Figure 44: Latin America Market Attractiveness Analysis by Livestock Type
  • Figure 45: Latin America Market Value Share and BPS Analysis by Category Type, 2025 and 2035
  • Figure 46: Latin America Market Y-o-Y Growth Comparison by Category Type, 2025-2035
  • Figure 47: Latin America Market Attractiveness Analysis by Category Type
  • Figure 48: Latin America Market Value Share and BPS Analysis by Sales Channel, 2025 and 2035
  • Figure 49: Latin America Market Y-o-Y Growth Comparison by Sales Channel, 2025-2035
  • Figure 50: Latin America Market Attractiveness Analysis by Sales Channel
  • Figure 51: Western Europe Market Value Share and BPS Analysis by Country, 2025 and 2035
  • Figure 52: Western Europe Market Value Share and BPS Analysis by Product Type, 2025 and 2035
  • Figure 53: Western Europe Market Y-o-Y Growth Comparison by Product Type, 2025-2035
  • Figure 54: Western Europe Market Attractiveness Analysis by Product Type
  • Figure 55: Western Europe Market Value Share and BPS Analysis by Livestock Type, 2025 and 2035
  • Figure 56: Western Europe Market Y-o-Y Growth Comparison by Livestock Type, 2025-2035
  • Figure 57: Western Europe Market Attractiveness Analysis by Livestock Type
  • Figure 58: Western Europe Market Value Share and BPS Analysis by Category Type, 2025 and 2035
  • Figure 59: Western Europe Market Y-o-Y Growth Comparison by Category Type, 2025-2035
  • Figure 60: Western Europe Market Attractiveness Analysis by Category Type
  • Figure 61: Western Europe Market Value Share and BPS Analysis by Sales Channel, 2025 and 2035
  • Figure 62: Western Europe Market Y-o-Y Growth Comparison by Sales Channel, 2025-2035
  • Figure 63: Western Europe Market Attractiveness Analysis by Sales Channel
  • Figure 64: Eastern Europe Market Value Share and BPS Analysis by Country, 2025 and 2035
  • Figure 65: Eastern Europe Market Value Share and BPS Analysis by Product Type, 2025 and 2035
  • Figure 66: Eastern Europe Market Y-o-Y Growth Comparison by Product Type, 2025-2035
  • Figure 67: Eastern Europe Market Attractiveness Analysis by Product Type
  • Figure 68: Eastern Europe Market Value Share and BPS Analysis by Livestock Type, 2025 and 2035
  • Figure 69: Eastern Europe Market Y-o-Y Growth Comparison by Livestock Type, 2025-2035
  • Figure 70: Eastern Europe Market Attractiveness Analysis by Livestock Type
  • Figure 71: Eastern Europe Market Value Share and BPS Analysis by Category Type, 2025 and 2035
  • Figure 72: Eastern Europe Market Y-o-Y Growth Comparison by Category Type, 2025-2035
  • Figure 73: Eastern Europe Market Attractiveness Analysis by Category Type
  • Figure 74: Eastern Europe Market Value Share and BPS Analysis by Sales Channel, 2025 and 2035
  • Figure 75: Eastern Europe Market Y-o-Y Growth Comparison by Sales Channel, 2025-2035
  • Figure 76: Eastern Europe Market Attractiveness Analysis by Sales Channel
  • Figure 77: East Asia Market Value Share and BPS Analysis by Country, 2025 and 2035
  • Figure 78: East Asia Market Value Share and BPS Analysis by Product Type, 2025 and 2035
  • Figure 79: East Asia Market Y-o-Y Growth Comparison by Product Type, 2025-2035
  • Figure 80: East Asia Market Attractiveness Analysis by Product Type
  • Figure 81: East Asia Market Value Share and BPS Analysis by Livestock Type, 2025 and 2035
  • Figure 82: East Asia Market Y-o-Y Growth Comparison by Livestock Type, 2025-2035
  • Figure 83: East Asia Market Attractiveness Analysis by Livestock Type
  • Figure 84: East Asia Market Value Share and BPS Analysis by Category Type, 2025 and 2035
  • Figure 85: East Asia Market Y-o-Y Growth Comparison by Category Type, 2025-2035
  • Figure 86: East Asia Market Attractiveness Analysis by Category Type
  • Figure 87: East Asia Market Value Share and BPS Analysis by Sales Channel, 2025 and 2035
  • Figure 88: East Asia Market Y-o-Y Growth Comparison by Sales Channel, 2025-2035
  • Figure 89: East Asia Market Attractiveness Analysis by Sales Channel
  • Figure 90: South Asia & Pacific Market Value Share and BPS Analysis by Country, 2025 and 2035
  • Figure 91: South Asia & Pacific Market Value Share and BPS Analysis by Product Type, 2025 and 2035
  • Figure 92: South Asia & Pacific Market Y-o-Y Growth Comparison by Product Type, 2025-2035
  • Figure 93: South Asia & Pacific Market Attractiveness Analysis by Product Type
  • Figure 94: South Asia & Pacific Market Value Share and BPS Analysis by Livestock Type, 2025 and 2035
  • Figure 95: South Asia & Pacific Market Y-o-Y Growth Comparison by Livestock Type, 2025-2035
  • Figure 96: South Asia & Pacific Market Attractiveness Analysis by Livestock Type
  • Figure 97: South Asia & Pacific Market Value Share and BPS Analysis by Category Type, 2025 and 2035
  • Figure 98: South Asia & Pacific Market Y-o-Y Growth Comparison by Category Type, 2025-2035
  • Figure 99: South Asia & Pacific Market Attractiveness Analysis by Category Type
  • Figure 100: South Asia & Pacific Market Value Share and BPS Analysis by Sales Channel, 2025 and 2035
  • Figure 101: South Asia & Pacific Market Y-o-Y Growth Comparison by Sales Channel, 2025-2035
  • Figure 102: South Asia & Pacific Market Attractiveness Analysis by Sales Channel
  • Figure 103: Middle East and Africa Market Value Share and BPS Analysis by Country, 2025 and 2035
  • Figure 104: Middle East and Africa Market Value Share and BPS Analysis by Product Type, 2025 and 2035
  • Figure 105: Middle East and Africa Market Y-o-Y Growth Comparison by Product Type, 2025-2035
  • Figure 106: Middle East and Africa Market Attractiveness Analysis by Product Type
  • Figure 107: Middle East and Africa Market Value Share and BPS Analysis by Livestock Type, 2025 and 2035
  • Figure 108: Middle East and Africa Market Y-o-Y Growth Comparison by Livestock Type, 2025-2035
  • Figure 109: Middle East and Africa Market Attractiveness Analysis by Livestock Type
  • Figure 110: Middle East and Africa Market Value Share and BPS Analysis by Category Type, 2025 and 2035
  • Figure 111: Middle East and Africa Market Y-o-Y Growth Comparison by Category Type, 2025-2035
  • Figure 112: Middle East and Africa Market Attractiveness Analysis by Category Type
  • Figure 113: Middle East and Africa Market Value Share and BPS Analysis by Sales Channel, 2025 and 2035
  • Figure 114: Middle East and Africa Market Y-o-Y Growth Comparison by Sales Channel, 2025-2035
  • Figure 115: Middle East and Africa Market Attractiveness Analysis by Sales Channel
  • Figure 116: Global Market - Tier Structure Analysis
  • Figure 117: Global Market - Company Share Analysis

Frequently Asked Questions

What is the estimated market size of the beet pulp industry in 2025?

The industry is valued at USD 325.3 million in 2025.

What is the projected industry size of the beet pulp industry by 2035?

It is forecasted to reach USD 702.9 million by 2035.

What is the expected CAGR for the beet pulp industry between 2025 and 2035?

The industry is anticipated to grow at a CAGR of 8% during this period.

Which segment is expected to lead the beet pulp market in 2025?

Molassed beet pulp are projected to lead the market with a 61.2% share in 2025.

Which region is expected to witness the highest growth in the beet pulp market?

Asia Pacific, particularly India, is expected to be the key growth region with a projected growth rate of 11.0%.

Explore Similar Insights

Future Market Insights

Beet Pulp Market