Beet Sugar Market Size, Share, and Forecast Outlook 2025 to 2035

The global beet sugar market is valued at USD 4.8 billion in 2025 and is projected to reach USD 8.2 billion by 2035, growing at a CAGR of 5.4%. Growth is anticipated to be driven by changing consumer sentiment toward cane sugar alternatives, combined with increasing demand from confectionery and pharmaceutical sectors.
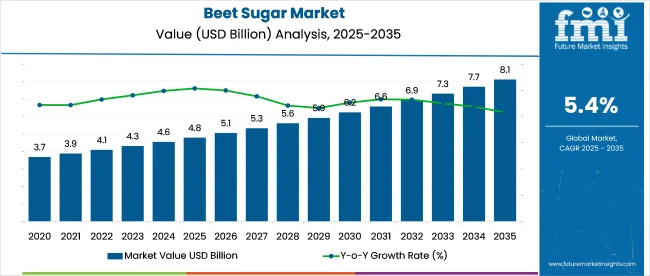
Quick Stats in Beet Sugar Market

  • Market Size (2025): USD 4.8 billion
  • Market Forecast (2035): USD 8.2 billion
  • CAGR (2025 to 2035): 5.4%
  • Top Product Type Segment: White Sugar (68.9% share in 2025)
  • Leading Form Segment: Powder (29.7% share in 2025)
  • Top Growing Country: India (5.8% CAGR)

Beet Sugar Market Market Value Analysis

Attributes Description
Estimated Industry Size (2025E) USD 4.8 billion
Projected Industry Value (2035F) USD 8.2 billion
Value-based CAGR (2025 to 2035) 5.4%

In Europe, average beet yields have crossed 31 tons per hectare in 2024, supported by precision farming and favorable climate cycles. North American cooperatives now supply over half of domestic sugar needs through beet production. Non-GMO and organic beet sugar is gaining traction, especially in clean-label food and beverage segments, with premium variants capturing over 10% of specialty sugar sales in the EU.

Energy-efficient crystallization and water reuse systems have reduced processing costs by around 15%, improving margins for refiners. In Asia, beet sugar imports are rising steadily as urbanization fuels demand for consistent-quality sweeteners in bakery and drink formulations. As buyers look for traceable, climate-resilient sources, beet sugar is emerging as a preferred alternative to cane in both bulk and specialty applications.

As of 2025, the beet sugar market is estimated to hold a steady presence across several global industries. Around 20% of the total global sugar production is contributed by beet sugar, with cultivation concentrated in regions such as Europe and North America. Within the sweeteners market, a share of nearly 18-20% is maintained by beet sugar, supported by its use as a natural alternative to cane and synthetic options.

Approximately 5-7% of the food and beverage ingredients market is occupied by beet sugar, largely due to its application in confectionery, bakery, and soft drinks. In the agricultural commodities market, a contribution of close to 10% is recorded. The processed food market sees beet sugar accounting for nearly 3-4%.

Analyzing Beet Sugar Market by Top Investment Segments

The beet sugar market is witnessing strong momentum across key segments including white sugar, powdered form, bakery applications, and conventional nature. Growth is driven by rising demand for refined sweeteners, processed foods, and premium baked goods.
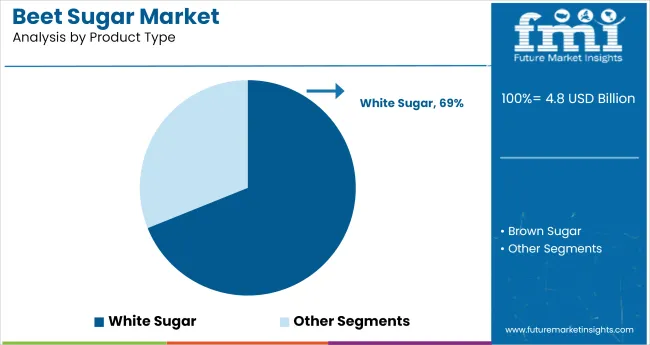
White Sugar Sets the Benchmark in Product Type with 68.9% Market Share

Beet Sugar Market Analysis By Product Type

White sugar is projected to account for 68.9% of the total beet sugar market share by 2025. It remains the industry standard for refined sweetness and is widely used in food processing, beverages, and confectionery. Its neutral flavor, long shelf life, and high solubility make it a staple across industrial and domestic applications.

  • Manufacturers in confectionery and dairy sectors rely on white beet sugar for standardized sweetness and texture.
  • Consistent supply from major beet-producing regions, especially in Europe, supports bulk procurement.
  • High refining efficiency and stable pricing make it attractive for high-volume operations and packaged foods.

Powdered Sugar to Dominate Form Segment with 29.7% Share

Powdered sugar is forecasted to lead the form segment, holding 29.7% of the global beet sugar market by 2025. Its fine texture and quick solubility make it the go-to ingredient for frostings, icings, and desserts. The segment is gaining traction as demand grows for visually appealing bakery and confectionery products.

  • Food processors prefer powdered sugar for its smooth texture and ability to blend uniformly in mixes.
  • High adoption is noted in premium bakery chains across North America and Western Europe.
  • Expanding consumption of decorated desserts and artisan pastries supports long-term segment growth.

Bakery Products to Drive Application Demand with 28% Market Share

Bakery products are expected to dominate the application segment, securing 28% of the global market share by 2025. From commercial bakeries to artisanal brands, beet sugar plays a central role in shaping flavor, structure, and color of baked goods. Demand is bolstered by increased snacking and indulgence behavior worldwide.

  • Sweeteners like beet sugar enhance dough fermentation and browning in bread and pastries.
  • Leading food brands are launching ready-to-bake lines that rely heavily on fine beet sugar.
  • Cross-regional popularity of muffins, cakes, and cookies is fueling sustained application growth.

Conventional Beet Sugar to Command Nature Segment with 89% Share

Conventional beet sugar is set to lead the nature category, representing 89% of the total market by 2025. Widespread availability, lower costs, and established supply chains ensure its dominance in both food processing and consumer markets. Growth is particularly strong in developing economies seeking affordable sweetener options.

  • High scalability and cost-effectiveness make conventional sugar ideal for mass-market food production.
  • Emerging markets continue to prioritize affordability, supporting traditional beet sugar consumption.
  • Global brands are increasing their conventional sourcing contracts to maintain pricing flexibility in fluctuating commodity markets.

Top Beet Sugar Market Dynamics

The market is advancing steadily as localized production gains preference over cane imports in temperate regions. In 2024, over 37% of Europe’s total sugar output came from sugar beets, with key producers in France, Germany, and Russia scaling up investments in yield-optimized beet varieties and efficient processing systems.

Increased Production in Europe, Central Asia, and North America

Regional self-sufficiency targets and subsidy-backed beet cultivation are supporting output growth. In the USA, over 56% of domestically produced sugar in 2023 came from beets, with processing plants in Minnesota and North Dakota operating year-round. Uzbekistan and Kazakhstan are also investing in beet sugar plants to reduce cane sugar dependency.

  • Used as a cane alternative in markets with cooler climates and shorter growing seasons.
  • Backed by government subsidies and tariff protection in the EU and CIS nations.
  • Adopted in confectionery and beverage industries due to high purity and lighter color.

Efficiency Gains in Beet Processing and Co-Product Recovery

Modern extraction lines are yielding more sugar per hectare through energy recovery systems and optimized crystallization stages. In 2024, over 40% of beet sugar mills globally integrated co-product systems to recover molasses, beet pulp, and bioethanol. European producers are leveraging anaerobic digesters to generate biogas from beet waste.
  • Beet pulp repurposed as livestock feed and bio-compost across Europe.
  • Molasses extracted for use in fermentation and alcohol distillation sectors.
  • Energy-efficient diffusers and continuous evaporators installed in new plants.

Top Countries Cultivating, Processing, and Accelerating Demand in the Beet Sugar Market

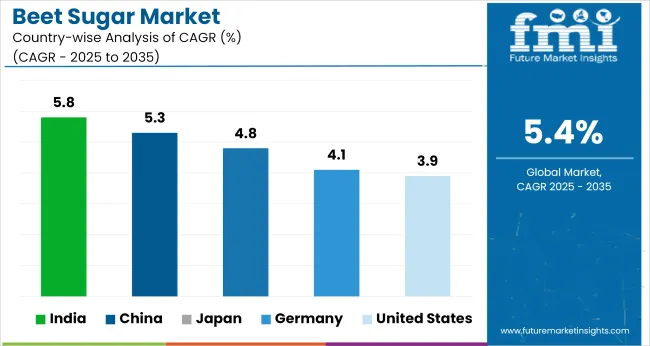
Beet Sugar Market Cagr Analysis By Country

Country CAGR (2025 to 2035)
India 5.8%
China 5.3%
Japan 4.8%
Germany 4.1%
USA 3.9%

The global market is projected to grow at a 5.4% CAGR between 2025 and 2035, yet growth diverges significantly across BRICS, ASEAN, and OECD economies based on agronomic conditions and processing modernization. India, with a 5.8% CAGR, outpaces the global average as BRICS-aligned states push for water-resilient beet crops over traditional cane.

Hybrid seed deployment and rising private mill investments in Maharashtra are lifting yields beyond 65 tons per hectare. China, growing at 5.3%, remains just below the global pace, with Inner Mongolia and Heilongjiang accounting for nearly 70% of output, supported by subsidies on automated beet harvesters.

Japan posts a 4.8% CAGR, driven by Hokkaido’s precision-farming clusters but constrained by high labor costs. In contrast, OECD leaders like Germany (4.1%) and the USA (3.9%) lag due to rigid sustainability regulations and legacy processing systems. This gap signals market concentration shifting toward Asia’s beet-intensive, yield-efficient zones.

The report provides insights across 40+ countries. The five below are highlighted for their strategic influence and growth trajectory.

Beet Sugar Market Trends in India

The market in India is projected to expand at a CAGR of 5.8% through 2035. Driven by climate-related risks to cane production, northern states like Punjab and Uttar Pradesh are turning to sugar beet as a water-efficient crop alternative. ISMA-supported pilot programs are demonstrating high-yield varieties with lower input costs. Food processors are sourcing beet sugar for confectionery and bakery applications, especially in tier-1 cities. Investment is increasing in decentralized crushing units designed for flexible crop processing windows.

  • Punjab and UP expanding beet acreage to combat water stress
  • Decentralized plants processing sugar beet for local supply chains
  • Confectionery sector adopting beet sugar in urban markets

Demand Outlook for Beet Sugar in China

China is forecast to grow at a CAGR of 5.3% through 2035. The Xinjiang region remains the production hub, contributing over 60% of national beet output. Policy shifts favoring reduced cane sugar imports are encouraging localized beet sugar processing. COFCO and other state-linked processors are upgrading crystallization and filtration systems to meet refined sugar standards. Domestic beverage and instant food manufacturers are incorporating beet sugar as a traceable, non-GMO sweetener option in their product lines.

  • Xinjiang producing majority of China’s sugar beet output
  • COFCO upgrading refining tech for premium food-grade beet sugar
  • Domestic brands favoring traceable, non-GMO sweetener inputs

Beet Sugar Market Expansion in Japan

Japan’s market is projected to grow at a CAGR of 4.8% through 2035. Hokkaido accounts for nearly all domestic production, supported by government subsidies under Japan’s food security program. The processed food sector is adopting beet sugar in response to rising demand for locally sourced, clean-label ingredients. Japanese refiners are offering specialty beet-derived sugars for functional foods and baby nutrition. Growth is also driven by seasonal confectionery and premium beverage blends featuring domestic sweetener sourcing.

  • Hokkaido-based production backed by food security incentives
  • Functional food brands adopting beet sugar in baby and health categories
  • Premium beverages and confections using regional, label-friendly sugar

Beet Sugar Demand Forecast in Germany

Germany is expected to grow at a CAGR of 4.1% during the forecast period. As Europe’s largest beet sugar producer, Germany continues to invest in precision agriculture and automated beet harvesting systems. Südzucker and Nordzucker are optimizing energy efficiency and bioethanol integration at processing facilities. Clean-label food manufacturers in the EU are increasingly sourcing domestically refined beet sugar for organic and sustainable product lines. Beet pulp byproducts are also seeing demand in livestock feed and bioplastics.

  • Leading processors advancing energy and process efficiency
  • Clean-label food trends driving demand for domestic beet sugar
  • Beet pulp valorized in bioplastics and animal feed chains

Market Outlook for Beet Sugar in the United States

The USA market is projected to grow at a CAGR of 3.9% through 2035. North Dakota, Minnesota, and Idaho lead production under cooperative models that ensure grower profitability. Sustainability pressures and GMO scrutiny are encouraging refiners to promote non-GMO beet varieties and eco-certified processing. Food manufacturers are turning to beet sugar as a stable-price sweetener amid cane price volatility. Retailers are also stocking more private-label goods sweetened with USA-sourced beet sugar.
  • Northern Plains cooperatives supporting stable domestic supply
  • Non-GMO and eco-certification strategies influencing buyer choice
  • Retail chains increasing private-label offerings using beet sugar

Leading Beet Sugar Producers

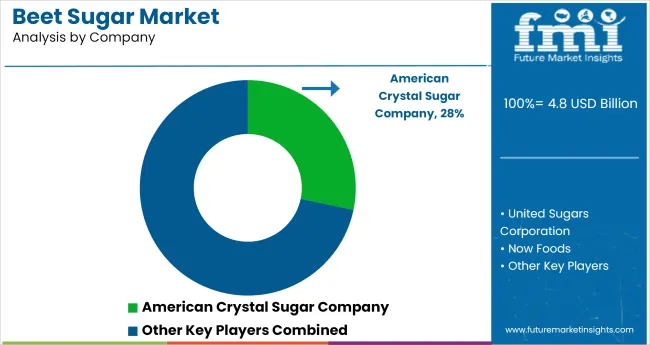
Beet Sugar Market Analysis By Company

The industry is moderately consolidated, with clear performance differentials among key players. American Crystal Sugar Company dominates the USA with annual production exceeding 3 million tons, backed by 2,800 grower-shareholders and seven factories. United Sugars Corporation, co-owned by Crystal, Cargill, and Minn-Dak, leads in industrial beet sugar distribution, supplying over 25% of the USA market’s ingredient-grade sugar.

In Europe, British Sugar processes over 8 million tons of sugar beet annually and supplies nearly 50% of the UK's sugar needs. Cosun Beet Company emphasizes climate-neutral production by 2030 and leads the EU in sugar beet ethanol integration. Michigan Sugar Company, with its Pioneer® brand, competes in regional markets via retail penetration and processing plant upgrades.

Recent Beet Sugar Industry News

In July 2024, British Sugar and NFU Sugar finalized a flexible contract for the 2025/26 crop priced between £33 and £30.70 per ton. The agreement boosts grower confidence, secures long-term beet supply, and strengthens sourcing strategies amid increasing volatility in European beet sugar production and pricing structures.

Leading Players in Beet Sugar Market

  • American Crystal Sugar Company
  • United Sugars Corporation
  • Now Foods
  • Domino Sugar
  • Michigan Sugar Company
  • Amalgamated Sugar Company
  • Southern Minnesota Cooperative
  • Western Sugar Cooperative
  • Longmont Sugar Company
  • Cosun Beet Company
  • British Sugar
  • Associated British Foods plc (ABF)

Report Coverage and Scope Summary

Report Attributes Details
Market Size (2025) USD 4.8 billion
Projected Market Size (2035) USD 8.2 billion
CAGR (2025 to 2035) 5.4%
Base Year for Estimation 2024
Historical Period 2020 to 2024
Projections Period 2025 to 2035
Quantitative Units USD billion for market value
Product Types Analyzed (Segment 1) White Sugar, Brown Sugar
Forms Analyzed (Segment 2) Granulated Sugar, Powdered Sugar, Liquid Sugar
Applications Analyzed (Segment 3) Dairy Products, Bakery Products, Beverages, Confectionery Products, Dietary Supplements, Snacks, Others (Electrolyte Mixes, Pharmaceuticals)
Nature Analyzed (Segment 4) Organic, Conventional
Regions Covered North America, Latin America, Western Europe, Eastern Europe, East Asia, South Asia & Pacific, Central Asia, Russia & Belarus, Balkan & Baltic Countries, Middle East & Africa
Countries Covered United States, Canada, Germany, United Kingdom, France, Japan, China, India, South Korea, Brazil
Key Players American Crystal Sugar Company, United Sugars Corporation, Now Foods, Domino Sugar, Michigan Sugar Company, Amalgamated Sugar Company, Southern Minnesota Cooperative, Western Sugar Cooperative, Longmont Sugar Company, Cosun Beet Company, British Sugar, Associated British Foods plc (ABF)
Additional Attributes Dollar sales by product and form, rising demand for natural sweeteners, increased use in functional food and beverage categories, and growing availability of organic beet sugar across retail channels.

Top Segments Studied in the Beet Sugar Market

By Product Type:

This segment is categorized into white sugar and brown sugar.

By Form:

This segment is categorized into granulated sugar, powdered sugar, and liquid sugar.

By Application:

This segment is categorized into dairy products, bakery products, beverages, confectionery products, dietary supplements, snacks, and others, which include electrolyte mixes and pharmaceuticals.

By Nature:

This segment is categorized into organic and conventional.

By Region:

The market is segmented as North America, Latin America, Western Europe, Eastern Europe, East Asia, South Asia & Pacific, Central Asia, Russia and Belarus, Balkan & Baltic Countries, Middle East and Africa.

Table of Content

  1. Executive Summary
    • Global Market Outlook
    • Demand-side Trends
    • Supply-side Trends
    • Technology Roadmap Analysis
    • Analysis and Recommendations
  2. Market Overview
    • Market Coverage / Taxonomy
    • Market Definition / Scope / Limitations
  3. Market Background
    • Market Dynamics
      • Drivers
      • Restraints
      • Opportunity
      • Trends
    • Scenario Forecast
      • Demand in Optimistic Scenario
      • Demand in Likely Scenario
      • Demand in Conservative Scenario
    • Opportunity Map Analysis
    • Product Life Cycle Analysis
    • Supply Chain Analysis
      • Supply Side Participants and their Roles
        • Producers
        • Mid-Level Participants (Traders/ Agents/ Brokers)
        • Wholesalers and Distributors
      • Value Added and Value Created at Node in the Supply Chain
      • List of Raw Material Suppliers
      • List of Existing and Potential Buyer’s
    • Investment Feasibility Matrix
    • Value Chain Analysis
      • Profit Margin Analysis
      • Wholesalers and Distributors
      • Retailers
    • PESTLE and Porter’s Analysis
    • Regulatory Landscape
      • By Key Regions
      • By Key Countries
    • Regional Parent Market Outlook
    • Production and Consumption Statistics
    • Import and Export Statistics
  4. Global Market Analysis 2020 to 2024 and Forecast, 2025 to 2035
    • Historical Market Size Value (USD Billion) & Volume (MT) Analysis, 2020 to 2024
    • Current and Future Market Size Value (USD Billion) & Volume (MT) Projections, 2025 to 2035
      • Y-o-Y Growth Trend Analysis
      • Absolute $ Opportunity Analysis
  5. Global Market Pricing Analysis 2020 to 2024 and Forecast 2025 to 2035
  6. Global Market Analysis 2020 to 2024 and Forecast 2025 to 2035, By Product Type
    • Introduction / Key Findings
    • Historical Market Size Value (USD Billion) & Volume (MT) Analysis By Product Type, 2020 to 2024
    • Current and Future Market Size Value (USD Billion) & Volume (MT) Analysis and Forecast By Product Type, 2025 to 2035
      • White Sugar
      • Brown Sugar
    • Y-o-Y Growth Trend Analysis By Product Type, 2020 to 2024
    • Absolute $ Opportunity Analysis By Product Type, 2025 to 2035
  7. Global Market Analysis 2020 to 2024 and Forecast 2025 to 2035, By Form
    • Introduction / Key Findings
    • Historical Market Size Value (USD Billion) & Volume (MT) Analysis By Form, 2020 to 2024
    • Current and Future Market Size Value (USD Billion) & Volume (MT) Analysis and Forecast By Form, 2025 to 2035
      • Granulated Sugar
      • Powdered Sugar
      • Liquid Sugar
    • Y-o-Y Growth Trend Analysis By Form, 2020 to 2024
    • Absolute $ Opportunity Analysis By Form, 2025 to 2035
  8. Global Market Analysis 2020 to 2024 and Forecast 2025 to 2035, By Application
    • Introduction / Key Findings
    • Historical Market Size Value (USD Billion) & Volume (MT) Analysis By Application, 2020 to 2024
    • Current and Future Market Size Value (USD Billion) & Volume (MT) Analysis and Forecast By Application, 2025 to 2035
      • Dairy Products
      • Bakery Products
      • Beverages
      • Confectionery Products
      • Dietary Supplements
      • Snacks
      • Others
        • Electrolyte Mixes
        • Pharmaceuticals
    • Y-o-Y Growth Trend Analysis By Application, 2020 to 2024
    • Absolute $ Opportunity Analysis By Application, 2025 to 2035
  9. Global Market Analysis 2020 to 2024 and Forecast 2025 to 2035, By Nature
    • Introduction / Key Findings
    • Historical Market Size Value (USD Billion) & Volume (MT) Analysis By Nature, 2020 to 2024
    • Current and Future Market Size Value (USD Billion) & Volume (MT) Analysis and Forecast By Nature, 2025 to 2035
      • Organic
      • Conventional
    • Y-o-Y Growth Trend Analysis By Nature, 2020 to 2024
    • Absolute $ Opportunity Analysis By Nature, 2025 to 2035
  10. Global Market Analysis 2020 to 2024 and Forecast 2025 to 2035, By Region
    • Introduction
    • Historical Market Size Value (USD Billion) & Volume (MT) Analysis By Region, 2020 to 2024
    • Current Market Size Value (USD Billion) & Volume (MT) Analysis and Forecast By Region, 2025 to 2035
      • North America
      • Latin America
      • Western Europe
      • Eastern Europe
      • East Asia
      • South Asia & Pacific
      • Middle East and Africa
    • Market Attractiveness Analysis By Region
  11. North America Market Analysis 2020 to 2024 and Forecast 2025 to 2035, By Country
    • Historical Market Size Value (USD Billion) & Volume (MT) Trend Analysis By Market Taxonomy, 2020 to 2024
    • Market Size Value (USD Billion) & Volume (MT) Forecast By Market Taxonomy, 2025 to 2035
      • By Country
        • USA
        • Canada
        • Mexico
      • By Product Type
      • By Form
      • By Application
      • By Nature
    • Market Attractiveness Analysis
      • By Country
      • By Product Type
      • By Form
      • By Application
      • By Nature
    • Key Takeaways
  12. Latin America Market Analysis 2020 to 2024 and Forecast 2025 to 2035, By Country
    • Historical Market Size Value (USD Billion) & Volume (MT) Trend Analysis By Market Taxonomy, 2020 to 2024
    • Market Size Value (USD Billion) & Volume (MT) Forecast By Market Taxonomy, 2025 to 2035
      • By Country
        • Brazil
        • Argentina
        • Rest of LATAM
      • By Product Type
      • By Form
      • By Application
      • By Nature
    • Market Attractiveness Analysis
      • By Country
      • By Product Type
      • By Form
      • By Application
      • By Nature
    • Key Takeaways
  13. Western Europe Market Analysis 2020 to 2024 and Forecast 2025 to 2035, By Country
    • Historical Market Size Value (USD Billion) & Volume (MT) Trend Analysis By Market Taxonomy, 2020 to 2024
    • Market Size Value (USD Billion) & Volume (MT) Forecast By Market Taxonomy, 2025 to 2035
      • By Country
        • Germany
        • Italy
        • France
        • UK
        • Spain
        • BENELUX
        • Nordic
        • Rest of W.Europe
      • By Product Type
      • By Form
      • By Application
      • By Nature
    • Market Attractiveness Analysis
      • By Country
      • By Product Type
      • By Form
      • By Application
      • By Nature
    • Key Takeaways
  14. Eastern Europe Market Analysis 2020 to 2024 and Forecast 2025 to 2035, By Country
    • Historical Market Size Value (USD Billion) & Volume (MT) Trend Analysis By Market Taxonomy, 2020 to 2024
    • Market Size Value (USD Billion) & Volume (MT) Forecast By Market Taxonomy, 2025 to 2035
      • By Country
        • Russia
        • Hungary
        • Poland
        • Balkan & Baltics
        • Rest of E. Europe
      • By Product Type
      • By Form
      • By Application
      • By Nature
    • Market Attractiveness Analysis
      • By Country
      • By Product Type
      • By Form
      • By Application
      • By Nature
    • Key Takeaways
  15. East Asia Market Analysis 2020 to 2024 and Forecast 2025 to 2035, By Country
    • Historical Market Size Value (USD Billion) & Volume (MT) Trend Analysis By Market Taxonomy, 2020 to 2024
    • Market Size Value (USD Billion) & Volume (MT) Forecast By Market Taxonomy, 2025 to 2035
      • By Country
        • China
        • Japan
        • South Korea
      • By Product Type
      • By Form
      • By Application
      • By Nature
    • Market Attractiveness Analysis
      • By Country
      • By Product Type
      • By Form
      • By Application
      • By Nature
    • Key Takeaways
  16. South Asia & Pacific Market Analysis 2020 to 2024 and Forecast 2025 to 2035, By Country
    • Historical Market Size Value (USD Billion) & Volume (MT) Trend Analysis By Market Taxonomy, 2020 to 2024
    • Market Size Value (USD Billion) & Volume (MT) Forecast By Market Taxonomy, 2025 to 2035
      • By Country
        • India
        • Australia & New Zealand
        • ASEAN
        • Rest of SAP
      • By Product Type
      • By Form
      • By Application
      • By Nature
    • Market Attractiveness Analysis
      • By Country
      • By Product Type
      • By Form
      • By Application
      • By Nature
    • Key Takeaways
  17. Middle East and Africa Market Analysis 2020 to 2024 and Forecast 2025 to 2035, By Country
    • Historical Market Size Value (USD Billion) & Volume (MT) Trend Analysis By Market Taxonomy, 2020 to 2024
    • Market Size Value (USD Billion) & Volume (MT) Forecast By Market Taxonomy, 2025 to 2035
      • By Country
        • GCC Countries
        • Northern Africa
        • South Africa
        • Turkiye
        • Rest of MEA
      • By Product Type
      • By Form
      • By Application
      • By Nature
    • Market Attractiveness Analysis
      • By Country
      • By Product Type
      • By Form
      • By Application
      • By Nature
    • Key Takeaways
  18. Key Countries Market Analysis
    • USA
      • Pricing Analysis
      • Market Share Analysis, 2024
        • By Product Type
        • By Form
        • By Application
        • By Nature
    • Canada
      • Pricing Analysis
      • Market Share Analysis, 2024
        • By Product Type
        • By Form
        • By Application
        • By Nature
    • Brazil
      • Pricing Analysis
      • Market Share Analysis, 2024
        • By Product Type
        • By Form
        • By Application
        • By Nature
    • Mexico
      • Pricing Analysis
      • Market Share Analysis, 2024
        • By Product Type
        • By Form
        • By Application
        • By Nature
    • Argentina
      • Pricing Analysis
      • Market Share Analysis, 2024
        • By Product Type
        • By Form
        • By Application
        • By Nature
  19. Market Structure Analysis
    • Competition Dashboard
    • Competition Benchmarking
    • Market Share Analysis of Top Players
      • By Regional
      • By Product Type
      • By Form
      • By Application
      • By Nature
  20. Competition Analysis
    • Competition Deep Dive
      • American Crystal Sugar Company
        • Overview
        • Product Portfolio
        • Profitability by Market Segments (Product/Age /Sales Channel/Region)
        • Sales Footprint
        • Strategy Overview
          • Marketing Strategy
          • Product Strategy
          • Channel Strategy
      • Value (USD Billion) & Volume (MT)ed Sugars Corporation
        • Overview
        • Product Portfolio
        • Profitability by Market Segments (Product/Age /Sales Channel/Region)
        • Sales Footprint
        • Strategy Overview
          • Marketing Strategy
          • Product Strategy
          • Channel Strategy
      • Now Foods
        • Overview
        • Product Portfolio
        • Profitability by Market Segments (Product/Age /Sales Channel/Region)
        • Sales Footprint
        • Strategy Overview
          • Marketing Strategy
          • Product Strategy
          • Channel Strategy
      • Domino Sugar
        • Overview
        • Product Portfolio
        • Profitability by Market Segments (Product/Age /Sales Channel/Region)
        • Sales Footprint
        • Strategy Overview
          • Marketing Strategy
          • Product Strategy
          • Channel Strategy
      • Michigan Sugar Company
        • Overview
        • Product Portfolio
        • Profitability by Market Segments (Product/Age /Sales Channel/Region)
        • Sales Footprint
        • Strategy Overview
          • Marketing Strategy
          • Product Strategy
          • Channel Strategy
      • Amalgamated Sugar Company
        • Overview
        • Product Portfolio
        • Profitability by Market Segments (Product/Age /Sales Channel/Region)
        • Sales Footprint
        • Strategy Overview
          • Marketing Strategy
          • Product Strategy
          • Channel Strategy
      • Southern Minnesota Cooperative
        • Overview
        • Product Portfolio
        • Profitability by Market Segments (Product/Age /Sales Channel/Region)
        • Sales Footprint
        • Strategy Overview
          • Marketing Strategy
          • Product Strategy
          • Channel Strategy
      • Western Sugar Cooperative
        • Overview
        • Product Portfolio
        • Profitability by Market Segments (Product/Age /Sales Channel/Region)
        • Sales Footprint
        • Strategy Overview
          • Marketing Strategy
          • Product Strategy
          • Channel Strategy
      • Longmont Sugar Company
        • Overview
        • Product Portfolio
        • Profitability by Market Segments (Product/Age /Sales Channel/Region)
        • Sales Footprint
        • Strategy Overview
          • Marketing Strategy
          • Product Strategy
          • Channel Strategy
      • Cosun Beet Company
        • Overview
        • Product Portfolio
        • Profitability by Market Segments (Product/Age /Sales Channel/Region)
        • Sales Footprint
        • Strategy Overview
          • Marketing Strategy
          • Product Strategy
          • Channel Strategy
      • British Sugar
        • Overview
        • Product Portfolio
        • Profitability by Market Segments (Product/Age /Sales Channel/Region)
        • Sales Footprint
        • Strategy Overview
          • Marketing Strategy
          • Product Strategy
          • Channel Strategy
      • Associated British Foods plc (ABF)
        • Overview
        • Product Portfolio
        • Profitability by Market Segments (Product/Age /Sales Channel/Region)
        • Sales Footprint
        • Strategy Overview
          • Marketing Strategy
          • Product Strategy
          • Channel Strategy
  21. Assumptions & Acronyms Used
  22. Research Methodology

List of Tables

  • Table 1: Global Market Value (USD Billion) Forecast by Region, 2020-2035
  • Table 2: Global Market Volume (MT) Forecast by Region, 2020-2035
  • Table 3: Global Market Value (USD Billion) Forecast by Product Type, 2020-2035
  • Table 4: Global Market Volume (MT) Forecast by Product Type, 2020-2035
  • Table 5: Global Market Value (USD Billion) Forecast by Form, 2020-2035
  • Table 6: Global Market Volume (MT) Forecast by Form, 2020-2035
  • Table 7: Global Market Value (USD Billion) Forecast by Application, 2020-2035
  • Table 8: Global Market Volume (MT) Forecast by Application, 2020-2035
  • Table 9: Global Market Value (USD Billion) Forecast by Nature, 2020-2035
  • Table 10: Global Market Volume (MT) Forecast by Nature, 2020-2035
  • Table 11: North America Market Value (USD Billion) Forecast by Country, 2020-2035
  • Table 12: North America Market Volume (MT) Forecast by Country, 2020-2035
  • Table 13: North America Market Value (USD Billion) Forecast by Product Type, 2020-2035
  • Table 14: North America Market Volume (MT) Forecast by Product Type, 2020-2035
  • Table 15: North America Market Value (USD Billion) Forecast by Form, 2020-2035
  • Table 16: North America Market Volume (MT) Forecast by Form, 2020-2035
  • Table 17: North America Market Value (USD Billion) Forecast by Application, 2020-2035
  • Table 18: North America Market Volume (MT) Forecast by Application, 2020-2035
  • Table 19: North America Market Value (USD Billion) Forecast by Nature, 2020-2035
  • Table 20: North America Market Volume (MT) Forecast by Nature, 2020-2035
  • Table 21: Latin America Market Value (USD Billion) Forecast by Country, 2020-2035
  • Table 22: Latin America Market Volume (MT) Forecast by Country, 2020-2035
  • Table 23: Latin America Market Value (USD Billion) Forecast by Product Type, 2020-2035
  • Table 24: Latin America Market Volume (MT) Forecast by Product Type, 2020-2035
  • Table 25: Latin America Market Value (USD Billion) Forecast by Form, 2020-2035
  • Table 26: Latin America Market Volume (MT) Forecast by Form, 2020-2035
  • Table 27: Latin America Market Value (USD Billion) Forecast by Application, 2020-2035
  • Table 28: Latin America Market Volume (MT) Forecast by Application, 2020-2035
  • Table 29: Latin America Market Value (USD Billion) Forecast by Nature, 2020-2035
  • Table 30: Latin America Market Volume (MT) Forecast by Nature, 2020-2035
  • Table 31: Western Europe Market Value (USD Billion) Forecast by Country, 2020-2035
  • Table 32: Western Europe Market Volume (MT) Forecast by Country, 2020-2035
  • Table 33: Western Europe Market Value (USD Billion) Forecast by Product Type, 2020-2035
  • Table 34: Western Europe Market Volume (MT) Forecast by Product Type, 2020-2035
  • Table 35: Western Europe Market Value (USD Billion) Forecast by Form, 2020-2035
  • Table 36: Western Europe Market Volume (MT) Forecast by Form, 2020-2035
  • Table 37: Western Europe Market Value (USD Billion) Forecast by Application, 2020-2035
  • Table 38: Western Europe Market Volume (MT) Forecast by Application, 2020-2035
  • Table 39: Western Europe Market Value (USD Billion) Forecast by Nature, 2020-2035
  • Table 40: Western Europe Market Volume (MT) Forecast by Nature, 2020-2035
  • Table 41: Eastern Europe Market Value (USD Billion) Forecast by Country, 2020-2035
  • Table 42: Eastern Europe Market Volume (MT) Forecast by Country, 2020-2035
  • Table 43: Eastern Europe Market Value (USD Billion) Forecast by Product Type, 2020-2035
  • Table 44: Eastern Europe Market Volume (MT) Forecast by Product Type, 2020-2035
  • Table 45: Eastern Europe Market Value (USD Billion) Forecast by Form, 2020-2035
  • Table 46: Eastern Europe Market Volume (MT) Forecast by Form, 2020-2035
  • Table 47: Eastern Europe Market Value (USD Billion) Forecast by Application, 2020-2035
  • Table 48: Eastern Europe Market Volume (MT) Forecast by Application, 2020-2035
  • Table 49: Eastern Europe Market Value (USD Billion) Forecast by Nature, 2020-2035
  • Table 50: Eastern Europe Market Volume (MT) Forecast by Nature, 2020-2035
  • Table 51: East Asia Market Value (USD Billion) Forecast by Country, 2020-2035
  • Table 52: East Asia Market Volume (MT) Forecast by Country, 2020-2035
  • Table 53: East Asia Market Value (USD Billion) Forecast by Product Type, 2020-2035
  • Table 54: East Asia Market Volume (MT) Forecast by Product Type, 2020-2035
  • Table 55: East Asia Market Value (USD Billion) Forecast by Form, 2020-2035
  • Table 56: East Asia Market Volume (MT) Forecast by Form, 2020-2035
  • Table 57: East Asia Market Value (USD Billion) Forecast by Application, 2020-2035
  • Table 58: East Asia Market Volume (MT) Forecast by Application, 2020-2035
  • Table 59: East Asia Market Value (USD Billion) Forecast by Nature, 2020-2035
  • Table 60: East Asia Market Volume (MT) Forecast by Nature, 2020-2035
  • Table 61: South Asia & Pacific Market Value (USD Billion) Forecast by Country, 2020-2035
  • Table 62: South Asia & Pacific Market Volume (MT) Forecast by Country, 2020-2035
  • Table 63: South Asia & Pacific Market Value (USD Billion) Forecast by Product Type, 2020-2035
  • Table 64: South Asia & Pacific Market Volume (MT) Forecast by Product Type, 2020-2035
  • Table 65: South Asia & Pacific Market Value (USD Billion) Forecast by Form, 2020-2035
  • Table 66: South Asia & Pacific Market Volume (MT) Forecast by Form, 2020-2035
  • Table 67: South Asia & Pacific Market Value (USD Billion) Forecast by Application, 2020-2035
  • Table 68: South Asia & Pacific Market Volume (MT) Forecast by Application, 2020-2035
  • Table 69: South Asia & Pacific Market Value (USD Billion) Forecast by Nature, 2020-2035
  • Table 70: South Asia & Pacific Market Volume (MT) Forecast by Nature, 2020-2035
  • Table 71: Middle East and Africa Market Value (USD Billion) Forecast by Country, 2020-2035
  • Table 72: Middle East and Africa Market Volume (MT) Forecast by Country, 2020-2035
  • Table 73: Middle East and Africa Market Value (USD Billion) Forecast by Product Type, 2020-2035
  • Table 74: Middle East and Africa Market Volume (MT) Forecast by Product Type, 2020-2035
  • Table 75: Middle East and Africa Market Value (USD Billion) Forecast by Form, 2020-2035
  • Table 76: Middle East and Africa Market Volume (MT) Forecast by Form, 2020-2035
  • Table 77: Middle East and Africa Market Value (USD Billion) Forecast by Application, 2020-2035
  • Table 78: Middle East and Africa Market Volume (MT) Forecast by Application, 2020-2035
  • Table 79: Middle East and Africa Market Value (USD Billion) Forecast by Nature, 2020-2035
  • Table 80: Middle East and Africa Market Volume (MT) Forecast by Nature, 2020-2035

List of Figures

  • Figure 1: Global Market Volume (MT) Forecast 2020-2035
  • Figure 2: Global Market Pricing Analysis
  • Figure 3: Global Market Value (USD Billion) Forecast 2020-2035
  • Figure 4: Global Market Value Share and BPS Analysis by Product Type, 2025 and 2035
  • Figure 5: Global Market Y-o-Y Growth Comparison by Product Type, 2025-2035
  • Figure 6: Global Market Attractiveness Analysis by Product Type
  • Figure 7: Global Market Value Share and BPS Analysis by Form, 2025 and 2035
  • Figure 8: Global Market Y-o-Y Growth Comparison by Form, 2025-2035
  • Figure 9: Global Market Attractiveness Analysis by Form
  • Figure 10: Global Market Value Share and BPS Analysis by Application, 2025 and 2035
  • Figure 11: Global Market Y-o-Y Growth Comparison by Application, 2025-2035
  • Figure 12: Global Market Attractiveness Analysis by Application
  • Figure 13: Global Market Value Share and BPS Analysis by Nature, 2025 and 2035
  • Figure 14: Global Market Y-o-Y Growth Comparison by Nature, 2025-2035
  • Figure 15: Global Market Attractiveness Analysis by Nature
  • Figure 16: Global Market Value (USD Billion) Share and BPS Analysis by Region, 2025 and 2035
  • Figure 17: Global Market Y-o-Y Growth Comparison by Region, 2025-2035
  • Figure 18: Global Market Attractiveness Analysis by Region
  • Figure 19: North America Market Incremental $ Opportunity, 2025-2035
  • Figure 20: Latin America Market Incremental $ Opportunity, 2025-2035
  • Figure 21: Western Europe Market Incremental $ Opportunity, 2025-2035
  • Figure 22: Eastern Europe Market Incremental $ Opportunity, 2025-2035
  • Figure 23: East Asia Market Incremental $ Opportunity, 2025-2035
  • Figure 24: South Asia & Pacific Market Incremental $ Opportunity, 2025-2035
  • Figure 25: Middle East and Africa Market Incremental $ Opportunity, 2025-2035
  • Figure 26: North America Market Value Share and BPS Analysis by Country, 2025 and 2035
  • Figure 27: North America Market Value Share and BPS Analysis by Product Type, 2025 and 2035
  • Figure 28: North America Market Y-o-Y Growth Comparison by Product Type, 2025-2035
  • Figure 29: North America Market Attractiveness Analysis by Product Type
  • Figure 30: North America Market Value Share and BPS Analysis by Form, 2025 and 2035
  • Figure 31: North America Market Y-o-Y Growth Comparison by Form, 2025-2035
  • Figure 32: North America Market Attractiveness Analysis by Form
  • Figure 33: North America Market Value Share and BPS Analysis by Application, 2025 and 2035
  • Figure 34: North America Market Y-o-Y Growth Comparison by Application, 2025-2035
  • Figure 35: North America Market Attractiveness Analysis by Application
  • Figure 36: North America Market Value Share and BPS Analysis by Nature, 2025 and 2035
  • Figure 37: North America Market Y-o-Y Growth Comparison by Nature, 2025-2035
  • Figure 38: North America Market Attractiveness Analysis by Nature
  • Figure 39: Latin America Market Value Share and BPS Analysis by Country, 2025 and 2035
  • Figure 40: Latin America Market Value Share and BPS Analysis by Product Type, 2025 and 2035
  • Figure 41: Latin America Market Y-o-Y Growth Comparison by Product Type, 2025-2035
  • Figure 42: Latin America Market Attractiveness Analysis by Product Type
  • Figure 43: Latin America Market Value Share and BPS Analysis by Form, 2025 and 2035
  • Figure 44: Latin America Market Y-o-Y Growth Comparison by Form, 2025-2035
  • Figure 45: Latin America Market Attractiveness Analysis by Form
  • Figure 46: Latin America Market Value Share and BPS Analysis by Application, 2025 and 2035
  • Figure 47: Latin America Market Y-o-Y Growth Comparison by Application, 2025-2035
  • Figure 48: Latin America Market Attractiveness Analysis by Application
  • Figure 49: Latin America Market Value Share and BPS Analysis by Nature, 2025 and 2035
  • Figure 50: Latin America Market Y-o-Y Growth Comparison by Nature, 2025-2035
  • Figure 51: Latin America Market Attractiveness Analysis by Nature
  • Figure 52: Western Europe Market Value Share and BPS Analysis by Country, 2025 and 2035
  • Figure 53: Western Europe Market Value Share and BPS Analysis by Product Type, 2025 and 2035
  • Figure 54: Western Europe Market Y-o-Y Growth Comparison by Product Type, 2025-2035
  • Figure 55: Western Europe Market Attractiveness Analysis by Product Type
  • Figure 56: Western Europe Market Value Share and BPS Analysis by Form, 2025 and 2035
  • Figure 57: Western Europe Market Y-o-Y Growth Comparison by Form, 2025-2035
  • Figure 58: Western Europe Market Attractiveness Analysis by Form
  • Figure 59: Western Europe Market Value Share and BPS Analysis by Application, 2025 and 2035
  • Figure 60: Western Europe Market Y-o-Y Growth Comparison by Application, 2025-2035
  • Figure 61: Western Europe Market Attractiveness Analysis by Application
  • Figure 62: Western Europe Market Value Share and BPS Analysis by Nature, 2025 and 2035
  • Figure 63: Western Europe Market Y-o-Y Growth Comparison by Nature, 2025-2035
  • Figure 64: Western Europe Market Attractiveness Analysis by Nature
  • Figure 65: Eastern Europe Market Value Share and BPS Analysis by Country, 2025 and 2035
  • Figure 66: Eastern Europe Market Value Share and BPS Analysis by Product Type, 2025 and 2035
  • Figure 67: Eastern Europe Market Y-o-Y Growth Comparison by Product Type, 2025-2035
  • Figure 68: Eastern Europe Market Attractiveness Analysis by Product Type
  • Figure 69: Eastern Europe Market Value Share and BPS Analysis by Form, 2025 and 2035
  • Figure 70: Eastern Europe Market Y-o-Y Growth Comparison by Form, 2025-2035
  • Figure 71: Eastern Europe Market Attractiveness Analysis by Form
  • Figure 72: Eastern Europe Market Value Share and BPS Analysis by Application, 2025 and 2035
  • Figure 73: Eastern Europe Market Y-o-Y Growth Comparison by Application, 2025-2035
  • Figure 74: Eastern Europe Market Attractiveness Analysis by Application
  • Figure 75: Eastern Europe Market Value Share and BPS Analysis by Nature, 2025 and 2035
  • Figure 76: Eastern Europe Market Y-o-Y Growth Comparison by Nature, 2025-2035
  • Figure 77: Eastern Europe Market Attractiveness Analysis by Nature
  • Figure 78: East Asia Market Value Share and BPS Analysis by Country, 2025 and 2035
  • Figure 79: East Asia Market Value Share and BPS Analysis by Product Type, 2025 and 2035
  • Figure 80: East Asia Market Y-o-Y Growth Comparison by Product Type, 2025-2035
  • Figure 81: East Asia Market Attractiveness Analysis by Product Type
  • Figure 82: East Asia Market Value Share and BPS Analysis by Form, 2025 and 2035
  • Figure 83: East Asia Market Y-o-Y Growth Comparison by Form, 2025-2035
  • Figure 84: East Asia Market Attractiveness Analysis by Form
  • Figure 85: East Asia Market Value Share and BPS Analysis by Application, 2025 and 2035
  • Figure 86: East Asia Market Y-o-Y Growth Comparison by Application, 2025-2035
  • Figure 87: East Asia Market Attractiveness Analysis by Application
  • Figure 88: East Asia Market Value Share and BPS Analysis by Nature, 2025 and 2035
  • Figure 89: East Asia Market Y-o-Y Growth Comparison by Nature, 2025-2035
  • Figure 90: East Asia Market Attractiveness Analysis by Nature
  • Figure 91: South Asia & Pacific Market Value Share and BPS Analysis by Country, 2025 and 2035
  • Figure 92: South Asia & Pacific Market Value Share and BPS Analysis by Product Type, 2025 and 2035
  • Figure 93: South Asia & Pacific Market Y-o-Y Growth Comparison by Product Type, 2025-2035
  • Figure 94: South Asia & Pacific Market Attractiveness Analysis by Product Type
  • Figure 95: South Asia & Pacific Market Value Share and BPS Analysis by Form, 2025 and 2035
  • Figure 96: South Asia & Pacific Market Y-o-Y Growth Comparison by Form, 2025-2035
  • Figure 97: South Asia & Pacific Market Attractiveness Analysis by Form
  • Figure 98: South Asia & Pacific Market Value Share and BPS Analysis by Application, 2025 and 2035
  • Figure 99: South Asia & Pacific Market Y-o-Y Growth Comparison by Application, 2025-2035
  • Figure 100: South Asia & Pacific Market Attractiveness Analysis by Application
  • Figure 101: South Asia & Pacific Market Value Share and BPS Analysis by Nature, 2025 and 2035
  • Figure 102: South Asia & Pacific Market Y-o-Y Growth Comparison by Nature, 2025-2035
  • Figure 103: South Asia & Pacific Market Attractiveness Analysis by Nature
  • Figure 104: Middle East and Africa Market Value Share and BPS Analysis by Country, 2025 and 2035
  • Figure 105: Middle East and Africa Market Value Share and BPS Analysis by Product Type, 2025 and 2035
  • Figure 106: Middle East and Africa Market Y-o-Y Growth Comparison by Product Type, 2025-2035
  • Figure 107: Middle East and Africa Market Attractiveness Analysis by Product Type
  • Figure 108: Middle East and Africa Market Value Share and BPS Analysis by Form, 2025 and 2035
  • Figure 109: Middle East and Africa Market Y-o-Y Growth Comparison by Form, 2025-2035
  • Figure 110: Middle East and Africa Market Attractiveness Analysis by Form
  • Figure 111: Middle East and Africa Market Value Share and BPS Analysis by Application, 2025 and 2035
  • Figure 112: Middle East and Africa Market Y-o-Y Growth Comparison by Application, 2025-2035
  • Figure 113: Middle East and Africa Market Attractiveness Analysis by Application
  • Figure 114: Middle East and Africa Market Value Share and BPS Analysis by Nature, 2025 and 2035
  • Figure 115: Middle East and Africa Market Y-o-Y Growth Comparison by Nature, 2025-2035
  • Figure 116: Middle East and Africa Market Attractiveness Analysis by Nature
  • Figure 117: Global Market - Tier Structure Analysis
  • Figure 118: Global Market - Company Share Analysis

Frequently Asked Questions

What is the projected market size of the beet sugar market by 2035?

The market is expected to reach USD 8.2 billion by 2035.

What is the CAGR for the beet sugar market between 2025 and 2035?

The market is anticipated to grow at a CAGR of 5.4% during the forecast period.

Which is the top product type segment in the beet sugar market?

White sugar dominates the market with a 68.9% share in 2025.

Which form segment leads the beet sugar market?

Powdered sugar is the leading form, accounting for a 29.7% share in 2025.

Which country is expected to register the highest growth in the beet sugar market?

India is projected to lead with a CAGR of 5.8% from 2025 to 2035.

Explore Similar Insights

Future Market Insights

Beet Sugar Market