Beetroot Powder Market Size, Share, and Forecast Outlook 2025 to 2035

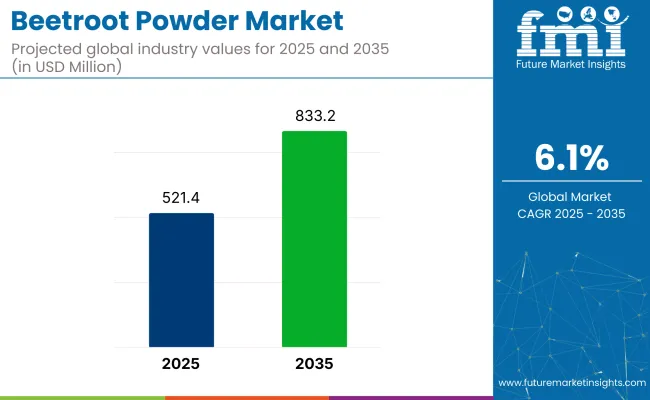
The beetroot powder market is projected to increase from USD 521.4 million in 2025 to USD 833.2 million by 2035, growing at a CAGR of 6.1% over the forecast period. Market demand is gaining momentum, particularly among health-conscious consumers and functional food manufacturers, due to beetroot's nitrate-rich profile and naturally vibrant color.
Quick Stats in Beetroot Powder Market

  • Market Size (2025): USD 521.4 million
  • Market Forecast (2035): USD 833.2 million
  • CAGR (2025 to 2035): 6.1%
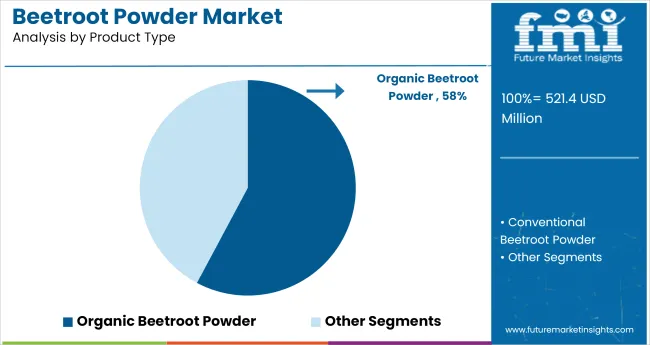
  • Top Type Segment: Organic Beetroot Powder (57.8% share in 2025)
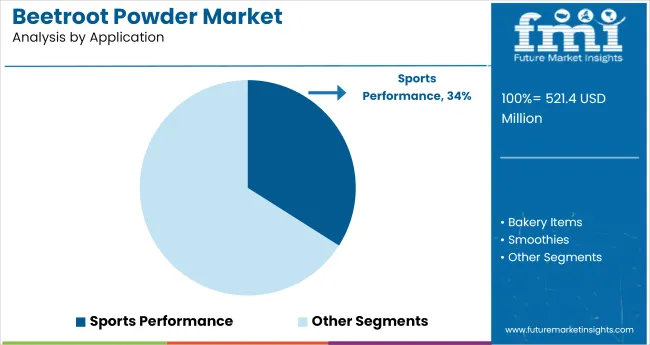
  • Leading Application Segment: Sports Performance (34% share in 2025)
  • Top Growing Country: India (6.0% CAGR)

Beetroot Powder Market

Attributes Description
Estimated Market Size (2025E) USD 521.4 million
Projected Market Value (2035F) USD 833.2 million
Value-based CAGR (2025 to 2035) 6.1%

North America generated close to USD 182 million in sales last year, with growing demand from pre-workout blends and natural beverage enhancers. In Asia-Pacific, demand is rising at nearly 10% annually, driven by wellness trends in India, Indonesia, and urban China. Manufacturers are adopting freeze-drying and vacuum-drying techniques to retain high nitrate and betalain levels, while eco-friendly packaging formats now cover 32% of retail shelf share.

Beyond supplements, beetroot powder is being used in plant-based burger coloring, natural cosmetic pigments, and probiotic-enriched superfood blends. These diversified applications are turning beetroot powder from a niche superfood into a core ingredient across food, health, and beauty sectors.

As of 2025, the beetroot powder market is being recognized as a steadily growing segment within its broader parent industries. Approximately 3-4% of the global functional food ingredients market is accounted for by beetroot powder, supported by rising demand for antioxidant-rich and natural health boosters.

In the nutraceuticals sector, a share of nearly 2-3% is maintained as beetroot powder continues to be used in blood pressure and cardiovascular formulations. Around 1-2% of the plant-based ingredients market is represented by this product due to its clean-label and vegan positioning. Its share in the dietary supplements market is estimated at 2-3%, while in the food additives space, the contribution reaches about 4-5%.

Analyzing Beetroot Powder Market by Top Investment Segments

The industry is gaining strong traction across high-value segments such as organic variants, sports performance applications, and offline retail distribution. The market is being driven by rising health consciousness, plant-based nutritional trends, and demand for clean-label energy supplements.
Organic Beetroot Powder Leads Product Type with 57.8% Share

Beetroot Powder Market Analysis By Product Type

Organic beetroot powder is projected to capture 57.8% of the total market by 2025. Demand is rising as consumers increasingly prefer natural, chemical-free supplements to support cardiovascular health and stamina. Brands are introducing USDA-certified organic variants to meet strict quality standards.
  • Health-conscious consumers seek organic labels for assurance of pesticide-free, sustainable sourcing.
  • Premium supplement brands are targeting athletes and wellness users with organic beet blends.
  • Regulatory compliance and clean-label certification help brands secure shelf space in specialty health outlets.

Sports Performance Applications Drive Usage at 34% Share

Beetroot Powder Market Analysis By Application

Sports performance is expected to lead application areas, accounting for 34% of the beetroot powder industry in 2025. Endurance athletes and fitness enthusiasts are turning to nitrate-rich beet powder for improved oxygen flow and exercise capacity. This trend is accelerating with the growth of functional sports nutrition.
  • Beetroot’s nitric oxide-boosting properties support energy metabolism and muscle recovery.
  • Gym-goers and amateur runners are integrating beet powder into pre-workout routines.
  • Specialized sports brands are launching powdered drink mixes featuring concentrated beet extracts.

Offline Distribution Channels Dominate with 67% Share

Beetroot Powder Market Analysis By Distribution Channel

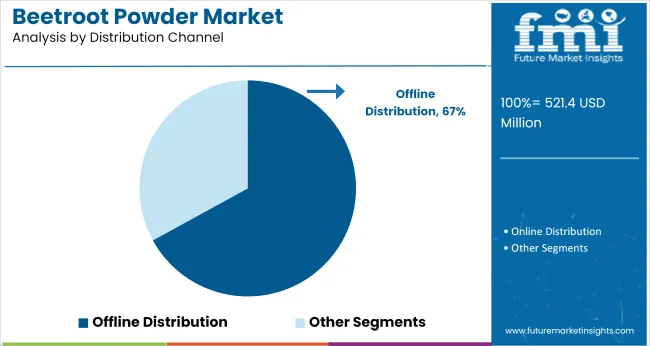
Offline distribution is set to hold a 67% market share in 2025, led by specialty health stores, pharmacies, and supermarkets. Consumers prefer tactile purchasing for supplement products, where they can review labels and consult in-store experts. Brick-and-mortar dominance is especially strong in emerging economies.

  • Shelf visibility and customer trust drive offline sales in wellness and supplement categories.
  • Health retailers offer bundled promotions and sampling to promote beet-based energy products.
  • In-store marketing campaigns help establish consumer confidence in new organic formulations.

Top Beetroot Powder Market Dynamics

The market is expanding as demand rises for natural colorants, clean-label superfoods, and plant-based nutrition. In 2024, global consumption of beetroot powder surpassed 18,000 metric tons, driven by its integration into sports nutrition, bakery mixes, and nutraceuticals.

Strong Demand from Sports Nutrition, Beverages, and Functional Foods

Beetroot powder is increasingly used in pre-workout blends, cardiovascular supplements, and hydration tablets due to its natural nitrate profile. In North America, over 36% of new sports drink launches in 2023 featured beetroot as a primary ingredient. Powdered beet is also favored in dairy-free smoothies, functional gummies, and energy bars for its flavor and anti-inflammatory properties.

  • Used in performance supplements to enhance stamina and nitric oxide levels.
  • Adopted in plant-based yogurts, nut-milk beverages, and smoothie powders.
  • Applied in bakery mixes for natural coloring and antioxidant enrichment.

Technological Advancements in Drying and Solubility Enhancing Product Performance

Spray-dried and freeze-dried variants are now developed for improved solubility and shelf life. Microencapsulation is being employed to protect nitrate content and reduce caking in humid environments. In 2024, over 45% of new beetroot powder SKUs globally featured instantized or microencapsulated formats.
  • Spray-dried powders used in instant beverage sachets and capsules.
  • Microencapsulated forms developed for moisture control and shelf stability.
  • Solubility enhancements improve usability in liquid-based and RTD products.

Top Countries Processing, Formulating, and Scaling Applications in the Beetroot Powder Market

Beetroot Powder Market Country Wise Analysis

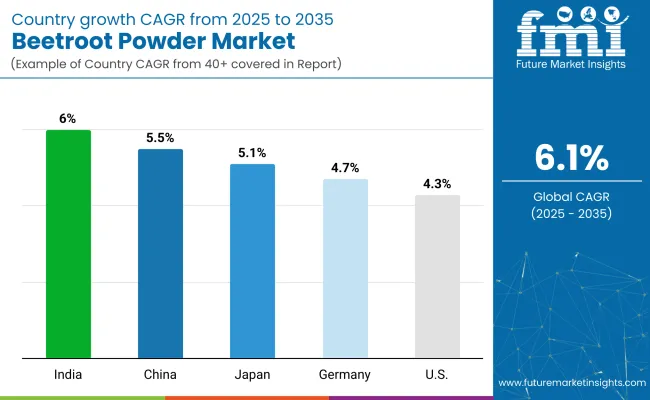
Country CAGR (2025 to 2035)
India 6.0%
China 5.5%
Japan 5.1%
Germany 4.7%
USA 4.3%

The global market is set to expand at a 6.1% CAGR between 2025 and 2035, but country-level performance reveals a widening gap between BRICS and OECD economies. India leads at 6.0%, closely trailing the global average, with rapid scale-up of low-moisture processing units across Gujarat and Andhra Pradesh. BRICS-aligned India now exports over 30% of its beetroot powder to ASEAN markets, driven by rising demand for plant-based nitrates in pre-workout and cardiac health applications.

China, at 5.5%, benefits from vertical integration in Hebei and Shandong, yet still lags the global benchmark due to regulatory delays in functional food approvals. Japan posts a modest 5.1%, with steady demand for clean-label ingredients but limited scale due to aging domestic production infrastructure.

Germany (4.7%) and the USA (4.3%) underperform, constrained by higher energy costs in spray-drying operations and slow reformulation of conventional processed foods, despite growing interest in nitrate-rich wellness products across OECD markets.

The report provides insights across 40+ countries. The five below are highlighted for their strategic influence and growth trajectory.

Beetroot Powder Market Outlook in India

India’s market is projected to expand at a CAGR of 6.0% through 2035. Rapid urbanization and health awareness are driving demand for beet-based nutraceuticals and drink mixes. Domestic processors in Maharashtra and Karnataka are investing in solar drying and spray drying technologies to preserve nitrate and color quality.

Ayurvedic brands are launching beetroot-infused detox powders and pre-workout supplements. E-commerce platforms are boosting reach in metro and tier-2 cities, where young consumers seek natural endurance boosters and antioxidant-rich ingredients.

  • Ayurvedic nutrition brands integrating beetroot into energy blends
  • Solar and spray drying tech enhancing nutrient preservation
  • E-commerce channels expanding functional beet product access

Demand Forecast for Beetroot Powder in China

China is expected to grow at a CAGR of 5.5% through 2035. Growth is driven by functional food brands promoting beetroot for cardiovascular health, nitric oxide stimulation, and digestive benefits. Cold-pressed juice chains and ready-to-mix beverage firms in Shanghai and Shenzhen are standardizing beetroot powder into daily-use products.

Domestic manufacturers are using vacuum dehydration to retain pigment and bioactivity. Government-backed “dual circulation” policies are also encouraging localized sourcing of superfood ingredients for domestic wellness products.

  • Functional beverage startups using beetroot as a heart-health booster
  • Vacuum-dehydrated powders developed to retain deep red coloration
  • Policy-driven sourcing shift toward domestic superfood ingredients

Beetroot Powder Market Expansion in Japan

The market in Japan is projected to grow at a CAGR of 5.1% through 2035. Beetroot powder is gaining traction in the country’s senior health and functional snack segments. Brands are formulating low-sodium miso soups, smoothies, and rice crackers with added beet powder for nitric oxide support. Hokkaido-based suppliers are scaling production using freeze-drying to cater to pharmaceutical-grade clients. Growth is also being supported by health food stores targeting fatigue relief and blood pressure management among aging consumers.

  • Freeze-dried beet powders offered in elderly-focused product lines
  • Functional snacks and soups incorporating beet-based formulations
  • Domestic firms emphasizing clean-label heart wellness positioning

Beetroot Powder Market Trends in Germany

Germany is projected to grow at a CAGR of 4.7% through 2035, with beetroot powder gaining popularity in vegan baking, athletic supplements, and baby nutrition products. Clean-label expectations are encouraging processors to avoid synthetic colorants, making beetroot a favored natural pigment. Organic food manufacturers are sourcing EU-certified beet powder for energy drink mixes and immune support capsules. Cold-chain logistics are being optimized for low-moisture, high-retention powders distributed through pharmacy and organic channels.

  • Natural pigment demand rising in vegan and baby food applications
  • EU-certified beet powder adopted in organic and wellness sectors
  • Cold-chain optimized for specialty pharmacy-grade formulations

Market Outlook for Beetroot Powder in the United States

The USA market is forecast to grow at a CAGR of 4.3% through 2035. Fitness nutrition and clean-label pre-workout blends are driving core demand. California-based processors are using drum-drying and infrared drying methods to maximize soluble fiber and nitrate preservation. Natural food retailers and subscription-based nutrition companies are leading distribution. Growth is also supported by widespread clinical content promoting beetroot’s benefits in blood flow and stamina, particularly among athletes and aging populations.
  • Infrared-dried powders used in performance nutrition blends
  • Direct-to-consumer health brands featuring beet for circulation support
  • Fitness and senior wellness categories boosting regular consumption

Leading Beetroot Powder Producers

Beetroot Powder Market Analysis By Company

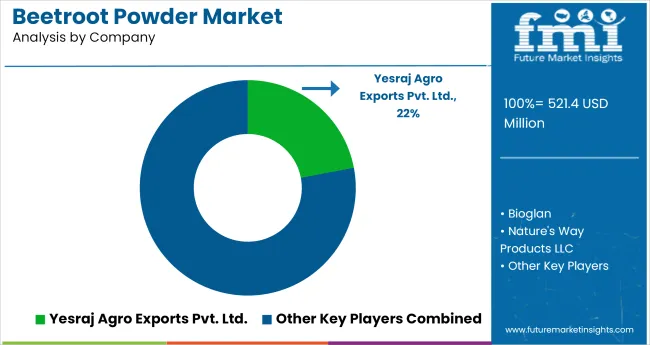
The industry is moderately fragmented, with regional and niche players holding strong brand identities. Yesraj Agro Exports dominates the Indian export landscape through bulk contract manufacturing and extensive supply in nutraceuticals and F&B sectors.

Bioglan, a leading Australian brand, focuses on fortified beetroot blends with superfoods, gaining traction in the UK and EU. Nature's Way Products LLC leads in North America, leveraging deep retail distribution across Walgreens and CVS, particularly in fitness supplements.

Super Sprout LLC emphasizes freeze-dried beetroot with high nitrate retention, appealing to elite athletes. Go Superfood and Natures Aid Ltd target the organic consumer segment in Europe through e-commerce and natural health store partnerships, creating high-margin offerings in the clean label space.

Leading Brands in Beetroot Powder Market

  • Yesraj Agro Exports Pvt. Ltd
  • Bioglan
  • Nature's Way Products LLC
  • Super Sprout LLC & Juices International Pty Ltd.
  • NutraMarks Inc.
  • Radiance Ltd.
  • Go Superfood
  • Natures Aid Ltd.
  • Botanical Ingredients Ltd
  • Indigo Herbs Radiance Ltd

Report Coverage and Scope Summary

Report Attributes Details
Market Size (2025) USD 521.4 million
Projected Market Size (2035) USD 833.2 million
CAGR (2025 to 2035) 6.1%
Base Year for Estimation 2024
Historical Period 2020 to 2024
Projections Period 2025 to 2035
Quantitative Units USD million for market value
Types Analyzed (Segment 1) Conventional, Organic
Applications Analyzed (Segment 2) Sports Performance, Bakery Items, Smoothies, Protein Bars, Energy Drinks
Distribution Channels Analyzed (Segment 3) Online, Offline
Regions Covered North America, Latin America, Europe, East Asia, South Asia, Oceania, Middle East & Africa
Countries Covered United States, Canada, Germany, United Kingdom, France, Japan, China, India, South Korea, Brazil
Key Players Yesraj Agro Exports Pvt. Ltd., Bioglan, Nature's Way Products LLC, Super Sprout LLC & Juices International Pty Ltd., NutraMarks Inc., Radiance Ltd., Go Superfood, Natures Aid Ltd., Botanical Ingredients Ltd, Indigo Herbs Radiance Ltd.
Additional Attributes Dollar sales by type and application, rising demand for natural nitrates in fitness products, expanding retail visibility for organic powders, and growing role in plant-based health and wellness categories.

Key Segments of Beetroot Powder Industry Survey

By Type:

The market is segmented into conventional and organic beetroot powder.

By Application:

Beetroot powder is used as the primary ingredient in sports performance, bakery items, smoothies, protein bars, and energy drinks

By Distribution Channel:

Beetroot powder is retailed online and offline

By Region:

The market is segmented between North America, Latin America, Europe, East Asia, South Asia, Oceania, Middle East & Africa

Table of Content

  1. Executive Summary
    • Global Market Outlook
    • Demand-side Trends
    • Supply-side Trends
    • Technology Roadmap Analysis
    • Analysis and Recommendations
  2. Market Overview
    • Market Coverage / Taxonomy
    • Market Definition / Scope / Limitations
  3. Market Background
    • Market Dynamics
      • Drivers
      • Restraints
      • Opportunity
      • Trends
    • Scenario Forecast
      • Demand in Optimistic Scenario
      • Demand in Likely Scenario
      • Demand in Conservative Scenario
    • Opportunity Map Analysis
    • Product Life Cycle Analysis
    • Supply Chain Analysis
      • Supply Side Participants and their Roles
        • Producers
        • Mid-Level Participants (Traders/ Agents/ Brokers)
        • Wholesalers and Distributors
      • Value Added and Value Created at Node in the Supply Chain
      • List of Raw Material Suppliers
      • List of Existing and Potential Buyer’s
    • Investment Feasibility Matrix
    • Value Chain Analysis
      • Profit Margin Analysis
      • Wholesalers and Distributors
      • Retailers
    • PESTLE and Porter’s Analysis
    • Regulatory Landscape
      • By Key Regions
      • By Key Countries
    • Regional Parent Market Outlook
    • Production and Consumption Statistics
    • Import and Export Statistics
  4. Global Market Analysis 2020 to 2024 and Forecast, 2025 to 2035
    • Historical Market Size Value (USD Million) & Volume (MT) Analysis, 2020 to 2024
    • Current and Future Market Size Value (USD Million) & Volume (MT) Projections, 2025 to 2035
      • Y-o-Y Growth Trend Analysis
      • Absolute $ Opportunity Analysis
  5. Global Market Pricing Analysis 2020 to 2024 and Forecast 2025 to 2035
  6. Global Market Analysis 2020 to 2024 and Forecast 2025 to 2035, By Type
    • Introduction / Key Findings
    • Historical Market Size Value (USD Million) & Volume (MT) Analysis By Type, 2020 to 2024
    • Current and Future Market Size Value (USD Million) & Volume (MT) Analysis and Forecast By Type, 2025 to 2035
      • Conventional
      • Organic
    • Y-o-Y Growth Trend Analysis By Type, 2020 to 2024
    • Absolute $ Opportunity Analysis By Type, 2025 to 2035
  7. Global Market Analysis 2020 to 2024 and Forecast 2025 to 2035, By Application
    • Introduction / Key Findings
    • Historical Market Size Value (USD Million) & Volume (MT) Analysis By Application, 2020 to 2024
    • Current and Future Market Size Value (USD Million) & Volume (MT) Analysis and Forecast By Application, 2025 to 2035
      • Sports Performance
      • Bakery Items
      • Smoothies
      • Protein Bars
      • Energy Drinks
    • Y-o-Y Growth Trend Analysis By Application, 2020 to 2024
    • Absolute $ Opportunity Analysis By Application, 2025 to 2035
  8. Global Market Analysis 2020 to 2024 and Forecast 2025 to 2035, By Distribution Channel
    • Introduction / Key Findings
    • Historical Market Size Value (USD Million) & Volume (MT) Analysis By Distribution Channel, 2020 to 2024
    • Current and Future Market Size Value (USD Million) & Volume (MT) Analysis and Forecast By Distribution Channel, 2025 to 2035
      • Online
      • Offline
    • Y-o-Y Growth Trend Analysis By Distribution Channel, 2020 to 2024
    • Absolute $ Opportunity Analysis By Distribution Channel, 2025 to 2035
  9. Global Market Analysis 2020 to 2024 and Forecast 2025 to 2035, By Region
    • Introduction
    • Historical Market Size Value (USD Million) & Volume (MT) Analysis By Region, 2020 to 2024
    • Current Market Size Value (USD Million) & Volume (MT) Analysis and Forecast By Region, 2025 to 2035
      • North America
      • Latin America
      • Western Europe
      • Eastern Europe
      • East Asia
      • South Asia & Pacific
      • Middle East and Africa
    • Market Attractiveness Analysis By Region
  10. North America Market Analysis 2020 to 2024 and Forecast 2025 to 2035, By Country
    • Historical Market Size Value (USD Million) & Volume (MT) Trend Analysis By Market Taxonomy, 2020 to 2024
    • Market Size Value (USD Million) & Volume (MT) Forecast By Market Taxonomy, 2025 to 2035
      • By Country
        • USA
        • Canada
        • Mexico
      • By Type
      • By Application
      • By Distribution Channel
    • Market Attractiveness Analysis
      • By Country
      • By Type
      • By Application
      • By Distribution Channel
    • Key Takeaways
  11. Latin America Market Analysis 2020 to 2024 and Forecast 2025 to 2035, By Country
    • Historical Market Size Value (USD Million) & Volume (MT) Trend Analysis By Market Taxonomy, 2020 to 2024
    • Market Size Value (USD Million) & Volume (MT) Forecast By Market Taxonomy, 2025 to 2035
      • By Country
        • Brazil
        • Argentina
        • Rest of LATAM
      • By Type
      • By Application
      • By Distribution Channel
    • Market Attractiveness Analysis
      • By Country
      • By Type
      • By Application
      • By Distribution Channel
    • Key Takeaways
  12. Western Europe Market Analysis 2020 to 2024 and Forecast 2025 to 2035, By Country
    • Historical Market Size Value (USD Million) & Volume (MT) Trend Analysis By Market Taxonomy, 2020 to 2024
    • Market Size Value (USD Million) & Volume (MT) Forecast By Market Taxonomy, 2025 to 2035
      • By Country
        • Germany
        • Italy
        • France
        • UK
        • Spain
        • BENELUX
        • Nordic
        • Rest of W.Europe
      • By Type
      • By Application
      • By Distribution Channel
    • Market Attractiveness Analysis
      • By Country
      • By Type
      • By Application
      • By Distribution Channel
    • Key Takeaways
  13. Eastern Europe Market Analysis 2020 to 2024 and Forecast 2025 to 2035, By Country
    • Historical Market Size Value (USD Million) & Volume (MT) Trend Analysis By Market Taxonomy, 2020 to 2024
    • Market Size Value (USD Million) & Volume (MT) Forecast By Market Taxonomy, 2025 to 2035
      • By Country
        • Russia
        • Hungary
        • Poland
        • Balkan & Baltics
        • Rest of E. Europe
      • By Type
      • By Application
      • By Distribution Channel
    • Market Attractiveness Analysis
      • By Country
      • By Type
      • By Application
      • By Distribution Channel
    • Key Takeaways
  14. East Asia Market Analysis 2020 to 2024 and Forecast 2025 to 2035, By Country
    • Historical Market Size Value (USD Million) & Volume (MT) Trend Analysis By Market Taxonomy, 2020 to 2024
    • Market Size Value (USD Million) & Volume (MT) Forecast By Market Taxonomy, 2025 to 2035
      • By Country
        • China
        • Japan
        • South Korea
      • By Type
      • By Application
      • By Distribution Channel
    • Market Attractiveness Analysis
      • By Country
      • By Type
      • By Application
      • By Distribution Channel
    • Key Takeaways
  15. South Asia & Pacific Market Analysis 2020 to 2024 and Forecast 2025 to 2035, By Country
    • Historical Market Size Value (USD Million) & Volume (MT) Trend Analysis By Market Taxonomy, 2020 to 2024
    • Market Size Value (USD Million) & Volume (MT) Forecast By Market Taxonomy, 2025 to 2035
      • By Country
        • India
        • Australia & New Zealand
        • ASEAN
        • Rest of SAP
      • By Type
      • By Application
      • By Distribution Channel
    • Market Attractiveness Analysis
      • By Country
      • By Type
      • By Application
      • By Distribution Channel
    • Key Takeaways
  16. Middle East and Africa Market Analysis 2020 to 2024 and Forecast 2025 to 2035, By Country
    • Historical Market Size Value (USD Million) & Volume (MT) Trend Analysis By Market Taxonomy, 2020 to 2024
    • Market Size Value (USD Million) & Volume (MT) Forecast By Market Taxonomy, 2025 to 2035
      • By Country
        • GCC Countries
        • Northern Africa
        • South Africa
        • Turkiye
        • Rest of MEA
      • By Type
      • By Application
      • By Distribution Channel
    • Market Attractiveness Analysis
      • By Country
      • By Type
      • By Application
      • By Distribution Channel
    • Key Takeaways
  17. Key Countries Market Analysis
    • USA
      • Pricing Analysis
      • Market Share Analysis, 2024
        • By Type
        • By Application
        • By Distribution Channel
    • Canada
      • Pricing Analysis
      • Market Share Analysis, 2024
        • By Type
        • By Application
        • By Distribution Channel
    • Brazil
      • Pricing Analysis
      • Market Share Analysis, 2024
        • By Type
        • By Application
        • By Distribution Channel
    • Mexico
      • Pricing Analysis
      • Market Share Analysis, 2024
        • By Type
        • By Application
        • By Distribution Channel
    • Argentina
      • Pricing Analysis
      • Market Share Analysis, 2024
        • By Type
        • By Application
        • By Distribution Channel
  18. Market Structure Analysis
    • Competition Dashboard
    • Competition Benchmarking
    • Market Share Analysis of Top Players
      • By Regional
      • By Type
      • By Application
      • By Distribution Channel
  19. Competition Analysis
    • Competition Deep Dive
      • Yesraj Agro Exports Pvt. Ltd
        • Overview
        • Product Portfolio
        • Profitability by Market Segments (Product/Age /Sales Channel/Region)
        • Sales Footprint
        • Strategy Overview
          • Marketing Strategy
          • Product Strategy
          • Channel Strategy
      • Bioglan
        • Overview
        • Product Portfolio
        • Profitability by Market Segments (Product/Age /Sales Channel/Region)
        • Sales Footprint
        • Strategy Overview
          • Marketing Strategy
          • Product Strategy
          • Channel Strategy
      • Nature's Way Products LLC
        • Overview
        • Product Portfolio
        • Profitability by Market Segments (Product/Age /Sales Channel/Region)
        • Sales Footprint
        • Strategy Overview
          • Marketing Strategy
          • Product Strategy
          • Channel Strategy
      • Super Sprout LLC & Juices International Pty Ltd.
        • Overview
        • Product Portfolio
        • Profitability by Market Segments (Product/Age /Sales Channel/Region)
        • Sales Footprint
        • Strategy Overview
          • Marketing Strategy
          • Product Strategy
          • Channel Strategy
      • NutraMarks Inc.
        • Overview
        • Product Portfolio
        • Profitability by Market Segments (Product/Age /Sales Channel/Region)
        • Sales Footprint
        • Strategy Overview
          • Marketing Strategy
          • Product Strategy
          • Channel Strategy
      • Radiance Ltd.
        • Overview
        • Product Portfolio
        • Profitability by Market Segments (Product/Age /Sales Channel/Region)
        • Sales Footprint
        • Strategy Overview
          • Marketing Strategy
          • Product Strategy
          • Channel Strategy
      • Go Superfood
        • Overview
        • Product Portfolio
        • Profitability by Market Segments (Product/Age /Sales Channel/Region)
        • Sales Footprint
        • Strategy Overview
          • Marketing Strategy
          • Product Strategy
          • Channel Strategy
      • Natures Aid Ltd.
        • Overview
        • Product Portfolio
        • Profitability by Market Segments (Product/Age /Sales Channel/Region)
        • Sales Footprint
        • Strategy Overview
          • Marketing Strategy
          • Product Strategy
          • Channel Strategy
      • Botanical Ingredients Ltd
        • Overview
        • Product Portfolio
        • Profitability by Market Segments (Product/Age /Sales Channel/Region)
        • Sales Footprint
        • Strategy Overview
          • Marketing Strategy
          • Product Strategy
          • Channel Strategy
      • Indigo Herbs Radiance Ltd
        • Overview
        • Product Portfolio
        • Profitability by Market Segments (Product/Age /Sales Channel/Region)
        • Sales Footprint
        • Strategy Overview
          • Marketing Strategy
          • Product Strategy
          • Channel Strategy
  20. Assumptions & Acronyms Used
  21. Research Methodology

List of Tables

  • Table 1: Global Market Value (USD Million) Forecast by Region, 2020-2035
  • Table 2: Global Market Volume (MT) Forecast by Region, 2020-2035
  • Table 3: Global Market Value (USD Million) Forecast by Type, 2020-2035
  • Table 4: Global Market Volume (MT) Forecast by Type, 2020-2035
  • Table 5: Global Market Value (USD Million) Forecast by Application, 2020-2035
  • Table 6: Global Market Volume (MT) Forecast by Application, 2020-2035
  • Table 7: Global Market Value (USD Million) Forecast by Distribution Channel, 2020-2035
  • Table 8: Global Market Volume (MT) Forecast by Distribution Channel, 2020-2035
  • Table 9: North America Market Value (USD Million) Forecast by Country, 2020-2035
  • Table 10: North America Market Volume (MT) Forecast by Country, 2020-2035
  • Table 11: North America Market Value (USD Million) Forecast by Type, 2020-2035
  • Table 12: North America Market Volume (MT) Forecast by Type, 2020-2035
  • Table 13: North America Market Value (USD Million) Forecast by Application, 2020-2035
  • Table 14: North America Market Volume (MT) Forecast by Application, 2020-2035
  • Table 15: North America Market Value (USD Million) Forecast by Distribution Channel, 2020-2035
  • Table 16: North America Market Volume (MT) Forecast by Distribution Channel, 2020-2035
  • Table 17: Latin America Market Value (USD Million) Forecast by Country, 2020-2035
  • Table 18: Latin America Market Volume (MT) Forecast by Country, 2020-2035
  • Table 19: Latin America Market Value (USD Million) Forecast by Type, 2020-2035
  • Table 20: Latin America Market Volume (MT) Forecast by Type, 2020-2035
  • Table 21: Latin America Market Value (USD Million) Forecast by Application, 2020-2035
  • Table 22: Latin America Market Volume (MT) Forecast by Application, 2020-2035
  • Table 23: Latin America Market Value (USD Million) Forecast by Distribution Channel, 2020-2035
  • Table 24: Latin America Market Volume (MT) Forecast by Distribution Channel, 2020-2035
  • Table 25: Western Europe Market Value (USD Million) Forecast by Country, 2020-2035
  • Table 26: Western Europe Market Volume (MT) Forecast by Country, 2020-2035
  • Table 27: Western Europe Market Value (USD Million) Forecast by Type, 2020-2035
  • Table 28: Western Europe Market Volume (MT) Forecast by Type, 2020-2035
  • Table 29: Western Europe Market Value (USD Million) Forecast by Application, 2020-2035
  • Table 30: Western Europe Market Volume (MT) Forecast by Application, 2020-2035
  • Table 31: Western Europe Market Value (USD Million) Forecast by Distribution Channel, 2020-2035
  • Table 32: Western Europe Market Volume (MT) Forecast by Distribution Channel, 2020-2035
  • Table 33: Eastern Europe Market Value (USD Million) Forecast by Country, 2020-2035
  • Table 34: Eastern Europe Market Volume (MT) Forecast by Country, 2020-2035
  • Table 35: Eastern Europe Market Value (USD Million) Forecast by Type, 2020-2035
  • Table 36: Eastern Europe Market Volume (MT) Forecast by Type, 2020-2035
  • Table 37: Eastern Europe Market Value (USD Million) Forecast by Application, 2020-2035
  • Table 38: Eastern Europe Market Volume (MT) Forecast by Application, 2020-2035
  • Table 39: Eastern Europe Market Value (USD Million) Forecast by Distribution Channel, 2020-2035
  • Table 40: Eastern Europe Market Volume (MT) Forecast by Distribution Channel, 2020-2035
  • Table 41: East Asia Market Value (USD Million) Forecast by Country, 2020-2035
  • Table 42: East Asia Market Volume (MT) Forecast by Country, 2020-2035
  • Table 43: East Asia Market Value (USD Million) Forecast by Type, 2020-2035
  • Table 44: East Asia Market Volume (MT) Forecast by Type, 2020-2035
  • Table 45: East Asia Market Value (USD Million) Forecast by Application, 2020-2035
  • Table 46: East Asia Market Volume (MT) Forecast by Application, 2020-2035
  • Table 47: East Asia Market Value (USD Million) Forecast by Distribution Channel, 2020-2035
  • Table 48: East Asia Market Volume (MT) Forecast by Distribution Channel, 2020-2035
  • Table 49: South Asia & Pacific Market Value (USD Million) Forecast by Country, 2020-2035
  • Table 50: South Asia & Pacific Market Volume (MT) Forecast by Country, 2020-2035
  • Table 51: South Asia & Pacific Market Value (USD Million) Forecast by Type, 2020-2035
  • Table 52: South Asia & Pacific Market Volume (MT) Forecast by Type, 2020-2035
  • Table 53: South Asia & Pacific Market Value (USD Million) Forecast by Application, 2020-2035
  • Table 54: South Asia & Pacific Market Volume (MT) Forecast by Application, 2020-2035
  • Table 55: South Asia & Pacific Market Value (USD Million) Forecast by Distribution Channel, 2020-2035
  • Table 56: South Asia & Pacific Market Volume (MT) Forecast by Distribution Channel, 2020-2035
  • Table 57: Middle East and Africa Marke Value (USD Million) Forecast by Country, 2020-2035
  • Table 58: Middle East and Africa Market Volume (MT) Forecast by Country, 2020-2035
  • Table 59: Middle East and Africa Market Value (USD Million) Forecast by Type, 2020-2035
  • Table 60: Middle East and Africa Market Volume (MT) Forecast by Type, 2020-2035
  • Table 61: Middle East and Africa Market Value (USD Million) Forecast by Application, 2020-2035
  • Table 62: Middle East and Africa Market Volume (MT) Forecast by Application, 2020-2035
  • Table 63: Middle East and Africa Market Value (USD Million) Forecast by Distribution Channel, 2020-2035
  • Table 64: Middle East and Africa Market Volume (MT) Forecast by Distribution Channel, 2020-2035

List of Figures

  • Figure 1: Global Market Volume (MT) Forecast 2020-2035
  • Figure 2: Global Market Pricing Analysis
  • Figure 3: Global Market Value (USD Million) Forecast 2020-2035
  • Figure 4: Global Market Value Share and BPS Analysis by Type, 2025 and 2035
  • Figure 5: Global Market Y-o-Y Growth Comparison by Type, 2025-2035
  • Figure 6: Global Market Attractiveness Analysis by Type
  • Figure 7: Global Market Value Share and BPS Analysis by Application, 2025 and 2035
  • Figure 8: Global Market Y-o-Y Growth Comparison by Application, 2025-2035
  • Figure 9: Global Market Attractiveness Analysis by Application
  • Figure 10: Global Market Value Share and BPS Analysis by Distribution Channel, 2025 and 2035
  • Figure 11: Global Market Y-o-Y Growth Comparison by Distribution Channel, 2025-2035
  • Figure 12: Global Market Attractiveness Analysis by Distribution Channel
  • Figure 13: Global Market Value (USD Million) Share and BPS Analysis by Region, 2025 and 2035
  • Figure 14: Global Market Y-o-Y Growth Comparison by Region, 2025-2035
  • Figure 15: Global Market Attractiveness Analysis by Region
  • Figure 16: North America Market Incremental $ Opportunity, 2025-2035
  • Figure 17: Latin America Market Incremental $ Opportunity, 2025-2035
  • Figure 18: Western Europe Market Incremental $ Opportunity, 2025-2035
  • Figure 19: Eastern Europe Market Incremental $ Opportunity, 2025-2035
  • Figure 20: East Asia Market Incremental $ Opportunity, 2025-2035
  • Figure 21: South Asia & Pacific Market Incremental $ Opportunity, 2025-2035
  • Figure 22: Middle East and Africa Market Incremental $ Opportunity, 2025-2035
  • Figure 23: North America Market Value Share and BPS Analysis by Country, 2025 and 2035
  • Figure 24: North America Market Value Share and BPS Analysis by Type, 2025 and 2035
  • Figure 25: North America Market Y-o-Y Growth Comparison by Type, 2025-2035
  • Figure 26: North America Market Attractiveness Analysis by Type
  • Figure 27: North America Market Value Share and BPS Analysis by Application, 2025 and 2035
  • Figure 28: North America Market Y-o-Y Growth Comparison by Application, 2025-2035
  • Figure 29: North America Market Attractiveness Analysis by Application
  • Figure 30: North America Market Value Share and BPS Analysis by Distribution Channel, 2025 and 2035
  • Figure 31: North America Market Y-o-Y Growth Comparison by Distribution Channel, 2025-2035
  • Figure 32: North America Market Attractiveness Analysis by Distribution Channel
  • Figure 33: Latin America Market Value Share and BPS Analysis by Country, 2025 and 2035
  • Figure 34: Latin America Market Value Share and BPS Analysis by Type, 2025 and 2035
  • Figure 35: Latin America Market Y-o-Y Growth Comparison by Type, 2025-2035
  • Figure 36: Latin America Market Attractiveness Analysis by Type
  • Figure 37: Latin America Market Value Share and BPS Analysis by Application, 2025 and 2035
  • Figure 38: Latin America Market Y-o-Y Growth Comparison by Application, 2025-2035
  • Figure 39: Latin America Market Attractiveness Analysis by Application
  • Figure 40: Latin America Market Value Share and BPS Analysis by Distribution Channel, 2025 and 2035
  • Figure 41: Latin America Market Y-o-Y Growth Comparison by Distribution Channel, 2025-2035
  • Figure 42: Latin America Market Attractiveness Analysis by Distribution Channel
  • Figure 43: Western Europe Market Value Share and BPS Analysis by Country, 2025 and 2035
  • Figure 44: Western Europe Market Value Share and BPS Analysis by Type, 2025 and 2035
  • Figure 45: Western Europe Market Y-o-Y Growth Comparison by Type, 2025-2035
  • Figure 46: Western Europe Market Attractiveness Analysis by Type
  • Figure 47: Western Europe Market Value Share and BPS Analysis by Application, 2025 and 2035
  • Figure 48: Western Europe Market Y-o-Y Growth Comparison by Application, 2025-2035
  • Figure 49: Western Europe Market Attractiveness Analysis by Application
  • Figure 50: Western Europe Market Value Share and BPS Analysis by Distribution Channel, 2025 and 2035
  • Figure 51: Western Europe Market Y-o-Y Growth Comparison by Distribution Channel, 2025-2035
  • Figure 52: Western Europe Market Attractiveness Analysis by Distribution Channel
  • Figure 53: Eastern Europe Market Value Share and BPS Analysis by Country, 2025 and 2035
  • Figure 54: Eastern Europe Market Value Share and BPS Analysis by Type, 2025 and 2035
  • Figure 55: Eastern Europe Market Y-o-Y Growth Comparison by Type, 2025-2035
  • Figure 56: Eastern Europe Market Attractiveness Analysis by Type
  • Figure 57: Eastern Europe Market Value Share and BPS Analysis by Application, 2025 and 2035
  • Figure 58: Eastern Europe Market Y-o-Y Growth Comparison by Application, 2025-2035
  • Figure 59: Eastern Europe Market Attractiveness Analysis by Application
  • Figure 60: Eastern Europe Market Value Share and BPS Analysis by Distribution Channel, 2025 and 2035
  • Figure 61: Eastern Europe Market Y-o-Y Growth Comparison by Distribution Channel, 2025-2035
  • Figure 62: Eastern Europe Market Attractiveness Analysis by Distribution Channel
  • Figure 63: East Asia Market Value Share and BPS Analysis by Country, 2025 and 2035
  • Figure 64: East Asia Market Value Share and BPS Analysis by Type, 2025 and 2035
  • Figure 65: East Asia Market Y-o-Y Growth Comparison by Type, 2025-2035
  • Figure 66: East Asia Market Attractiveness Analysis by Type
  • Figure 67: East Asia Market Value Share and BPS Analysis by Application, 2025 and 2035
  • Figure 68: East Asia Market Y-o-Y Growth Comparison by Application, 2025-2035
  • Figure 69: East Asia Market Attractiveness Analysis by Application
  • Figure 70: East Asia Market Value Share and BPS Analysis by Distribution Channel, 2025 and 2035
  • Figure 71: East Asia Market Y-o-Y Growth Comparison by Distribution Channel, 2025-2035
  • Figure 72: East Asia Market Attractiveness Analysis by Distribution Channel
  • Figure 73: South Asia & Pacific Market Value Share and BPS Analysis by Country, 2025 and 2035
  • Figure 74: South Asia & Pacific Market Value Share and BPS Analysis by Type, 2025 and 2035
  • Figure 75: South Asia & Pacific Market Y-o-Y Growth Comparison by Type, 2025-2035
  • Figure 76: South Asia & Pacific Market Attractiveness Analysis by Type
  • Figure 77: South Asia & Pacific Market Value Share and BPS Analysis by Application, 2025 and 2035
  • Figure 78: South Asia & Pacific Market Y-o-Y Growth Comparison by Application, 2025-2035
  • Figure 79: South Asia & Pacific Market Attractiveness Analysis by Application
  • Figure 80: South Asia & Pacific Market Value Share and BPS Analysis by Distribution Channel, 2025 and 2035
  • Figure 81: South Asia & Pacific Market Y-o-Y Growth Comparison by Distribution Channel, 2025-2035
  • Figure 82: South Asia & Pacific Market Attractiveness Analysis by Distribution Channel
  • Figure 83: Middle East and Africa Market Value Share and BPS Analysis by Country, 2025 and 2035
  • Figure 84: Middle East and Africa Market Value Share and BPS Analysis by Type, 2025 and 2035
  • Figure 85: Middle East and Africa Market Y-o-Y Growth Comparison by Type, 2025-2035
  • Figure 86: Middle East and Africa Market Attractiveness Analysis by Type
  • Figure 87: Middle East and Africa Market Value Share and BPS Analysis by Application, 2025 and 2035
  • Figure 88: Middle East and Africa Market Y-o-Y Growth Comparison by Application, 2025-2035
  • Figure 89: Middle East and Africa Market Attractiveness Analysis by Application
  • Figure 90: Middle East and Africa Market Value Share and BPS Analysis by Distribution Channel, 2025 and 2035
  • Figure 91: Middle East and Africa Market Y-o-Y Growth Comparison by Distribution Channel, 2025-2035
  • Figure 92: Middle East and Africa Market Attractiveness Analysis by Distribution Channel
  • Figure 93: Global Market - Tier Structure Analysis
  • Figure 94: Global Market - Company Share Analysis

Frequently Asked Questions

What is the current valuation of the beetroot powder market?

The market is valued at USD 521.4 million in 2025 and projected to reach USD 833.2 million by 2035.

What is the expected CAGR for the beetroot powder market from 2025 to 2035?

The market is anticipated to grow at a CAGR of 6.1% during the forecast period.

Which segment dominates the beetroot powder market by type?

Organic beetroot powder is expected to lead, holding a 57.8% market share in 2025.

What is the top application segment in the beetroot powder market?

Sports performance is projected to account for 34% of total application share in 2025.

Which country is witnessing the fastest growth in the beetroot powder market?

India is forecast to grow at the fastest pace with a CAGR of 6.0% through 2035.

Explore Similar Insights

Future Market Insights

Beetroot Powder Market