Reports

- Global Locations -

Headquarters

Future Market Insights, Inc.

Christiana Corporate, 200
Continental Drive, Suite 401,
Newark, Delaware - 19713,
United States

T: +1-845-579-5705

Americas

Future Market Insights, Inc.

616 Corporate Way, Suite 2-9018,
Valley Cottage, NY 10989, United States

T: +1-347-918-3531

MEA

Future Market Insights

1602-6 Jumeirah Bay X2 Tower, Plot No: JLT-PH2-X2A,
Jumeirah Lakes Towers, Dubai,
United Arab Emirates

Europe

Future Market Insights

3rd Floor, 207 Regent Street,
W1B 3HH London
United Kingdom

T: + 44 (0) 20 8123 9659
D: +44 (0) 20 3287 4268

Asia Pacific

Future Market Insights

IndiaLand Global Tech Park, Unit UG-1, Behind Grand HighStreet, Phase 1, Hinjawadi, MH, Pune – 411057, India

Bamboos Market Snapshot (2023 to 2033)

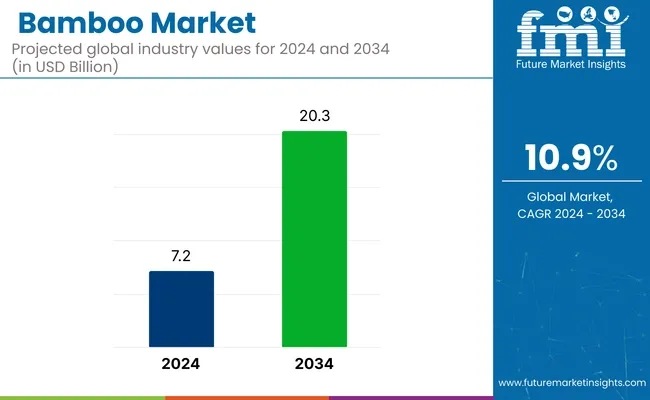
The global bamboos market is expected to attain a valuation of US$ 6,533.11 million in 2023 and is projected to reach US$ 18,440 million by 2033. A CAGR of 10.9% is anticipated for the market from 2023 to 2033. The extraordinary growth in demand for green construction especially across developed regions such as North America and Europe along with the increased adoption of bamboo for construction is expected to propel the market valuation over the forecast period.

According to FMI analysis, the bamboo market is estimated to witness a growth rate of 10.8% during the period of the first half of 2023. The growth outlook of the market is significantly influenced by certain demographic factors, industrial and economic factors including construction sector spending, sustainable development focus, and population growth among others.

Bamboo's demand in the construction of green buildings trends is increasing considerably. Furthermore, high adoption and demand for green buildings to promote the sustainability trend in developed economies are expected to elevate the market at a significant CAGR.

Awareness of various health benefits of bamboo and growing research and development in the healthcare sector is expected to derive various new application areas of bamboo in the medical field, this will create new opportunities for the bamboo market.

Future Market Insights has reviewed the market dynamics and recent industry trends to estimate the current market growth outlook for bamboo. The market has been estimated to witness a spike of 20 bps on half yearly growth outlook in H1 2023 as compared to earlier projected growth. This growth outlook is attributed to significant growth in the construction sector and adoption of sustainability.

Despite the significant demand for various applications, Government laws and regulations, and policies on ownership of resources and security have made it difficult for consumers and sellers to unlock the value of its abundant sources, which is expected to act as a restraint for the bamboo market.

Report Attribute Details
Expected Market Value (2023) US$ 6,533.11 million
Anticipated Forecast Value (2033) US$ 184,40 million
Projected Growth Rate (2023 to 2033) CAGR 10.9%

Don't pay for what you don't need

Customize your report by selecting specific countries or regions and save 30%!

2018 to 2022 Bamboos Demand Analysis vs. Forecast 2023 to 2033

The Bamboos market was worth US$ 4,250.7 million in 2018. It accumulated a market value of US$ 5,886.9 million in 2022 while growing at a CAGR of 8.4% during the historical period.

Bamboo can be used for a variety of applications in our surroundings including the construction of fences, fishing rods, boats, and various others. Bamboos are lightweight and strong compared to other wood. Apart from this bamboo are highly machine table and can be easily converted into useful shapes.

Owing to such properties the use of bamboo in the construction of green buildings is increasing at a very rapid pace. This has increased the demand for bamboo in the global market with a growth rate of 8.4% over the historical assessment period of 2018 to 2022.

However, with the high adoption and demand for green building to promote the sustainability trend in developed economies demand for bamboo is expected to elevate at significantly high CAGRs in the near future as compared to historical CAGRs.

Comparative View of Adjacent Markets

Bamboos Market:

Attributes Bamboos Market
CAGR (2023 to 2033) 10.9%
Market Value (2033) US$ 18,440 million
Growth Factor Extensive use of bamboo as a wood substitute for furniture and as a industrial raw materials are expected to drive market growth.
Opportunity Use of bamboo in the construction of green buildings is anticipated to offer new opportunities for market growth.

Bamboo Apparel Market:

Attributes Bamboo Apparel Market
CAGR (2023 to 2033) 6.1%
Market Value (2033) US$ 4,172 million
Growth Factor Increasing awareness among consumers toward eco-friendly products is expected to drive market growth.
Opportunity Increasing government initiatives toward use of sustainable products is expected to create new market growth opportunities.

Bamboo Straws Market:

Attributes Bamboo Straws Market
CAGR (2023 to 2033) 5.4%
Market Value (2033) US$ 7.4 million
Growth Factor Rising demand for eco-friendly straws is expected to drive market growth.
Opportunity Increasing bans on plastic use by various countries and growing awareness for sustainable products is expected to provide lucrative opportunities for market expansion.
Nikhil Kaitwade
Nikhil Kaitwade

Principal Consultant

Talk to Analyst

Find your sweet spots for generating winning opportunities in this market.

What is expected to be the Key Driver of the Market?

Bamboo, a versatile multi-purpose forest produce, plays a vital role in the world’s domestic and industrial economies. Bamboos and bamboo-based products are used for a wide range of indoor and outdoor applications owing to their abundance and versatility. It is one of the highly renewable resources in the Indian socio-economic-cultural-ecological-climatic-functional context with more than 1,500 recorded uses.

Besides its role as a material for consumer products, it also has great potential as an industrial raw material. Various industrial applications of bamboo include food production, wood substitute, pulp and paper, handicrafts, medicinal products, cottage industries, charcoal production, etc.

Bamboo is often considered to be a replacement for wood and industrial raw materials in both modern industrial and traditional cottage sectors. Owing to such a diverse range of applications demand for bamboo is expected to rise at marvelous growth rates during the upcoming assessment period across the regions.

What is the Major Challenge Faced by Bamboos Manufacturers?

According to IATA, airline carriers in Africa are estimated to deliver the weakest financial performance with a net loss of US$ 800 million, which can be attributed to civil conflict and disturbances being witnessed in the region. This, in turn, may stagnate the growth of the aviation industry. Which might indirectly impact the growth of the Bamboos market.

Moreover, due to low GDP, people and manufacturers operating in the aviation industry are less interested in the refurbishment of aircraft interiors and are also compromising on the quality of the interiors. This is the key factor that may hinder the growth of the Bamboos market.

Get the data you need at a Fraction of the cost

Personalize your report by choosing insights you need
and save 40%!

What are the Opportunities Presenting Themselves to Bamboo Manufacturers?

Bamboos have immense potential to transform the rural/tribal economy of India and contribute to the sustainable development efforts of the country. However, it is governed by a web of forestry laws and policies, there are serious restrictions on its harvesting, farming, and transportation.

These governmental laws and regulations, along with the policies on ownership of resources and security, and lack of institutional mechanisms have made it difficult for consumers and sellers to unlock the value of its abundant sources

There are various regulations in India including Indian Forest Act, Forest Conservation Act, Forest Rights Act, etc. which are expected to act as restraints in the APEJ bamboo market.

Country-Wise Insights

What is the Demand Outlook for Bamboos High in the United States of America?

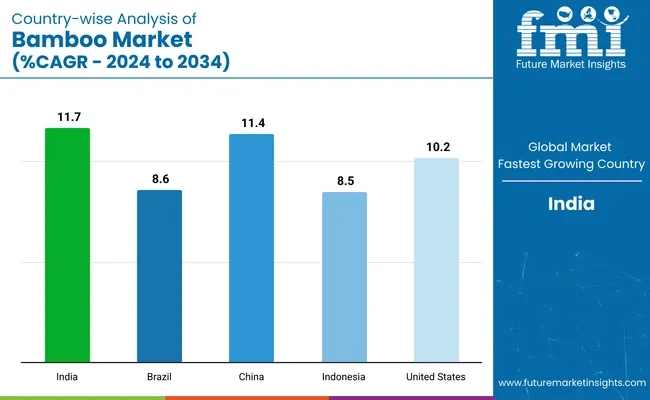
As per FMI, the United States is projected to account for a 28% share of the global bamboos market. The demand for bamboos in United States is expected to rise with a CAGR of 10.2% during the forecast period. Over the projection period, the United States is expected to dominate the North American Bamboos market, with a substantial value share in terms of consumption.

The growing trend of sustainability is expected to be a key factor driving consumption in the United States. Growing awareness towards the use of natural products among Americans is compelling companies in the countries to use natural ingredients in their products. Owing to the diversified uses of bamboo in various industries is expected to get benefit and expand its market valuation over the forecast period in the United States.

What Is Growth Outlook for Bamboos Market in China?

China is projected to reach an estimated value of US$ 8,540 million by the end of 2033. The market in this region is projected to grow with an impressive CAGR of 11.4% during the forecast period. China is the leading consumer and producer of bamboo across the globe. Favorable weather conditions in the country promote the growth of bamboo in the country.

The growing trend of sustainability and recent growth in investment and construction of the green building and eco-friendly products by the Chinese government is expected to emerge as a key factor driving the consumption of bamboo in the country.

Moreover, Owing to such a vast population the country is expected to create a huge demand for paper and pulp. Production of paper and pulp is the major consuming application of bamboo. Owing to such a high demand for paper and pulp in the country, China is holding its position among leading consumers of bamboo across the globe.

Category-Wise Insights

What Is the Bamboos Market Outlook by End-Use Industry?

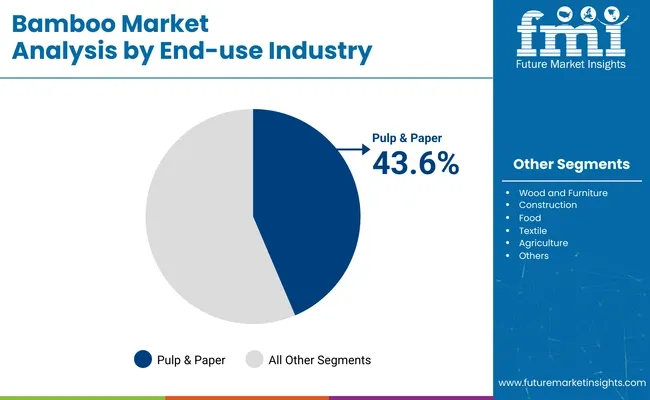
Among end-use industries, the pulp & paper segment is projected to account for a 28% market share in terms of both volume and value while food (bamboo shoots) are expected account for a relatively low market share in terms of value by 2033. The demand of bamboos in the pulp & paper industry is expected to rise with a CAGR of 12.8% during the forecast period. The demand for bamboo in the pulp & paper industry is expected to be driven mainly by the Asia-Pacific market owing to the rise in demand for paper & pulp and supported by the utilization of environmental-friendly raw materials.

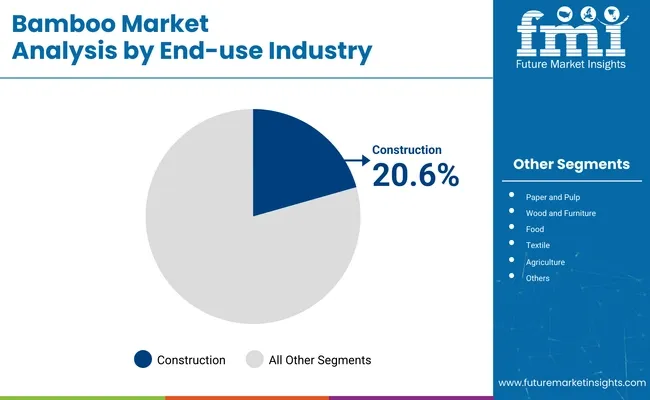
The construction segment is estimated to account for a 23% revenue share in the global bamboos market by 2023 end, which is expected to dip slightly by the 2033 end. Bamboo is remarkably light and strong, especially when compared to other commonly utilized building materials, such as steel. As a result, bamboo is popularly utilized in fences, fishing poles, boats, cutting boards, bridges, construction, etc. The wood and Furniture segment is inclined towards moderate growth-moderate value and is expected to shift towards high growth-moderate value owing to the rising demand for bamboo-based furniture.

Start-ups in Bamboos Market

Start-ups have a significant role in recognizing growth prospects and driving industry expansion. Their effectiveness in converting inputs into outputs and adapting to market uncertainties is valuable. In the bamboos market, several start-ups are engaged in manufacturing and providing related services.

  • BECO is an internet-first brand specializing in bamboo-based products for eco-friendly home, kitchen, and personal care uses.
  • Bambrew offers sustainable packaging products made from bamboo, seaweed, sugarcane, and other eco-friendly materials.
  • Finoak is an e-commerce platform offering a diverse range of products including bamboo home goods, artificial flowers, knives, dry bags, and more.
  • Moobba is an online business to business supplier offering multi-category bamboo furniture products.

Competitive Landscape

The market for bamboos is highly competitive, with various prominent industry players making substantial investments in increasing their manufacturing capabilities.

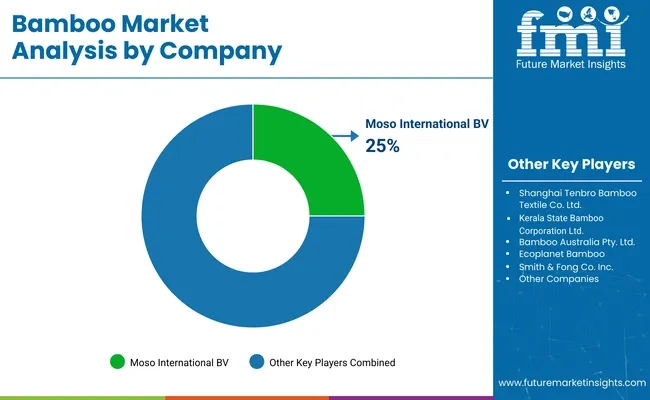
The key industry players are Moso International BV, Shanghai Tenbro Bamboo Textile Co. Ltd, Tengda Bamboo-Wood Co. Ltd., Higuera Hardwoods LLC, Dasso Industrial Group Co. Ltd., Xingli Bamboo Products Company, China Bamboo Textile Company Ltd., Bamboo Bio Composites Sdn Bhd, Southern Bamboo Inc., Jiangxi Feiyu Industry Co. Ltd., Terragreen LLC, Anji Tianzhen Bamboo Flooring Co. Ltd., Kerala State Bamboo Corporation Ltd, Bamboo Australia Pty. Ltd., Ecoplanet Bamboo, Smith & Fong Co. Inc., Jiangxi Kangda Bamboo Ware Group Co. Ltd., Fujian Jianou Huayu Bamboo Industry Co. Ltd., Jiangxi Shanyou Industry Co. Ltd.

Some recent developments in the bamboos market are:

  • In 2022, Libas Consumer Products Ltd revealed a rights issue and the launch of KNG, an organic innerwear brand made from bamboo.
  • In 2021, Nestlé announced plans to plant 3.5 million natural bamboo bunches and trees in the Philippines as part of their forestry program. This initiative aligns with Nestlé's goal of planting 200 million trees by 2030 and supports their strategy to promote regenerative agriculture, implement environmental alternatives to reduce carbon emissions, and work towards their net-zero target by 2050.
  • In June 2021, UK flooring products company Victoria PLC acquired Cali Bamboo Holdings for US$ 76.1 million. This acquisition enabled Victoria to expand its distribution in the US, develop new products, and maintain a strong focus on products, people, and relationships.

Report Scope

Report Attribute Details
Market Value in 2023 US$ 6,533.11 million
Market Value in 2033 US$ 18,440 million
Growth Rate CAGR of 10.9% from 2023 to 2033
Base Year for Estimation 2022
Historical Data 2018 to 2022
Forecast Period 2023 to 2033
Quantitative Units Revenue in US$ million and CAGR from 2023 to 2033
Report Coverage Revenue Forecast, Volume Forecast, Company Ranking, Competitive Landscape, Growth Factors, Trends, and Pricing Analysis
Segments Covered
  • End Use Industry
  • Region
Regions Covered
  • North America
  • Latin America
  • Europe
  • Asia Pacific
  • Middle East and Africa
Key Countries Profiled
  • United States
  • Canada
  • Brazil
  • Mexico
  • Germany
  • United Kingdom
  • France
  • Spain
  • Italy
  • India
  • China
  • Japan
  • South Korea
  • India
  • Australia
  • South Africa
  • Saudi Arabia
  • UAE
  • Israel
Key Companies Profiled
  • Moso International BV
  • Shanghai Tenbro Bamboo Textile Co. Ltd
  • Kerala State Bamboo Corporation Ltd,
  • Bamboo Australia Pty. Ltd.
  • Ecoplanet Bamboo
  • Smith & Fong Co. Inc.
  • Jiangxi Kangda Bamboo Ware Group Co. Ltd.
  • Fujian Jianou Huayu Bamboo Industry Co. Ltd.
  • Jiangxi Shanyou Industry Co. Ltd.
  • Tengda Bamboo-Wood Co. Ltd.
  • Higuera Hardwoods LLC
  • Dasso Industrial Group Co. Ltd.
  • Xingli Bamboo Products Company
  • China Bamboo Textile Company Ltd.
  • Bamboo Bio Composites Sdn Bhd
  • Southern Bamboo Inc.
  • Jiangxi Feiyu Industry Co. Ltd.
  • Terragreen LLC
  • Anji Tianzhen Bamboo Flooring Co. Ltd.
Customization & Pricing Available Upon Request

Key Segments Profiled in the Bamboos Market Industry Survey

By End Use Industry:

  • Wood and Furniture
    • Timber Substitute
    • Plywood
    • Mat Boards
    • Flooring
    • Furniture
    • Outdoor Decking
  • Construction
    • Scaffolding
    • Housing
    • Roads
  • Food (bamboo shoots)
  • Pulp & Paper
  • Textile
  • Agriculture
  • Others (charcoal & handicrafts)

By Region:

  • North America
  • Latin America
  • Europe
  • Asia Pacific
  • Middle East and Africa

Frequently Asked Questions

Why China is witnessing higher growth?

Favorable weather conditions in the country promote growth.

What is Current Market Valuation?

The market is estimated to secure a valuation of US$ 6,533.11 million in 2023.

What is the Growth Forecast for this market?

The market is forecast to register a CAGR of 10.9% through 2033.

How is the Historical Performance of the Market?

From 2018 to 2022, the market expands at 8.4% CAGR.

Which End-use Industry holds Lucrative Opportunities?

The pulp & paper segment is projected to account for a 28% market share.

Table of Content

1. Executive Summary

    1.1. Global Market Outlook

    1.2. Demand-side Trends

    1.3. Supply-side Trends

    1.4. Technology Roadmap Analysis

    1.5. Analysis and Recommendations

2. Market Overview

    2.1. Market Coverage / Taxonomy

    2.2. Market Definition / Scope / Limitations

3. Market Background

    3.1. Market Dynamics

        3.1.1. Drivers

        3.1.2. Restraints

        3.1.3. Opportunity

        3.1.4. Trends

    3.2. Scenario Forecast

        3.2.1. Demand in Optimistic Scenario

        3.2.2. Demand in Likely Scenario

        3.2.3. Demand in Conservative Scenario

    3.3. Opportunity Map Analysis

    3.4. Product Life Cycle Analysis

    3.5. Supply Chain Analysis

        3.5.1. Supply Side Participants and their Roles

            3.5.1.1. Producers

            3.5.1.2. Mid-Level Participants (Traders/ Agents/ Brokers)

            3.5.1.3. Wholesalers and Distributors

        3.5.2. Value Added and Value Created at Node in the Supply Chain

        3.5.3. List of Raw Material Suppliers

        3.5.4. List of Existing and Potential Buyer’s

    3.6. Investment Feasibility Matrix

    3.7. Value Chain Analysis

        3.7.1. Profit Margin Analysis

        3.7.2. Wholesalers and Distributors

        3.7.3. Retailers

    3.8. PESTLE and Porter’s Analysis

    3.9. Regulatory Landscape

        3.9.1. By Key Regions

        3.9.2. By Key Countries

    3.10. Regional Parent Market Outlook

    3.11. Production and Consumption Statistics

    3.12. Import and Export Statistics

4. Global Market Analysis 2018 to 2022 and Forecast, 2023 to 2033

    4.1. Historical Market Size Value (US$ Bn) & Volume (Tons) Analysis, 2018 to 2022

    4.2. Current and Future Market Size Value (US$ Bn) & Volume (Tons) Projections, 2023 to 2033

        4.2.1. Y-o-Y Growth Trend Analysis

        4.2.2. Absolute $ Opportunity Analysis

5. Global Market Analysis 2018 to 2022 and Forecast 2023 to 2033, By End-Use Industry

    5.1. Introduction / Key Findings

    5.2. Historical Market Size Value (US$ Bn) & Volume (Tons) Analysis By End-Use Industry, 2018 to 2022

    5.3. Current and Future Market Size Value (US$ Bn) & Volume (Tons) Analysis and Forecast By End-Use Industry, 2023 to 2033

        5.3.1. Wood and Furniture

    5.4. 5.3.1.1 Timber Substitute

    5.5. 5.3.1.2 Plywood

    5.6. 5.3.1.3 Mat Boards

    5.7. 5.3.1.4 Flooring

    5.8. 5.3.1.5 Furniture

    5.9. 5.3.1.6 Outdoor Decking

        5.9.1. Construction

    5.10. 5.3.2.1 Scaffolding

    5.11. 5.3.2.2 Housing

    5.12. 5.3.2.3 Roads

        5.12.1. Food (bamboo shoots)

        5.12.2. Pulp & Paper

        5.12.3. Textile

        5.12.4. Agriculture

        5.12.5. Others 

    5.13. Y-o-Y Growth Trend Analysis By End-Use Industry, 2018 to 2022

    5.14. Absolute $ Opportunity Analysis By End-Use Industry, 2023 to 2033

6. Global Market Analysis 2018 to 2022 and Forecast 2023 to 2033, By Region

    6.1. Introduction

    6.2. Historical Market Size Value (US$ Bn) & Volume (Tons) Analysis By Region, 2018 to 2022

    6.3. Current Market Size Value (US$ Bn) & Volume (Tons) Analysis and Forecast By Region, 2023 to 2033

        6.3.1. North America

        6.3.2. Latin America

        6.3.3. Europe

        6.3.4. Asia Pacific

        6.3.5. MEA

    6.4. Market Attractiveness Analysis By Region

7. North America Market Analysis 2018 to 2022 and Forecast 2023 to 2033, By Country

    7.1. Historical Market Size Value (US$ Bn) & Volume (Tons) Trend Analysis By Market Taxonomy, 2018 to 2022

    7.2. Market Size Value (US$ Bn) & Volume (Tons) Forecast By Market Taxonomy, 2023 to 2033

        7.2.1. By Country

            7.2.1.1. U.S.

            7.2.1.2. Canada

        7.2.2. By End-Use Industry

    7.3. Market Attractiveness Analysis

        7.3.1. By Country

        7.3.2. By End-Use Industry

    7.4. Key Takeaways

8. Latin America Market Analysis 2018 to 2022 and Forecast 2023 to 2033, By Country

    8.1. Historical Market Size Value (US$ Bn) & Volume (Tons) Trend Analysis By Market Taxonomy, 2018 to 2022

    8.2. Market Size Value (US$ Bn) & Volume (Tons) Forecast By Market Taxonomy, 2023 to 2033

        8.2.1. By Country

            8.2.1.1. Brazil

            8.2.1.2. Mexico

            8.2.1.3. Rest of Latin America

        8.2.2. By End-Use Industry

    8.3. Market Attractiveness Analysis

        8.3.1. By Country

        8.3.2. By End-Use Industry

    8.4. Key Takeaways

9. Europe Market Analysis 2018 to 2022 and Forecast 2023 to 2033, By Country

    9.1. Historical Market Size Value (US$ Bn) & Volume (Tons) Trend Analysis By Market Taxonomy, 2018 to 2022

    9.2. Market Size Value (US$ Bn) & Volume (Tons) Forecast By Market Taxonomy, 2023 to 2033

        9.2.1. By Country

            9.2.1.1. Germany

            9.2.1.2. U.K.

            9.2.1.3. France

            9.2.1.4. Spain

            9.2.1.5. Italy

            9.2.1.6. Russia

            9.2.1.7. Rest of Europe

        9.2.2. By End-Use Industry

    9.3. Market Attractiveness Analysis

        9.3.1. By Country

        9.3.2. By End-Use Industry

    9.4. Key Takeaways

10. Asia Pacific Market Analysis 2018 to 2022 and Forecast 2023 to 2033, By Country

    10.1. Historical Market Size Value (US$ Bn) & Volume (Tons) Trend Analysis By Market Taxonomy, 2018 to 2022

    10.2. Market Size Value (US$ Bn) & Volume (Tons) Forecast By Market Taxonomy, 2023 to 2033

        10.2.1. By Country

            10.2.1.1. China

            10.2.1.2. Japan

            10.2.1.3. India

            10.2.1.4. South Korea

            10.2.1.5. Australia

            10.2.1.6. Rest of APAC

        10.2.2. By End-Use Industry

    10.3. Market Attractiveness Analysis

        10.3.1. By Country

        10.3.2. By End-Use Industry

    10.4. Key Takeaways

11. MEA Market Analysis 2018 to 2022 and Forecast 2023 to 2033, By Country

    11.1. Historical Market Size Value (US$ Bn) & Volume (Tons) Trend Analysis By Market Taxonomy, 2018 to 2022

    11.2. Market Size Value (US$ Bn) & Volume (Tons) Forecast By Market Taxonomy, 2023 to 2033

        11.2.1. By Country

            11.2.1.1. South Africa

            11.2.1.2. Saudi Arabia

            11.2.1.3. UAE

            11.2.1.4. Israel

            11.2.1.5. Rest of MEA

        11.2.2. By End-Use Industry

    11.3. Market Attractiveness Analysis

        11.3.1. By Country

        11.3.2. By End-Use Industry

    11.4. Key Takeaways

12. Key Countries Market Analysis

    12.1. United States

        12.1.1. Pricing Analysis

        12.1.2. Market Share Analysis, 2022

            12.1.2.1. By End-Use Industry

    12.2. Canada

        12.2.1. Pricing Analysis

        12.2.2. Market Share Analysis, 2022

            12.2.2.1. By End-Use Industry

    12.3. Brazil

        12.3.1. Pricing Analysis

        12.3.2. Market Share Analysis, 2022

            12.3.2.1. By End-Use Industry

    12.4. Mexico

        12.4.1. Pricing Analysis

        12.4.2. Market Share Analysis, 2022

            12.4.2.1. By End-Use Industry

    12.5. Germany

        12.5.1. Pricing Analysis

        12.5.2. Market Share Analysis, 2022

            12.5.2.1. By End-Use Industry

    12.6. U.K.

        12.6.1. Pricing Analysis

        12.6.2. Market Share Analysis, 2022

            12.6.2.1. By End-Use Industry

    12.7. France

        12.7.1. Pricing Analysis

        12.7.2. Market Share Analysis, 2022

            12.7.2.1. By End-Use Industry

    12.8. Spain

        12.8.1. Pricing Analysis

        12.8.2. Market Share Analysis, 2022

            12.8.2.1. By End-Use Industry

    12.9. Italy

        12.9.1. Pricing Analysis

        12.9.2. Market Share Analysis, 2022

            12.9.2.1. By End-Use Industry

    12.10. Russia

        12.10.1. Pricing Analysis

        12.10.2. Market Share Analysis, 2022

            12.10.2.1. By End-Use Industry

    12.11. China

        12.11.1. Pricing Analysis

        12.11.2. Market Share Analysis, 2022

            12.11.2.1. By End-Use Industry

    12.12. Japan

        12.12.1. Pricing Analysis

        12.12.2. Market Share Analysis, 2022

            12.12.2.1. By End-Use Industry

    12.13. India

        12.13.1. Pricing Analysis

        12.13.2. Market Share Analysis, 2022

            12.13.2.1. By End-Use Industry

    12.14. South Korea

        12.14.1. Pricing Analysis

        12.14.2. Market Share Analysis, 2022

            12.14.2.1. By End-Use Industry

    12.15. Australia

        12.15.1. Pricing Analysis

        12.15.2. Market Share Analysis, 2022

            12.15.2.1. By End-Use Industry

    12.16. South Africa

        12.16.1. Pricing Analysis

        12.16.2. Market Share Analysis, 2022

            12.16.2.1. By End-Use Industry

    12.17. Saudi Arabia

        12.17.1. Pricing Analysis

        12.17.2. Market Share Analysis, 2022

            12.17.2.1. By End-Use Industry

    12.18. UAE

        12.18.1. Pricing Analysis

        12.18.2. Market Share Analysis, 2022

            12.18.2.1. By End-Use Industry

    12.19. Israel

        12.19.1. Pricing Analysis

        12.19.2. Market Share Analysis, 2022

            12.19.2.1. By End-Use Industry

13. Market Structure Analysis

    13.1. Competition Dashboard

    13.2. Competition Benchmarking

    13.3. Market Share Analysis of Top Players

        13.3.1. By Regional

        13.3.2. By End-Use Industry

14. Competition Analysis

    14.1. Competition Deep Dive

        14.1.1. Moso International BV

            14.1.1.1. Overview

            14.1.1.2. Product Portfolio

            14.1.1.3. Profitability by Market Segments

            14.1.1.4. Sales Footprint

            14.1.1.5. Strategy Overview

                14.1.1.5.1. Marketing Strategy

                14.1.1.5.2. Product Strategy

                14.1.1.5.3. Channel Strategy

        14.1.2. Shanghai Tenbro Bamboo Textile Co. Ltd,

            14.1.2.1. Overview

            14.1.2.2. Product Portfolio

            14.1.2.3. Profitability by Market Segments

            14.1.2.4. Sales Footprint

            14.1.2.5. Strategy Overview

                14.1.2.5.1. Marketing Strategy

                14.1.2.5.2. Product Strategy

                14.1.2.5.3. Channel Strategy

        14.1.3. Kerala State Bamboo Corporation Ltd,

            14.1.3.1. Overview

            14.1.3.2. Product Portfolio

            14.1.3.3. Profitability by Market Segments

            14.1.3.4. Sales Footprint

            14.1.3.5. Strategy Overview

                14.1.3.5.1. Marketing Strategy

                14.1.3.5.2. Product Strategy

                14.1.3.5.3. Channel Strategy

        14.1.4. Bamboo Australia Pty. Ltd.

            14.1.4.1. Overview

            14.1.4.2. Product Portfolio

            14.1.4.3. Profitability by Market Segments

            14.1.4.4. Sales Footprint

            14.1.4.5. Strategy Overview

                14.1.4.5.1. Marketing Strategy

                14.1.4.5.2. Product Strategy

                14.1.4.5.3. Channel Strategy

        14.1.5. Ecoplanet Bamboo

            14.1.5.1. Overview

            14.1.5.2. Product Portfolio

            14.1.5.3. Profitability by Market Segments

            14.1.5.4. Sales Footprint

            14.1.5.5. Strategy Overview

                14.1.5.5.1. Marketing Strategy

                14.1.5.5.2. Product Strategy

                14.1.5.5.3. Channel Strategy

        14.1.6. Smith & Fong Co. Inc.

            14.1.6.1. Overview

            14.1.6.2. Product Portfolio

            14.1.6.3. Profitability by Market Segments

            14.1.6.4. Sales Footprint

            14.1.6.5. Strategy Overview

                14.1.6.5.1. Marketing Strategy

                14.1.6.5.2. Product Strategy

                14.1.6.5.3. Channel Strategy

        14.1.7. Jiangxi Kangda Bamboo Ware Group Co. Ltd.

            14.1.7.1. Overview

            14.1.7.2. Product Portfolio

            14.1.7.3. Profitability by Market Segments

            14.1.7.4. Sales Footprint

            14.1.7.5. Strategy Overview

                14.1.7.5.1. Marketing Strategy

                14.1.7.5.2. Product Strategy

                14.1.7.5.3. Channel Strategy

        14.1.8. Fujian Jianou Huayu Bamboo Industry Co. Ltd.

            14.1.8.1. Overview

            14.1.8.2. Product Portfolio

            14.1.8.3. Profitability by Market Segments

            14.1.8.4. Sales Footprint

            14.1.8.5. Strategy Overview

                14.1.8.5.1. Marketing Strategy

                14.1.8.5.2. Product Strategy

                14.1.8.5.3. Channel Strategy

        14.1.9. Jiangxi Shanyou Industry Co. Ltd.

            14.1.9.1. Overview

            14.1.9.2. Product Portfolio

            14.1.9.3. Profitability by Market Segments

            14.1.9.4. Sales Footprint

            14.1.9.5. Strategy Overview

                14.1.9.5.1. Marketing Strategy

                14.1.9.5.2. Product Strategy

                14.1.9.5.3. Channel Strategy

        14.1.10. Tengda Bamboo-Wood Co. Ltd.

            14.1.10.1. Overview

            14.1.10.2. Product Portfolio

            14.1.10.3. Profitability by Market Segments

            14.1.10.4. Sales Footprint

            14.1.10.5. Strategy Overview

                14.1.10.5.1. Marketing Strategy

                14.1.10.5.2. Product Strategy

                14.1.10.5.3. Channel Strategy

15. Assumptions & Acronyms Used

16. Research Methodology

Don't pay for what you don't need

Customize your report by selecting specific countries or regions and save 30%!

List of Tables

Table 1: Global Market Value (US$ Bn) Forecast by Region, 2018 to 2033

Table 2: Global Market Volume (Tons) Forecast by Region, 2018 to 2033

Table 3: Global Market Value (US$ Bn) Forecast by End-Use Industry, 2018 to 2033

Table 4: Global Market Volume (Tons) Forecast by End-Use Industry, 2018 to 2033

Table 5: North America Market Value (US$ Bn) Forecast by Country, 2018 to 2033

Table 6: North America Market Volume (Tons) Forecast by Country, 2018 to 2033

Table 7: North America Market Value (US$ Bn) Forecast by End-Use Industry, 2018 to 2033

Table 8: North America Market Volume (Tons) Forecast by End-Use Industry, 2018 to 2033

Table 9: Latin America Market Value (US$ Bn) Forecast by Country, 2018 to 2033

Table 10: Latin America Market Volume (Tons) Forecast by Country, 2018 to 2033

Table 11: Latin America Market Value (US$ Bn) Forecast by End-Use Industry, 2018 to 2033

Table 12: Latin America Market Volume (Tons) Forecast by End-Use Industry, 2018 to 2033

Table 13: Europe Market Value (US$ Bn) Forecast by Country, 2018 to 2033

Table 14: Europe Market Volume (Tons) Forecast by Country, 2018 to 2033

Table 15: Europe Market Value (US$ Bn) Forecast by End-Use Industry, 2018 to 2033

Table 16: Europe Market Volume (Tons) Forecast by End-Use Industry, 2018 to 2033

Table 17: Asia Pacific Market Value (US$ Bn) Forecast by Country, 2018 to 2033

Table 18: Asia Pacific Market Volume (Tons) Forecast by Country, 2018 to 2033

Table 19: Asia Pacific Market Value (US$ Bn) Forecast by End-Use Industry, 2018 to 2033

Table 20: Asia Pacific Market Volume (Tons) Forecast by End-Use Industry, 2018 to 2033

Table 21: MEA Market Value (US$ Bn) Forecast by Country, 2018 to 2033

Table 22: MEA Market Volume (Tons) Forecast by Country, 2018 to 2033

Table 23: MEA Market Value (US$ Bn) Forecast by End-Use Industry, 2018 to 2033

Table 24: MEA Market Volume (Tons) Forecast by End-Use Industry, 2018 to 2033
Nikhil Kaitwade
Nikhil Kaitwade

Principal Consultant

Talk to Analyst

Find your sweet spots for generating winning opportunities in this market.

List of Charts

Figure 1: Global Market Value (US$ Bn) by End-Use Industry, 2023 to 2033

Figure 2: Global Market Value (US$ Bn) by Region, 2023 to 2033

Figure 3: Global Market Value (US$ Bn) Analysis by Region, 2018 to 2033

Figure 4: Global Market Volume (Tons) Analysis by Region, 2018 to 2033

Figure 5: Global Market Value Share (%) and BPS Analysis by Region, 2023 to 2033

Figure 6: Global Market Y-o-Y Growth (%) Projections by Region, 2023 to 2033

Figure 7: Global Market Value (US$ Bn) Analysis by End-Use Industry, 2018 to 2033

Figure 8: Global Market Volume (Tons) Analysis by End-Use Industry, 2018 to 2033

Figure 9: Global Market Value Share (%) and BPS Analysis by End-Use Industry, 2023 to 2033

Figure 10: Global Market Y-o-Y Growth (%) Projections by End-Use Industry, 2023 to 2033

Figure 11: Global Market Attractiveness by End-Use Industry, 2023 to 2033

Figure 12: Global Market Attractiveness by Region, 2023 to 2033

Figure 13: North America Market Value (US$ Bn) by End-Use Industry, 2023 to 2033

Figure 14: North America Market Value (US$ Bn) by Country, 2023 to 2033

Figure 15: North America Market Value (US$ Bn) Analysis by Country, 2018 to 2033

Figure 16: North America Market Volume (Tons) Analysis by Country, 2018 to 2033

Figure 17: North America Market Value Share (%) and BPS Analysis by Country, 2023 to 2033

Figure 18: North America Market Y-o-Y Growth (%) Projections by Country, 2023 to 2033

Figure 19: North America Market Value (US$ Bn) Analysis by End-Use Industry, 2018 to 2033

Figure 20: North America Market Volume (Tons) Analysis by End-Use Industry, 2018 to 2033

Figure 21: North America Market Value Share (%) and BPS Analysis by End-Use Industry, 2023 to 2033

Figure 22: North America Market Y-o-Y Growth (%) Projections by End-Use Industry, 2023 to 2033

Figure 23: North America Market Attractiveness by End-Use Industry, 2023 to 2033

Figure 24: North America Market Attractiveness by Country, 2023 to 2033

Figure 25: Latin America Market Value (US$ Bn) by End-Use Industry, 2023 to 2033

Figure 26: Latin America Market Value (US$ Bn) by Country, 2023 to 2033

Figure 27: Latin America Market Value (US$ Bn) Analysis by Country, 2018 to 2033

Figure 28: Latin America Market Volume (Tons) Analysis by Country, 2018 to 2033

Figure 29: Latin America Market Value Share (%) and BPS Analysis by Country, 2023 to 2033

Figure 30: Latin America Market Y-o-Y Growth (%) Projections by Country, 2023 to 2033

Figure 31: Latin America Market Value (US$ Bn) Analysis by End-Use Industry, 2018 to 2033

Figure 32: Latin America Market Volume (Tons) Analysis by End-Use Industry, 2018 to 2033

Figure 33: Latin America Market Value Share (%) and BPS Analysis by End-Use Industry, 2023 to 2033

Figure 34: Latin America Market Y-o-Y Growth (%) Projections by End-Use Industry, 2023 to 2033

Figure 35: Latin America Market Attractiveness by End-Use Industry, 2023 to 2033

Figure 36: Latin America Market Attractiveness by Country, 2023 to 2033

Figure 37: Europe Market Value (US$ Bn) by End-Use Industry, 2023 to 2033

Figure 38: Europe Market Value (US$ Bn) by Country, 2023 to 2033

Figure 39: Europe Market Value (US$ Bn) Analysis by Country, 2018 to 2033

Figure 40: Europe Market Volume (Tons) Analysis by Country, 2018 to 2033

Figure 41: Europe Market Value Share (%) and BPS Analysis by Country, 2023 to 2033

Figure 42: Europe Market Y-o-Y Growth (%) Projections by Country, 2023 to 2033

Figure 43: Europe Market Value (US$ Bn) Analysis by End-Use Industry, 2018 to 2033

Figure 44: Europe Market Volume (Tons) Analysis by End-Use Industry, 2018 to 2033

Figure 45: Europe Market Value Share (%) and BPS Analysis by End-Use Industry, 2023 to 2033

Figure 46: Europe Market Y-o-Y Growth (%) Projections by End-Use Industry, 2023 to 2033

Figure 47: Europe Market Attractiveness by End-Use Industry, 2023 to 2033

Figure 48: Europe Market Attractiveness by Country, 2023 to 2033

Figure 49: Asia Pacific Market Value (US$ Bn) by End-Use Industry, 2023 to 2033

Figure 50: Asia Pacific Market Value (US$ Bn) by Country, 2023 to 2033

Figure 51: Asia Pacific Market Value (US$ Bn) Analysis by Country, 2018 to 2033

Figure 52: Asia Pacific Market Volume (Tons) Analysis by Country, 2018 to 2033

Figure 53: Asia Pacific Market Value Share (%) and BPS Analysis by Country, 2023 to 2033

Figure 54: Asia Pacific Market Y-o-Y Growth (%) Projections by Country, 2023 to 2033

Figure 55: Asia Pacific Market Value (US$ Bn) Analysis by End-Use Industry, 2018 to 2033

Figure 56: Asia Pacific Market Volume (Tons) Analysis by End-Use Industry, 2018 to 2033

Figure 57: Asia Pacific Market Value Share (%) and BPS Analysis by End-Use Industry, 2023 to 2033

Figure 58: Asia Pacific Market Y-o-Y Growth (%) Projections by End-Use Industry, 2023 to 2033

Figure 59: Asia Pacific Market Attractiveness by End-Use Industry, 2023 to 2033

Figure 60: Asia Pacific Market Attractiveness by Country, 2023 to 2033

Figure 61: MEA Market Value (US$ Bn) by End-Use Industry, 2023 to 2033

Figure 62: MEA Market Value (US$ Bn) by Country, 2023 to 2033

Figure 63: MEA Market Value (US$ Bn) Analysis by Country, 2018 to 2033

Figure 64: MEA Market Volume (Tons) Analysis by Country, 2018 to 2033

Figure 65: MEA Market Value Share (%) and BPS Analysis by Country, 2023 to 2033

Figure 66: MEA Market Y-o-Y Growth (%) Projections by Country, 2023 to 2033

Figure 67: MEA Market Value (US$ Bn) Analysis by End-Use Industry, 2018 to 2033

Figure 68: MEA Market Volume (Tons) Analysis by End-Use Industry, 2018 to 2033

Figure 69: MEA Market Value Share (%) and BPS Analysis by End-Use Industry, 2023 to 2033

Figure 70: MEA Market Y-o-Y Growth (%) Projections by End-Use Industry, 2023 to 2033

Figure 71: MEA Market Attractiveness by End-Use Industry, 2023 to 2033

Figure 72: MEA Market Attractiveness by Country, 2023 to 2033

Recommendations

Packaging

Bamboo Straw Market

Published : February 2024

Packaging

Bamboo Packaging Market

Published : August 2023

Consumer Product

Bamboo Products Market

Published : February 2023

Consumer Product

Bamboo Apparel Market

Published : December 2022

Explore Chemicals & Materials Insights

View Reports