Methodology

Wet Strength Paper Market Size, Share & Forecast Outlook 2025 to 2035

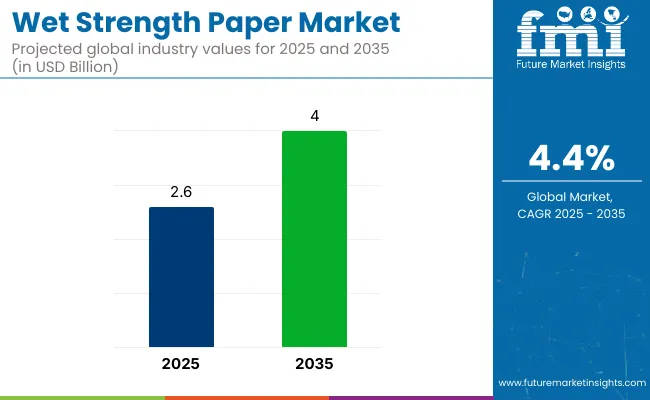
The global wet strength paper market is set to record USD 2.6 billion in 2025 and USD 4 billion by 2035, registering a CAGR of 4.4% during the forecast period. Industry growth is being driven by the increasing demand for high-performance paper products in various applications such as packaging, tissues, labels, andindustrial paper products. Wet strength paper, which maintains its integrity and performance when exposed to moisture, is becoming essential in industries requiring enhanced durability and functionality in humid conditions.
Quick Stats for Wet Strength Paper Market

  • Industry Value (2025): USD 2.6 billion
  • Forecast Value (2035): USD 4 billion
  • Forecast CAGR: 4.4%
  • Leading Segment in 2025: Kraft Paper (58% share)
  • Key Growth Region: Asia (China), North America
  • Top Key Players: Pixelle Specialty Solutions®, EMI Specialty Papers, WestRock Company, Golden Paper Company Limited, American Kraft Paper Industries LLC, Papertec Inc.

Wet Strength Paper Market

The rise in the use of wet strength paper in food packaging and consumer goods packaging is further fuelingindustry expansion. As environmental concerns around single-use plastics increase, the demand for eco-friendly alternatives like wet strength paper is also on the rise.

The development of sustainable wet strength agents, which offer improved biodegradability and environmental performance, is helping meet the rising consumer demand for eco-friendly packaging solutions. These innovations are expected to accelerate the adoption of wet strength paper across industries.

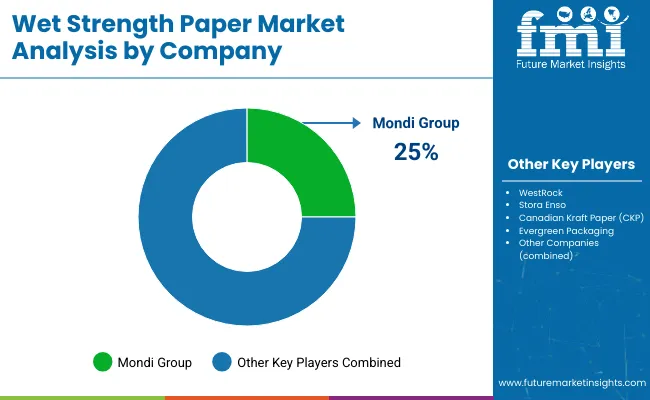
Key players such as Mondi Group, WestRock, Stora Enso, Canadian Kraft Paper (CKP), and Evergreen Packaging are investing in research and development to improve the performance, sustainability, and cost-effectiveness of wet strength paper.

The growing focus on sustainable packaging solutions and the increasing shift toward paper-based packaging for food and beverage products are expected to further contribute to industry growth. As regulatory pressures around packaging materials tighten globally, the wet strength paper Market is expected to witness consistent growth through 2035.

Analyzing Wet Strength Paper Market by Top Investment Segments

The wet strength paper industry is expected to experience significant growth by 2025, driven by increased demand for durable, moisture-resistant packaging materials, with a focus on kraft paper, virgin pulp, and beverage labels.

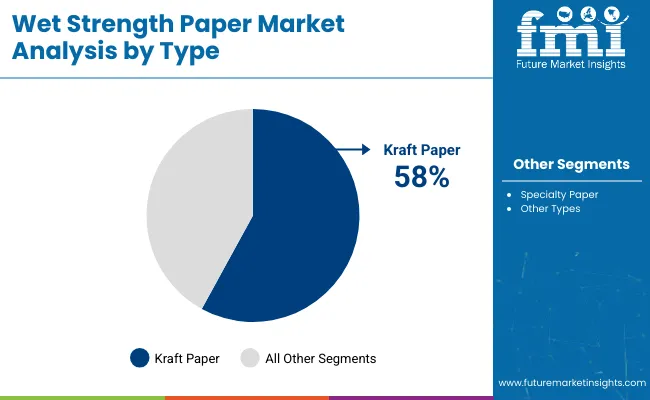
Kraft Paper to Lead Industry Share with 58% in 2025

Kraft paper is projected to dominate the wet strength paper industry with a 58% share in 2025. Known for its strength, durability, and resistance to tearing, it is widely used in applications requiring high performance under wet conditions. Kraft paper’s ability to withstand harsh environments makes it ideal for food and beverage packaging, especially for items that require water resistance.
  • Leading paper manufacturers like International Paper and WestRock are focusing on producing kraft paper that is both strong and eco-friendly.
  • As sustainability becomes increasingly important, the demand for kraft paper continues to grow in various industries.

Wet Strength Paper Market Analysis By Type

Virgin Pulp Expected to Capture 60% Industry Share in 2025

Virgin pulp is projected to account for 60% of the wet strength paper industry in 2025. This raw material is essential for creating high-quality, strong, and durable paper products. Virgin pulp provides superior uniformity, tensile strength, and resistance to tearing, which are necessary for wet strength paper applications.

  • Major producers like Sappi and Stora Enso are enhancing their virgin pulp manufacturing capabilities to meet the increasing demand for water-resistant packaging.
  • Virgin pulp's role in producing high-performance paper products across the packaging industry ensures it remains a dominant raw material in the wet strength paper industry.

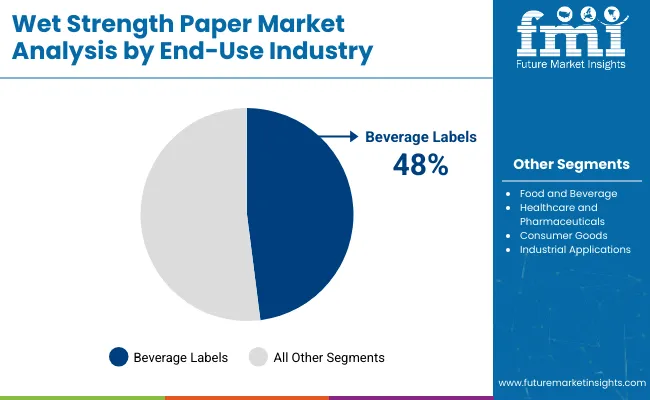
Beverage Labels to Dominate End-Use Industry with 48% Share in 2025

Beverage labels are expected to lead the end-use industry segment of the wet strength paper industry, capturing 48% of the industry share in 2025. The demand for durable, water-resistant labels is driven by the growing need for high-quality, moisture-resistant packaging for beverages.
  • Companies like Mondi and Label Apeel are developing innovative wet-strength paper solutions that offer superior durability and printability, catering to the increasing demand for sustainable packaging materials.
  • As the beverage industry shifts toward eco-friendly solutions, wet-strength paper continues to play a crucial role in beverage labeling applications.

Wet Strength Paper Market Analysis By End Use Industry

Top Wet Strength Paper Industry Dynamics

The wet strength paper industry is growing due to rising demand for moisture-resistant packaging solutions. However, high production costs and environmental concerns related to additives are limiting widespread adoption and growth.

Increasing demand for durable, moisture-resistant packaging solutions is driving industry growth

The demand for durable and moisture-resistant packaging solutions is significantly boosting the wet strength paper industry. Industries such as food and beverage, pharmaceuticals, and consumer goods are increasingly adopting wet strength paper to ensure product integrity during transportation and storage. This specialized paper offers enhanced resistance to moisture, preventing degradation and maintaining the quality of packaged goods.

Technological advancements in resin formulations and fiber treatments have further improved the performance of wet strength paper, making it a preferred choice for manufacturers seeking reliable and cost-effective packaging materials. As global trade and e-commerce continue to grow, the need for such packaging solutions is expected to rise correspondingly.

High production costs and environmental concerns related to certain additives are limiting industry growth

Despite the advantages, the wet strength paper industry faces challenges related to high production costs and environmental concerns. The incorporation of wet strength additives, such as resins, into paper products can increase manufacturing expenses, making them less competitive compared to traditional packaging materials.

Additionally, certain additives may raise environmental concerns due to their chemical composition and potential impact on recyclability. Regulatory pressures and consumer preference for eco-friendly products are prompting manufacturers to seek alternative, sustainable solutions. Balancing performance, cost, and environmental impact remains a critical challenge for the wet strength paper industry as it strives to meet evolving industry demands.

Analyzing Top Countries Manufacturing, Distributing, and Supplying Wet Strength Paper

The wet strength paper industry is expected to grow steadily through 2035, driven by rising demand for durable packaging and tissue products. China and India lead growth, while the USA and UK focus on innovation and sustainability.
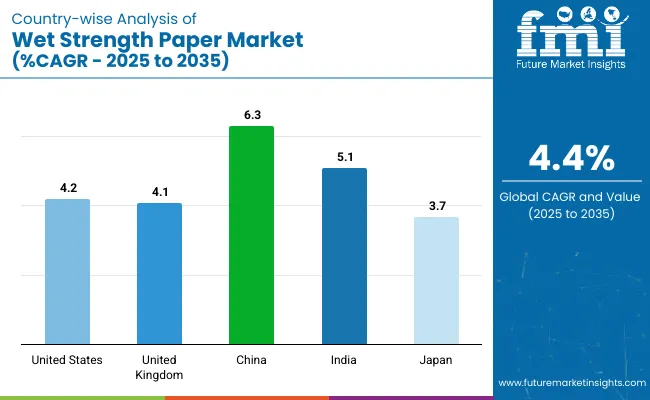
Country Wise Analysis Of Wet Strength Paper Market Cagr 2025 To 2035

Countries Estimated CAGR (%)
United States 4.2%
United Kingdom 4.1%
China 6.3%
India 5.1%
Japan 3.7%

An Overview of USA Wet Strength Paper Market Growth

The United States wet strength paper industry is expected to grow at a CAGR of 4.2% through 2035. Growth is driven by increasing demand for packaging and tissue products with enhanced durability.

  • Companies such as Georgia-Pacific, Kimberly-Clark, and International Paper are investing in the development of wet-strength paper for packaging applications and hygiene products.
  • Regulations promoting sustainability and reducing plastic use contribute to the growing demand for paper-based products. The industry is supported by technological advancements in paper manufacturing, improving performance and cost efficiency, and by the rising preference for eco-friendly packaging solutions.

UK Wet Strength Paper Market Analysis and Growth

The United Kingdom wet strength paper industry is projected to grow at a CAGR of 4.1% through 2035. Growth is driven by the demand for sustainable packaging solutions and eco-friendly alternatives to plastic.

  • Leading companies like DS Smith, Smurfit Kappa, and UPM-Kymmene are innovating in wet-strength paper for packaging and tissue products. Government-backed education campaigns and consumer awareness programs support industry penetration.
  • Innovation in smart and customizable machines is attracting industries in food, beverage, and consumer goods. Increased online retail and e-commerce activities further strengthen industry demand, contributing to steady growth in the UK

In-Depth Analysis of China Wet Strength Paper Sales

The wet strength paper industry is projected to grow at a CAGR of 6.3% through 2035. Expansion is driven by rapid industrialization and increased demand for packaging automation. Domestic companies like Shanghai Ruian and Jinan Xintian Packaging

  • Machinery are investing heavily in developing advanced shrink tunnel technology. Government policies promoting manufacturing modernization and automation are facilitating growth.
  • Demand from the food, beverage, and pharmaceutical industries is rising, alongside increased e-commerce and export activities. Innovations in energy-efficient, high-speed machines and improvements in digital monitoring technologies are boosting adoption, supporting industry growth in China.

An Overview of India Wet Strength Paper Market Growth

The wet strength paper industry is expected to grow at a CAGR of 5.1% through 2035. The industry is being fueled by expanding industrial infrastructure and rising demand for efficient packaging solutions across various sectors. Companies like Universal Packaging and Altech are providing advanced shrink tunnel solutions for food, beverage, and pharmaceutical sectors.

  • Increasing demand from e-commerce and urban areas is supporting growth. Government initiatives focusing on industrial automation and sustainability practices are promoting the adoption of energy-efficient technologies.
  • Innovations in machine designs and digital monitoring solutions are contributing to the industry’s steady expansion in India.

Japan Wet Strength Paper Market Analysis and Growth

The wet strength paper industry is forecasted to grow at a CAGR of 3.7% through 2035. Growth is supported by technological advancements and stringent environmental regulations. Companies such as Kawasaki Heavy Industries and Fujitsu are developing high-performance machines with a focus on efficiency and reduced emissions.
  • Increasing demand from the food, beverage, and pharmaceutical sectors for packaging automation is driving the industry.
  • Government regulations promoting energy conservation and sustainability are facilitating adoption. The industry benefits from Japan’s strong focus on precision, automation, and quality, ensuring continued growth despite slower expansion.

Leading Wet Strength Paper Industry Suppliers

Wet Strength Paper Market Analysis By Company

The industry is marked by a blend of established leaders and emerging players. Key companies like Pixelle Specialty Solutions, WestRock, and Twin Rivers Paper Company dominate the industry with broad product ranges and advanced manufacturing capabilities. These giants invest heavily in R\&D to innovate and improve paper strength and sustainability.

For instance, WestRock is focusing on creating environmentally friendly, high-performance wet strength paper. Emerging players, such as Golden Paper Company and Framarx/Waxstar, target niche segments by offering specialized products. They often capitalize on local production capabilities and flexibility to cater to specific regional demands.

The industry presents moderate entry barriers due to the strong position of established players with vast distribution networks. However, innovation in sustainable products is a key opportunity for new entrants. While large players are consolidating to increase their global reach, the industry remains fragmented, offering growth potential for smaller, specialized companies focusing on custom solutions.

Recent Wet Strength Paper Industry News

Between 2024 and 2025, notable advancements were made in the wet strength paper industry. In 2024, Mondi Group launched a new line of wet strength paper products, designed to offer enhanced durability and moisture resistance.In 2025, Canadian Kraft Paper introduced an innovative wet strength sack kraft paper with improved strength properties.

These developments highlight the industry's focus on sustainability and the demand for high-performance paper solutions. Both companies continue to innovate in response to growing industry needs, showcasing their commitment to providing durable, eco-friendly solutions for various industrial and commercial applications.

Research Coverage and Scope Summary

Report Attributes Details
Current Total Industry Size (2025) USD 2.6 billion
Projected Industry Size (2035) USD 4 billion
CAGR (2025 to 2035) 4.4%
Base Year for Estimation 2024
Historical Period 2020 to 2024
Projections Period 2025 to 2035
Quantitative Units USD billion for value
Types Analyzed (Segment 1) Kraft paper; Specialty paper; Other types (e.g., absorbent paper)
Raw Materials Analyzed (Segment 2) Virgin pulp; Recycled pulp
End-Use Industries Covered (Segment 3) Beverage labels; Food and beverage; Healthcare and pharmaceuticals; Consumer goods; Industrial applications
Regions Covered North America; Europe; Asia Pacific
Countries Covered United States; Canada; Germany; United Kingdom; France; Italy; Spain; Netherlands; China; India; Japan
Leading Industry Suppliers Pixelle Specialty Solutions®, EMI Specialty Papers, WestRock Company, Golden Paper Company Limited, American Kraft Paper Industries LLC, Papertec Inc., Twin Rivers Paper Company, FLEXLINK, LLC, Gordon Paper Company Inc, and Framarx / Waxstar.
Additional Attributes Dollar sales by paper type ( kraft vs specialty); Trends in sustainability and recycling rates for wet strength paper; Growth of wet strength paper in eco-friendly packaging applications; Regional demand for beverage labels and food packaging

Leading Players

  • Pixelle Specialty Solutions®
  • EMI Specialty Papers
  • WestRock Company
  • Golden paper Company Limited
  • American Kraft Paper Industries LLC
  • Papertec Inc.
  • Twin Rivers Paper Company
  • FLEXLINK, LLC
  • Gordon Paper company Inc
  • framarx/waxstar

Wet Strength Paper Market Analyzed by Key Investment Segments

By Type:

The industry is segmented into kraft paper, specialty paper, and other types (e.g., absorbent paper).

By Raw Material:

The industry includes virgin pulp and recycled pulp.

By End-Use Industry:

The industry covers beverage labels, food and beverage, healthcare and pharmaceuticals, consumer goods, and industrial applications.

By Region:

The industry spans North America, Europe, and Asia Pacific.

Frequently Asked Questions

What is the projected size of the wet strength paper industry by 2035?

The wet strength paper industry is expected to reach USD 4 billion by 2035.

What is the estimated industry size of the wet strength paper industry in 2025?

The industry size is projected to be USD 2.6 billion in 2025.

What is the CAGR of the wet strength paper industry from 2025 to 2035?

The wet strength paper industry is expected to grow at a CAGR of 4.4% from 2025 to 2035.

Who are the key players in the wet strength paper industry?

Key players include Pixelle Specialty Solutions®, EMI Specialty Papers, WestRock Company, Golden Paper Company Limited, American Kraft Paper Industries LLC, Papertec Inc., Twin Rivers Paper Company, FLEXLINK, LLC, Gordon Paper Company Inc, and Framarx/Waxstar.

What factors are driving the demand for wet strength paper?

The demand for wet strength paper is driven by its increasing use in packaging, particularly for food packaging, as well as its enhanced durability and strength in wet conditions.

Table of Content

  1. Executive Summary
    • Global Market Outlook
    • Demand-side Trends
    • Supply-side Trends
    • Technology Roadmap Analysis
    • Analysis and Recommendations
  2. Market Overview
    • Market Coverage / Taxonomy
    • Market Definition / Scope / Limitations
  3. Market Background
    • Market Dynamics
      • Drivers
      • Restraints
      • Opportunity
      • Trends
    • Scenario Forecast
      • Demand in Optimistic Scenario
      • Demand in Likely Scenario
      • Demand in Conservative Scenario
    • Opportunity Map Analysis
    • Product Life Cycle Analysis
    • Supply Chain Analysis
      • Supply Side Participants and their Roles
        • Producers
        • Mid-Level Participants (Traders/ Agents/ Brokers)
        • Wholesalers and Distributors
      • Value Added and Value Created at Node in the Supply Chain
      • List of Raw Material Suppliers
      • List of Existing and Potential Buyer’s
    • Investment Feasibility Matrix
    • Value Chain Analysis
      • Profit Margin Analysis
      • Wholesalers and Distributors
      • Retailers
    • PESTLE and Porter’s Analysis
    • Regulatory Landscape
      • By Key Regions
      • By Key Countries
    • Regional Parent Market Outlook
    • Production and Consumption Statistics
    • Import and Export Statistics
  4. Global Market Analysis 2020 to 2024 and Forecast, 2025 to 2035
    • Historical Market Size Value (USD Billion) & Volume (MT) Analysis, 2020 to 2024
    • Current and Future Market Size Value (USD Billion) & Volume (MT) Projections, 2025 to 2035
      • Y-o-Y Growth Trend Analysis
      • Absolute $ Opportunity Analysis
  5. Global Market Pricing Analysis 2020 to 2024 and Forecast 2025 to 2035
  6. Global Market Analysis 2020 to 2024 and Forecast 2025 to 2035, By Type
    • Introduction / Key Findings
    • Historical Market Size Value (USD Billion) & Volume (MT) Analysis By Type, 2020 to 2024
    • Current and Future Market Size Value (USD Billion) & Volume (MT) Analysis and Forecast By Type, 2025 to 2035
      • Kraft Paper
      • Specialty Paper
      • Other Types (Absorbent Paper)
    • Y-o-Y Growth Trend Analysis By Type, 2020 to 2024
    • Absolute $ Opportunity Analysis By Type, 2025 to 2035
  7. Global Market Analysis 2020 to 2024 and Forecast 2025 to 2035, By Raw Material
    • Introduction / Key Findings
    • Historical Market Size Value (USD Billion) & Volume (MT) Analysis By Raw Material, 2020 to 2024
    • Current and Future Market Size Value (USD Billion) & Volume (MT) Analysis and Forecast By Raw Material, 2025 to 2035
      • Virgin Pulp
      • Recycled Pulp
    • Y-o-Y Growth Trend Analysis By Raw Material, 2020 to 2024
    • Absolute $ Opportunity Analysis By Raw Material, 2025 to 2035
  8. Global Market Analysis 2020 to 2024 and Forecast 2025 to 2035, By End-use Industry
    • Introduction / Key Findings
    • Historical Market Size Value (USD Billion) & Volume (MT) Analysis By End-use Industry, 2020 to 2024
    • Current and Future Market Size Value (USD Billion) & Volume (MT) Analysis and Forecast By End-use Industry, 2025 to 2035
      • Beverage Labels
      • Food and Beverage
      • Healthcare and Pharmaceuticals
      • Consumer Goods
      • Industrial Applications
    • Y-o-Y Growth Trend Analysis By End-use Industry, 2020 to 2024
    • Absolute $ Opportunity Analysis By End-use Industry, 2025 to 2035
  9. Global Market Analysis 2020 to 2024 and Forecast 2025 to 2035, By Region
    • Introduction
    • Historical Market Size Value (USD Billion) & Volume (MT) Analysis By Region, 2020 to 2024
    • Current Market Size Value (USD Billion) & Volume (MT) Analysis and Forecast By Region, 2025 to 2035
      • North America
      • Latin America
      • Western Europe
      • Eastern Europe
      • East Asia
      • South Asia & Pacific
      • Middle East and Africa
    • Market Attractiveness Analysis By Region
  10. North America Market Analysis 2020 to 2024 and Forecast 2025 to 2035, By Country
    • Historical Market Size Value (USD Billion) & Volume (MT) Trend Analysis By Market Taxonomy, 2020 to 2024
    • Market Size Value (USD Billion) & Volume (MT) Forecast By Market Taxonomy, 2025 to 2035
      • By Country
        • USA
        • Canada
        • Mexico
      • By Type
      • By Raw Material
      • By End-use Industry
    • Market Attractiveness Analysis
      • By Country
      • By Type
      • By Raw Material
      • By End-use Industry
    • Key Takeaways
  11. Latin America Market Analysis 2020 to 2024 and Forecast 2025 to 2035, By Country
    • Historical Market Size Value (USD Billion) & Volume (MT) Trend Analysis By Market Taxonomy, 2020 to 2024
    • Market Size Value (USD Billion) & Volume (MT) Forecast By Market Taxonomy, 2025 to 2035
      • By Country
        • Brazil
        • Argentina
        • Rest of LATAM
      • By Type
      • By Raw Material
      • By End-use Industry
    • Market Attractiveness Analysis
      • By Country
      • By Type
      • By Raw Material
      • By End-use Industry
    • Key Takeaways
  12. Western Europe Market Analysis 2020 to 2024 and Forecast 2025 to 2035, By Country
    • Historical Market Size Value (USD Billion) & Volume (MT) Trend Analysis By Market Taxonomy, 2020 to 2024
    • Market Size Value (USD Billion) & Volume (MT) Forecast By Market Taxonomy, 2025 to 2035
      • By Country
        • Germany
        • Italy
        • France
        • UK
        • Spain
        • BENELUX
        • Nordic
        • Rest of W.Europe
      • By Type
      • By Raw Material
      • By End-use Industry
    • Market Attractiveness Analysis
      • By Country
      • By Type
      • By Raw Material
      • By End-use Industry
    • Key Takeaways
  13. Eastern Europe Market Analysis 2020 to 2024 and Forecast 2025 to 2035, By Country
    • Historical Market Size Value (USD Billion) & Volume (MT) Trend Analysis By Market Taxonomy, 2020 to 2024
    • Market Size Value (USD Billion) & Volume (MT) Forecast By Market Taxonomy, 2025 to 2035
      • By Country
        • Russia
        • Hungary
        • Poland
        • Balkan & Baltics
        • Rest of E. Europe
      • By Type
      • By Raw Material
      • By End-use Industry
    • Market Attractiveness Analysis
      • By Country
      • By Type
      • By Raw Material
      • By End-use Industry
    • Key Takeaways
  14. East Asia Market Analysis 2020 to 2024 and Forecast 2025 to 2035, By Country
    • Historical Market Size Value (USD Billion) & Volume (MT) Trend Analysis By Market Taxonomy, 2020 to 2024
    • Market Size Value (USD Billion) & Volume (MT) Forecast By Market Taxonomy, 2025 to 2035
      • By Country
        • China
        • Japan
        • South Korea
      • By Type
      • By Raw Material
      • By End-use Industry
    • Market Attractiveness Analysis
      • By Country
      • By Type
      • By Raw Material
      • By End-use Industry
    • Key Takeaways
  15. South Asia & Pacific Market Analysis 2020 to 2024 and Forecast 2025 to 2035, By Country
    • Historical Market Size Value (USD Billion) & Volume (MT) Trend Analysis By Market Taxonomy, 2020 to 2024
    • Market Size Value (USD Billion) & Volume (MT) Forecast By Market Taxonomy, 2025 to 2035
      • By Country
        • India
        • Australia & New Zealand
        • ASEAN
        • Rest of SAP
      • By Type
      • By Raw Material
      • By End-use Industry
    • Market Attractiveness Analysis
      • By Country
      • By Type
      • By Raw Material
      • By End-use Industry
    • Key Takeaways
  16. Middle East and Africa Market Analysis 2020 to 2024 and Forecast 2025 to 2035, By Country
    • Historical Market Size Value (USD Billion) & Volume (MT) Trend Analysis By Market Taxonomy, 2020 to 2024
    • Market Size Value (USD Billion) & Volume (MT) Forecast By Market Taxonomy, 2025 to 2035
      • By Country
        • GCC Countries
        • Northern Africa
        • South Africa
        • Turkiye
        • Rest of MEA
      • By Type
      • By Raw Material
      • By End-use Industry
    • Market Attractiveness Analysis
      • By Country
      • By Type
      • By Raw Material
      • By End-use Industry
    • Key Takeaways
  17. Key Countries Market Analysis
    • USA
      • Pricing Analysis
      • Market Share Analysis, 2024
        • By Type
        • By Raw Material
        • By End-use Industry
    • Canada
      • Pricing Analysis
      • Market Share Analysis, 2024
        • By Type
        • By Raw Material
        • By End-use Industry
    • Brazil
      • Pricing Analysis
      • Market Share Analysis, 2024
        • By Type
        • By Raw Material
        • By End-use Industry
    • Mexico
      • Pricing Analysis
      • Market Share Analysis, 2024
        • By Type
        • By Raw Material
        • By End-use Industry
    • Argentina
      • Pricing Analysis
      • Market Share Analysis, 2024
        • By Type
        • By Raw Material
        • By End-use Industry
  18. Market Structure Analysis
    • Competition Dashboard
    • Competition Benchmarking
    • Market Share Analysis of Top Players
      • By Regional
      • By Type
      • By Raw Material
      • By End-use Industry
  19. Competition Analysis
    • Competition Deep Dive
      • Mondi Group
        • Overview
        • Product Portfolio
        • Profitability by Market Segments (Product/Age /Sales Channel/Region)
        • Sales Footprint
        • Strategy Overview
          • Marketing Strategy
          • Product Strategy
          • Channel Strategy
      • Canadian Kraft Paper (CKP)
        • Overview
        • Product Portfolio
        • Profitability by Market Segments (Product/Age /Sales Channel/Region)
        • Sales Footprint
        • Strategy Overview
          • Marketing Strategy
          • Product Strategy
          • Channel Strategy
      • WestRock
        • Overview
        • Product Portfolio
        • Profitability by Market Segments (Product/Age /Sales Channel/Region)
        • Sales Footprint
        • Strategy Overview
          • Marketing Strategy
          • Product Strategy
          • Channel Strategy
      • Stora Enso
        • Overview
        • Product Portfolio
        • Profitability by Market Segments (Product/Age /Sales Channel/Region)
        • Sales Footprint
        • Strategy Overview
          • Marketing Strategy
          • Product Strategy
          • Channel Strategy
      • Evergreen Packaging
        • Overview
        • Product Portfolio
        • Profitability by Market Segments (Product/Age /Sales Channel/Region)
        • Sales Footprint
        • Strategy Overview
          • Marketing Strategy
          • Product Strategy
          • Channel Strategy
      • Twin Rivers Paper Company
        • Overview
        • Product Portfolio
        • Profitability by Market Segments (Product/Age /Sales Channel/Region)
        • Sales Footprint
        • Strategy Overview
          • Marketing Strategy
          • Product Strategy
          • Channel Strategy
      • Gascogne Papier
        • Overview
        • Product Portfolio
        • Profitability by Market Segments (Product/Age /Sales Channel/Region)
        • Sales Footprint
        • Strategy Overview
          • Marketing Strategy
          • Product Strategy
          • Channel Strategy
      • Union Paper Corporation
        • Overview
        • Product Portfolio
        • Profitability by Market Segments (Product/Age /Sales Channel/Region)
        • Sales Footprint
        • Strategy Overview
          • Marketing Strategy
          • Product Strategy
          • Channel Strategy
      • Novolex
        • Overview
        • Product Portfolio
        • Profitability by Market Segments (Product/Age /Sales Channel/Region)
        • Sales Footprint
        • Strategy Overview
          • Marketing Strategy
          • Product Strategy
          • Channel Strategy
      • Segezha Group
        • Overview
        • Product Portfolio
        • Profitability by Market Segments (Product/Age /Sales Channel/Region)
        • Sales Footprint
        • Strategy Overview
          • Marketing Strategy
          • Product Strategy
          • Channel Strategy
      • Port Townsend Paper Corporation
        • Overview
        • Product Portfolio
        • Profitability by Market Segments (Product/Age /Sales Channel/Region)
        • Sales Footprint
        • Strategy Overview
          • Marketing Strategy
          • Product Strategy
          • Channel Strategy
      • PG Paper Company
        • Overview
        • Product Portfolio
        • Profitability by Market Segments (Product/Age /Sales Channel/Region)
        • Sales Footprint
        • Strategy Overview
          • Marketing Strategy
          • Product Strategy
          • Channel Strategy
      • Henan Hengda Paper Co., Ltd.
        • Overview
        • Product Portfolio
        • Profitability by Market Segments (Product/Age /Sales Channel/Region)
        • Sales Footprint
        • Strategy Overview
          • Marketing Strategy
          • Product Strategy
          • Channel Strategy
  20. Assumptions & Acronyms Used
  21. Research Methodology

List of Tables

  • Table 1: Global Market Value (USD Billion) Forecast by Region, 2020 to 2035
  • Table 2: Global Market Volume (MT) Forecast by Region, 2020 to 2035
  • Table 3: Global Market Value (USD Billion) Forecast by Type, 2020 to 2035
  • Table 4: Global Market Volume (MT) Forecast by Type, 2020 to 2035
  • Table 5: Global Market Value (USD Billion) Forecast by Raw Material, 2020 to 2035
  • Table 6: Global Market Volume (MT) Forecast by Raw Material, 2020 to 2035
  • Table 7: Global Market Value (USD Billion) Forecast by End-use Industry, 2020 to 2035
  • Table 8: Global Market Volume (MT) Forecast by End-use Industry, 2020 to 2035
  • Table 9: North America Market Value (USD Billion) Forecast by Country, 2020 to 2035
  • Table 10: North America Market Volume (MT) Forecast by Country, 2020 to 2035
  • Table 11: North America Market Value (USD Billion) Forecast by Type, 2020 to 2035
  • Table 12: North America Market Volume (MT) Forecast by Type, 2020 to 2035
  • Table 13: North America Market Value (USD Billion) Forecast by Raw Material, 2020 to 2035
  • Table 14: North America Market Volume (MT) Forecast by Raw Material, 2020 to 2035
  • Table 15: North America Market Value (USD Billion) Forecast by End-use Industry, 2020 to 2035
  • Table 16: North America Market Volume (MT) Forecast by End-use Industry, 2020 to 2035
  • Table 17: Latin America Market Value (USD Billion) Forecast by Country, 2020 to 2035
  • Table 18: Latin America Market Volume (MT) Forecast by Country, 2020 to 2035
  • Table 19: Latin America Market Value (USD Billion) Forecast by Type, 2020 to 2035
  • Table 20: Latin America Market Volume (MT) Forecast by Type, 2020 to 2035
  • Table 21: Latin America Market Value (USD Billion) Forecast by Raw Material, 2020 to 2035
  • Table 22: Latin America Market Volume (MT) Forecast by Raw Material, 2020 to 2035
  • Table 23: Latin America Market Value (USD Billion) Forecast by End-use Industry, 2020 to 2035
  • Table 24: Latin America Market Volume (MT) Forecast by End-use Industry, 2020 to 2035
  • Table 25: Western Europe Market Value (USD Billion) Forecast by Country, 2020 to 2035
  • Table 26: Western Europe Market Volume (MT) Forecast by Country, 2020 to 2035
  • Table 27: Western Europe Market Value (USD Billion) Forecast by Type, 2020 to 2035
  • Table 28: Western Europe Market Volume (MT) Forecast by Type, 2020 to 2035
  • Table 29: Western Europe Market Value (USD Billion) Forecast by Raw Material, 2020 to 2035
  • Table 30: Western Europe Market Volume (MT) Forecast by Raw Material, 2020 to 2035
  • Table 31: Western Europe Market Value (USD Billion) Forecast by End-use Industry, 2020 to 2035
  • Table 32: Western Europe Market Volume (MT) Forecast by End-use Industry, 2020 to 2035
  • Table 33: Eastern Europe Market Value (USD Billion) Forecast by Country, 2020 to 2035
  • Table 34: Eastern Europe Market Volume (MT) Forecast by Country, 2020 to 2035
  • Table 35: Eastern Europe Market Value (USD Billion) Forecast by Type, 2020 to 2035
  • Table 36: Eastern Europe Market Volume (MT) Forecast by Type, 2020 to 2035
  • Table 37: Eastern Europe Market Value (USD Billion) Forecast by Raw Material, 2020 to 2035
  • Table 38: Eastern Europe Market Volume (MT) Forecast by Raw Material, 2020 to 2035
  • Table 39: Eastern Europe Market Value (USD Billion) Forecast by End-use Industry, 2020 to 2035
  • Table 40: Eastern Europe Market Volume (MT) Forecast by End-use Industry, 2020 to 2035
  • Table 41: East Asia Market Value (USD Billion) Forecast by Country, 2020 to 2035
  • Table 42: East Asia Market Volume (MT) Forecast by Country, 2020 to 2035
  • Table 43: East Asia Market Value (USD Billion) Forecast by Type, 2020 to 2035
  • Table 44: East Asia Market Volume (MT) Forecast by Type, 2020 to 2035
  • Table 45: East Asia Market Value (USD Billion) Forecast by Raw Material, 2020 to 2035
  • Table 46: East Asia Market Volume (MT) Forecast by Raw Material, 2020 to 2035
  • Table 47: East Asia Market Value (USD Billion) Forecast by End-use Industry, 2020 to 2035
  • Table 48: East Asia Market Volume (MT) Forecast by End-use Industry, 2020 to 2035
  • Table 49: South Asia & Pacific Market Value (USD Billion) Forecast by Country, 2020 to 2035
  • Table 50: South Asia & Pacific Market Volume (MT) Forecast by Country, 2020 to 2035
  • Table 51: South Asia & Pacific Market Value (USD Billion) Forecast by Type, 2020 to 2035
  • Table 52: South Asia & Pacific Market Volume (MT) Forecast by Type, 2020 to 2035
  • Table 53: South Asia & Pacific Market Value (USD Billion) Forecast by Raw Material, 2020 to 2035
  • Table 54: South Asia & Pacific Market Volume (MT) Forecast by Raw Material, 2020 to 2035
  • Table 55: South Asia & Pacific Market Value (USD Billion) Forecast by End-use Industry, 2020 to 2035
  • Table 56: South Asia & Pacific Market Volume (MT) Forecast by End-use Industry, 2020 to 2035
  • Table 57: Middle East and Africa Market Value (USD Billion) Forecast by Country, 2020 to 2035
  • Table 58: Middle East and Africa Market Volume (MT) Forecast by Country, 2020 to 2035
  • Table 59: Middle East and Africa Market Value (USD Billion) Forecast by Type, 2020 to 2035
  • Table 60: Middle East and Africa Market Volume (MT) Forecast by Type, 2020 to 2035
  • Table 61: Middle East and Africa Market Value (USD Billion) Forecast by Raw Material, 2020 to 2035
  • Table 62: Middle East and Africa Market Volume (MT) Forecast by Raw Material, 2020 to 2035
  • Table 63: Middle East and Africa Market Value (USD Billion) Forecast by End-use Industry, 2020 to 2035
  • Table 64: Middle East and Africa Market Volume (MT) Forecast by End-use Industry, 2020 to 2035

List of Figures

  • Figure 1: Global Market Volume (MT) Forecast 2020 to 2035
  • Figure 2: Global Market Pricing Analysis
  • Figure 3: Global Market Value (USD Billion) Forecast 2020 to 2035
  • Figure 4: Global Market Value Share and BPS Analysis by Type, 2025 and 2035
  • Figure 5: Global Market Y-o-Y Growth Comparison by Type, 2025 to 2035
  • Figure 6: Global Market Attractiveness Analysis by Type
  • Figure 7: Global Market Value Share and BPS Analysis by Raw Material, 2025 and 2035
  • Figure 8: Global Market Y-o-Y Growth Comparison by Raw Material, 2025 to 2035
  • Figure 9: Global Market Attractiveness Analysis by Raw Material
  • Figure 10: Global Market Value Share and BPS Analysis by End-use Industry, 2025 and 2035
  • Figure 11: Global Market Y-o-Y Growth Comparison by End-use Industry, 2025 to 2035
  • Figure 12: Global Market Attractiveness Analysis by End-use Industry
  • Figure 13: Global Market Value (USD Billion) Share and BPS Analysis by Region, 2025 and 2035
  • Figure 14: Global Market Y-o-Y Growth Comparison by Region, 2025 to 2035
  • Figure 15: Global Market Attractiveness Analysis by Region
  • Figure 16: North America Market Incremental $ Opportunity, 2025 to 2035
  • Figure 17: Latin America Market Incremental $ Opportunity, 2025 to 2035
  • Figure 18: Western Europe Market Incremental $ Opportunity, 2025 to 2035
  • Figure 19: Eastern Europe Market Incremental $ Opportunity, 2025 to 2035
  • Figure 20: East Asia Market Incremental $ Opportunity, 2025 to 2035
  • Figure 21: South Asia & Pacific Market Incremental $ Opportunity, 2025 to 2035
  • Figure 22: Middle East and Africa Market Incremental $ Opportunity, 2025 to 2035
  • Figure 23: North America Market Value Share and BPS Analysis by Country, 2025 and 2035
  • Figure 24: North America Market Value Share and BPS Analysis by Type, 2025 and 2035
  • Figure 25: North America Market Y-o-Y Growth Comparison by Type, 2025 to 2035
  • Figure 26: North America Market Attractiveness Analysis by Type
  • Figure 27: North America Market Value Share and BPS Analysis by Raw Material, 2025 and 2035
  • Figure 28: North America Market Y-o-Y Growth Comparison by Raw Material, 2025 to 2035
  • Figure 29: North America Market Attractiveness Analysis by Raw Material
  • Figure 30: North America Market Value Share and BPS Analysis by End-use Industry, 2025 and 2035
  • Figure 31: North America Market Y-o-Y Growth Comparison by End-use Industry, 2025 to 2035
  • Figure 32: North America Market Attractiveness Analysis by End-use Industry
  • Figure 33: Latin America Market Value Share and BPS Analysis by Country, 2025 and 2035
  • Figure 34: Latin America Market Value Share and BPS Analysis by Type, 2025 and 2035
  • Figure 35: Latin America Market Y-o-Y Growth Comparison by Type, 2025 to 2035
  • Figure 36: Latin America Market Attractiveness Analysis by Type
  • Figure 37: Latin America Market Value Share and BPS Analysis by Raw Material, 2025 and 2035
  • Figure 38: Latin America Market Y-o-Y Growth Comparison by Raw Material, 2025 to 2035
  • Figure 39: Latin America Market Attractiveness Analysis by Raw Material
  • Figure 40: Latin America Market Value Share and BPS Analysis by End-use Industry, 2025 and 2035
  • Figure 41: Latin America Market Y-o-Y Growth Comparison by End-use Industry, 2025 to 2035
  • Figure 42: Latin America Market Attractiveness Analysis by End-use Industry
  • Figure 43: Western Europe Market Value Share and BPS Analysis by Country, 2025 and 2035
  • Figure 44: Western Europe Market Value Share and BPS Analysis by Type, 2025 and 2035
  • Figure 45: Western Europe Market Y-o-Y Growth Comparison by Type, 2025 to 2035
  • Figure 46: Western Europe Market Attractiveness Analysis by Type
  • Figure 47: Western Europe Market Value Share and BPS Analysis by Raw Material, 2025 and 2035
  • Figure 48: Western Europe Market Y-o-Y Growth Comparison by Raw Material, 2025 to 2035
  • Figure 49: Western Europe Market Attractiveness Analysis by Raw Material
  • Figure 50: Western Europe Market Value Share and BPS Analysis by End-use Industry, 2025 and 2035
  • Figure 51: Western Europe Market Y-o-Y Growth Comparison by End-use Industry, 2025 to 2035
  • Figure 52: Western Europe Market Attractiveness Analysis by End-use Industry
  • Figure 53: Eastern Europe Market Value Share and BPS Analysis by Country, 2025 and 2035
  • Figure 54: Eastern Europe Market Value Share and BPS Analysis by Type, 2025 and 2035
  • Figure 55: Eastern Europe Market Y-o-Y Growth Comparison by Type, 2025 to 2035
  • Figure 56: Eastern Europe Market Attractiveness Analysis by Type
  • Figure 57: Eastern Europe Market Value Share and BPS Analysis by Raw Material, 2025 and 2035
  • Figure 58: Eastern Europe Market Y-o-Y Growth Comparison by Raw Material, 2025 to 2035
  • Figure 59: Eastern Europe Market Attractiveness Analysis by Raw Material
  • Figure 60: Eastern Europe Market Value Share and BPS Analysis by End-use Industry, 2025 and 2035
  • Figure 61: Eastern Europe Market Y-o-Y Growth Comparison by End-use Industry, 2025 to 2035
  • Figure 62: Eastern Europe Market Attractiveness Analysis by End-use Industry
  • Figure 63: East Asia Market Value Share and BPS Analysis by Country, 2025 and 2035
  • Figure 64: East Asia Market Value Share and BPS Analysis by Type, 2025 and 2035
  • Figure 65: East Asia Market Y-o-Y Growth Comparison by Type, 2025 to 2035
  • Figure 66: East Asia Market Attractiveness Analysis by Type
  • Figure 67: East Asia Market Value Share and BPS Analysis by Raw Material, 2025 and 2035
  • Figure 68: East Asia Market Y-o-Y Growth Comparison by Raw Material, 2025 to 2035
  • Figure 69: East Asia Market Attractiveness Analysis by Raw Material
  • Figure 70: East Asia Market Value Share and BPS Analysis by End-use Industry, 2025 and 2035
  • Figure 71: East Asia Market Y-o-Y Growth Comparison by End-use Industry, 2025 to 2035
  • Figure 72: East Asia Market Attractiveness Analysis by End-use Industry
  • Figure 73: South Asia & Pacific Market Value Share and BPS Analysis by Country, 2025 and 2035
  • Figure 74: South Asia & Pacific Market Value Share and BPS Analysis by Type, 2025 and 2035
  • Figure 75: South Asia & Pacific Market Y-o-Y Growth Comparison by Type, 2025 to 2035
  • Figure 76: South Asia & Pacific Market Attractiveness Analysis by Type
  • Figure 77: South Asia & Pacific Market Value Share and BPS Analysis by Raw Material, 2025 and 2035
  • Figure 78: South Asia & Pacific Market Y-o-Y Growth Comparison by Raw Material, 2025 to 2035
  • Figure 79: South Asia & Pacific Market Attractiveness Analysis by Raw Material
  • Figure 80: South Asia & Pacific Market Value Share and BPS Analysis by End-use Industry, 2025 and 2035
  • Figure 81: South Asia & Pacific Market Y-o-Y Growth Comparison by End-use Industry, 2025 to 2035
  • Figure 82: South Asia & Pacific Market Attractiveness Analysis by End-use Industry
  • Figure 83: Middle East and Africa Market Value Share and BPS Analysis by Country, 2025 and 2035
  • Figure 84: Middle East and Africa Market Value Share and BPS Analysis by Type, 2025 and 2035
  • Figure 85: Middle East and Africa Market Y-o-Y Growth Comparison by Type, 2025 to 2035
  • Figure 86: Middle East and Africa Market Attractiveness Analysis by Type
  • Figure 87: Middle East and Africa Market Value Share and BPS Analysis by Raw Material, 2025 and 2035
  • Figure 88: Middle East and Africa Market Y-o-Y Growth Comparison by Raw Material, 2025 to 2035
  • Figure 89: Middle East and Africa Market Attractiveness Analysis by Raw Material
  • Figure 90: Middle East and Africa Market Value Share and BPS Analysis by End-use Industry, 2025 and 2035
  • Figure 91: Middle East and Africa Market Y-o-Y Growth Comparison by End-use Industry, 2025 to 2035
  • Figure 92: Middle East and Africa Market Attractiveness Analysis by End-use Industry
  • Figure 93: Global Market - Tier Structure Analysis
  • Figure 94: Global Market - Company Share Analysis
Dashboard
Dashboard
Dashboard
Dashboard
Dashboard
Dashboard

Our Research Products

Full Research Suite

The "Full Research Suite" delivers actionable market intel, deep dives on markets or technologies, so clients act faster, cut risk, and unlock growth.

Competitor Leaderboard Report

The Leaderboard benchmarks and ranks top vendors, classifying them as Established Leaders, Leading Challengers, or Disruptors & Challengers.

Future Leaders Index

Locates where complements amplify value and substitutes erode it, forecasting net impact by horizon

Market Data & Forecasts

We deliver granular, decision-grade intel: market sizing, 5-year forecasts, pricing, adoption, usage, revenue, and operational KPIs—plus competitor tracking, regulation, and value chains—across 60 countries broadly.

Market Focus Report

Spot the shifts before they hit your P&L. We track inflection points, adoption curves, pricing moves, and ecosystem plays to show where demand is heading, why it is changing, and what to do next across high-growth markets and disruptive tech

Survey Report

Real-time reads of user behavior. We track shifting priorities, perceptions of today’s and next-gen services, and provider experience, then pace how fast tech moves from trial to adoption, blending buyer, consumer, and channel inputs with social signals (#WhySwitch, #UX).

Bespoke Reports

Partner with our analyst team to build a custom report designed around your business priorities. From analysing market trends to assessing competitors or crafting bespoke datasets, we tailor insights to your needs.

Supplier Intelligence

Discovery & Profiling

Capacity & Footprint

Performance & Risk

Compliance & Governance

Commercial Readiness

Who Supplies Whom

Scorecards & Shortlists

Playbooks & Docs

Category Intelligence

Definition & Scope

Demand & Use Cases

Cost Drivers

Market Structure

Supply Chain Map

Trade & Policy

Operating Norms

Deliverables

Buyer Intelligence

Account Basics

Spend & Scope

Procurement Model

Vendor Requirements

Terms & Policies

Entry Strategy

Pain Points & Triggers

Outputs

Pricing Analysis

Benchmarks

Trends

Should-Cost

Indexation

Landed Cost

Commercial Terms

Deliverables

Brand Analysis

Positioning & Value Prop

Share & Presence

Customer Evidence

Go-to-Market

Digital & Reputation

Compliance & Trust

KPIs & Gaps

Outputs

Full Research Suite comprises of:

Market outlook & trends analysis

Market outlook & trends analysis

Interviews & case studies

Interviews & case studies

Strategic recommendations

Strategic recommendations

Vendor profiles & capabilities analysis

Vendor profiles & capabilities analysis

5-year forecasts

5-year forecasts

8 regions and 60+ country-level data splits

8 regions and 60+ country-level data splits

Market segment data splits

Market segment data splits

12 months of continuous data updates

12 months of continuous data updates

DELIVERED AS:

PDF EXCEL ONLINE

Full Research Suite


$5000

$7500

$10000

Buy Report Now
Similar Industry Reports

Similar Industry Reports

Wet Cleaning Ozone Water System Market

Wet Cleaning Ozone Water System Market Size and Share Forecast Outlook 2025 to 2035

Paperboard Partition Market

Paperboard Partition Market Size and Share Forecast Outlook 2025 to 2035

Paper Box Market
Paper Box Market

Paper Box Market Size and Share Forecast Outlook 2025 to 2035

Paper Edge Protector Market

Paper Edge Protector Market Size and Share Forecast Outlook 2025 to 2035

Paper Cup Lids Market

Paper Cup Lids Market Size and Share Forecast Outlook 2025 to 2035

Paper Pallet Market
Paper Pallet Market

Paper Pallet Market Size and Share Forecast Outlook 2025 to 2035

Paper and Paperboard Packaging Market

Paper and Paperboard Packaging Market Forecast and Outlook 2025 to 2035

Wet Food for Cat Market

Wet Food for Cat Market Size and Share Forecast Outlook 2025 to 2035

Paper Wrap Market
Paper Wrap Market

Paper Wrap Market Size and Share Forecast Outlook 2025 to 2035

Paper Cups Market
Paper Cups Market

Paper Cups Market Size and Share Forecast Outlook 2025 to 2035

Paper Core Market
Paper Core Market

Paper Core Market Size and Share Forecast Outlook 2025 to 2035

Paper Bags Market
Paper Bags Market

Paper Bags Market Size and Share Forecast Outlook 2025 to 2035

Paper Processing Resins Market

Paper Processing Resins Market Size and Share Forecast Outlook 2025 to 2035

Paper Tester Market
Paper Tester Market

Paper Tester Market Size and Share Forecast Outlook 2025 to 2035

Paper Napkin Converting Lines Market

Paper Napkin Converting Lines Market Size and Share Forecast Outlook 2025 to 2035

Wet Food Pouch Market

Wet Food Pouch Market Size and Share Forecast Outlook 2025 to 2035

Paper Packaging Tapes Market

Paper Packaging Tapes Market Size and Share Forecast Outlook 2025 to 2035

Paper Napkins Converting Machines Market

Paper Napkins Converting Machines Market Size and Share Forecast Outlook 2025 to 2035

Paper Coating Binders Market

Paper Coating Binders Market Size and Share Forecast Outlook 2025 to 2035

Wetting Agent Market

Wetting Agent Market Size and Share Forecast Outlook 2025 to 2035

Future Market Insights

Wet Strength Paper Market

Chat With MaRIA

Chat With

MaRIA

Hi There, I am MaRIA, Your Market Research Intelligence Assistant. How may I help you?