Wet Cleaning Ozone Water System Market Forecast and Outlook 2025 to 2035

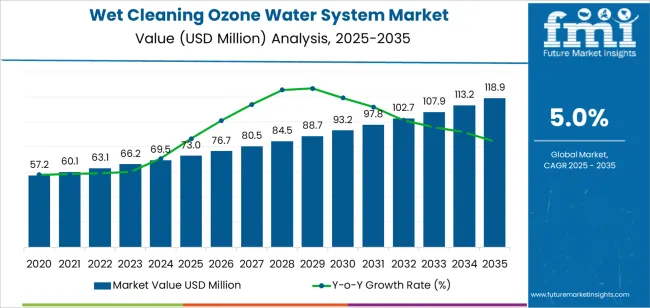
The global wet cleaning ozone water system market is projected to reach USD 118.9 million by 2035, recording an absolute increase of USD 45.9 million over the forecast period. The market is valued at USD 73 million in 2025 and is set to rise at a CAGR of 5% during the assessment period. The overall market size is expected to grow by nearly 1.6 times during the same period, supported by increasing demand for advanced semiconductor manufacturing processes worldwide, driving demand for efficient precision cleaning solutions and increasing investments in photovoltaic production capacity expansion and semiconductor fabrication facility construction projects globally. However, high equipment costs and technical complexity in system integration may pose challenges to market expansion.

The market expansion reflects fundamental shifts in semiconductor and photovoltaic manufacturing, where wet cleaning ozone water systems enable fabrication facilities to achieve superior contamination removal and surface preparation while reducing chemical consumption. Manufacturing operations across advanced technology nodes face mounting pressure to improve particle removal efficiency and minimize environmental impact, with ozone water cleaning solutions typically providing 30-45% reduction in chemical usage over conventional wet cleaning systems, making these technologies essential for next-generation chip production and solar cell manufacturing. The transition toward smaller feature sizes and higher device performance creates demand for ultra-clean surface preparation methods that can deliver sub-nanometer particle removal without damaging delicate structures.
Quick Stats for Wet Cleaning Ozone Water System Market

  • Wet Cleaning Ozone Water System Market Value (2025): USD 73 million
  • Wet Cleaning Ozone Water System Market Forecast Value (2035): USD 118.9 million
  • Wet Cleaning Ozone Water System Market Forecast CAGR: 5%
  • Leading Flow Rate Type in Wet Cleaning Ozone Water System Market: High Flow Type
  • Key Growth Regions in Wet Cleaning Ozone Water System Market: Asia Pacific, Europe, and North America
  • Top Key Players in Wet Cleaning Ozone Water System Market: Suzhou Jingtuo Semiconductor Technology, Sumitomo Precision Products, Ebara, MKS Instruments, Meidensha Corporation, De Nora Permelec, HJS ENG, MTK, Anseros, Qingdao Guolin Semiconductor Technology
  • Wet Cleaning Ozone Water System Market Year-over-Year Forecast (2025-2035)

Wet Cleaning Ozone Water System Market Market Value Analysis

Technological advancements in ozone generation, flow control systems, and process monitoring are reshaping the wet cleaning ozone water system landscape. Modern systems incorporate real-time concentration monitoring that maintains precise ozone levels throughout cleaning cycles, enabling consistent process results. Integration with automated material handling systems and fab-wide process control platforms allows seamless coordination with other manufacturing steps. Advanced flow rate control technologies enable customized cleaning protocols for different wafer types and contamination levels, supporting flexible manufacturing operations that process diverse product mixes within single fabrication facilities.

Government semiconductor industry development initiatives and renewable energy manufacturing incentives accelerate market growth. Major semiconductor-producing nations invest billions in domestic chip manufacturing capacity to address supply chain vulnerabilities and technological leadership concerns. Solar panel production expansion in Asia-Pacific and European markets drives demand for efficient photovoltaic manufacturing equipment that reduces operating costs while meeting environmental compliance standards. Industry adoption of green manufacturing principles creates sustained investment in ozone-based cleaning technologies that eliminate hazardous chemical waste streams, reduce water consumption, and lower carbon footprint compared to traditional wet cleaning methods, enabling sustainable semiconductor and photovoltaic production operations.

Between 2025 and 2030, the wet cleaning ozone water system market is projected to expand from USD 73 million to USD 93.2 million, resulting in a value increase of USD 20.2 million, which represents 44.0% of the total forecast growth for the decade. This phase of development will be shaped by rising demand for advanced semiconductor manufacturing and photovoltaic production solutions, product innovation in high-concentration ozone generation and precision flow control systems, as well as expanding integration with automated fab management and real-time process monitoring platforms. Companies are establishing competitive positions through investment in advanced ozone dissolution technologies, compact system designs, and strategic market expansion across semiconductor fabrication facilities, photovoltaic manufacturing plants, and precision cleaning applications.

From 2030 to 2035, the market is forecast to grow from USD 93.2 million to USD 118.9 million, adding another USD 25.7 million, which constitutes 56.0% of the overall ten-year expansion. This period is expected to be characterized by the expansion of specialized cleaning systems, including ultra-high purity ozone water generators and integrated process control modules tailored for specific manufacturing requirements, strategic collaborations between equipment manufacturers and semiconductor fabs, and an enhanced focus on sustainability metrics and chemical reduction targets. The growing emphasis on advanced node manufacturing and environmental stewardship will drive demand for advanced, high-performance wet cleaning ozone water systems across diverse semiconductor and photovoltaic manufacturing applications.

Wet Cleaning Ozone Water System Market Key Takeaways

Metric Value
Market Value (2025) USD 73 million
Market Forecast Value (2035) USD 118.9 million
Forecast CAGR (2025-2035) 5%

Why Is the Weld Angle Brackets Market Expanding Across Global Construction Applications?

The wet cleaning ozone water system market grows by enabling semiconductor and photovoltaic manufacturers to achieve superior cleaning performance and environmental sustainability while reducing chemical consumption. Fabrication facility operators face mounting pressure to improve process cleanliness and minimize hazardous waste generation, with ozone water cleaning solutions typically providing 25-40% improvement in particle removal efficiency over conventional chemical-based systems, making these technologies essential for advanced manufacturing operations. The industry transition toward smaller semiconductor nodes and higher photovoltaic cell efficiency creates demand for precision cleaning methods that can remove organic and inorganic contaminants without surface damage or residue formation.

Government initiatives promoting semiconductor manufacturing localization and renewable energy production capacity drive adoption in fabrication facilities, solar panel manufacturing plants, and precision component cleaning applications, where ultra-clean surfaces have a direct impact on device performance and manufacturing yield. The global shift toward sustainable manufacturing practices and chemical reduction targets accelerates ozone water system demand as facilities seek alternatives to hazardous cleaning chemicals that generate environmental liability. However, high capital investment requirements and technical expertise needed for system operation may limit adoption rates among smaller manufacturing operations and regions with limited process engineering capabilities.

How Is the Weld Angle Brackets Market Segmented by Material Type, Application, and Region?

The market is segmented by flow rate type, application, and region. By flow rate type, the market is divided into high flow type, low flow type, and others. Based on application, the market is categorized into semiconductor and photovoltaic. Regionally, the market is divided into Asia Pacific, Europe, North America, Latin America, and Middle East & Africa.
By Flow Rate Type, the High Flow Type Segment Accounts for a Dominant Market Share

Wet Cleaning Ozone Water System Market Analysis By Flow Rate Type

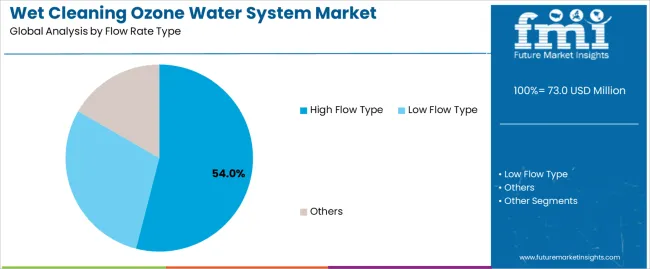
The high flow type segment represents the dominant force in the wet cleaning ozone water system market, capturing approximately 54.0% of total market share in 2025. This advanced category encompasses systems delivering ozone water flow rates exceeding 20 liters per minute, large-capacity dissolution chambers, high-throughput cleaning modules, and multi-wafer batch processing equipment, delivering comprehensive cleaning capabilities with rapid cycle time performance. The high flow type segment's market leadership stems from its essential role in volume manufacturing environments, enabling efficient wafer processing in semiconductor fabs operating 300mm production lines and photovoltaic facilities processing multiple substrates simultaneously through automated cleaning stations.

The low flow type segment maintains a substantial 38.0% market share, serving specialized applications that require precise ozone concentration control through compact ozone generators, single-wafer processing systems, and laboratory-scale cleaning equipment. The others segment accounts for 8.0% market share, featuring customized flow configurations, pilot production systems, and application-specific cleaning modules.

Key advantages driving the high flow type segment include:
  • High-volume manufacturing capability enabling processing of 50-100 wafers per hour in automated production lines
  • Cost efficiency advantages providing 20-30% lower per-wafer cleaning costs compared to low flow alternatives in volume operations
  • Integration compatibility supporting connection with existing fab automation and material handling infrastructure across major fabs
  • Scalability features allowing capacity expansion through parallel system installation without major facility modifications required

By Application, the Semiconductor Segment Accounts for the Largest Market Share

Wet Cleaning Ozone Water System Market Analysis By Application

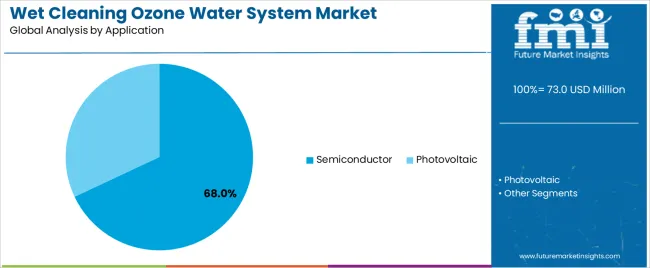
Semiconductor applications dominate the wet cleaning ozone water system market with approximately 68.0% market share in 2025, reflecting the critical importance of ultra-clean wafer surfaces in chip manufacturing processes. The semiconductor segment's market leadership is reinforced by widespread adoption in logic chip fabrication, memory device production, compound semiconductor manufacturing, and advanced packaging facilities, which require multiple cleaning steps throughout production sequences to remove photoresist residues, organic contaminants, and particulate matter that compromise device performance.

The photovoltaic segment represents 32.0% market share through specialized applications including silicon wafer texturing, post-diffusion cleaning, transparent conductive oxide surface preparation, and module component cleaning operations. This segment benefits from solar industry expansion and efficiency improvement initiatives driving adoption of advanced cleaning technologies.

Key market dynamics supporting application preferences include:

  • Semiconductor manufacturing requiring 15-25 cleaning steps per wafer with stringent contamination control specifications below 10 particles per square centimeter
  • Photovoltaic applications enabling 2-5% efficiency improvement through optimized surface preparation and contamination removal protocols
  • Technology node advancement in semiconductor sector creating increasing cleaning challenges as feature sizes shrink below 5 nanometer dimensions
  • Environmental regulations in both industries favoring chemical-free cleaning methods that eliminate hazardous waste disposal requirements and regulatory compliance costs

What Are the Primary Drivers, Restraints, and Emerging Trends Shaping the Weld Angle Brackets Market?

The market is driven by three concrete demand factors tied to manufacturing performance and sustainability objectives. First, semiconductor industry growth creates increasing requirements for advanced cleaning equipment, with global chip manufacturing capacity expanding by 15-20% annually in strategic markets, requiring proven cleaning technologies that support yield improvement in sub-7nm production nodes. Second, environmental compliance pressures drive manufacturers toward chemical reduction solutions, with ozone water systems eliminating hazardous sulfuric acid, hydrogen peroxide, and ammonium hydroxide consumption while achieving equivalent or superior cleaning results in most applications. Third, photovoltaic manufacturing expansion and solar cell efficiency improvement programs accelerate adoption across China, Southeast Asia, and European markets where production capacity investments exceed USD 50 billion through 2030.

Market restraints include equipment costs ranging from USD 300,000 to USD 2,000,000 per system depending on capacity and specifications, representing significant capital investments that require detailed return-on-investment justification compared to established chemical cleaning infrastructure already amortized in existing fabrication facilities. Process integration complexity poses technical challenges, as ozone water cleaning requires precise parameter control including ozone concentration, water temperature, flow rate, and exposure time that demand specialized process engineering expertise and ongoing optimization to achieve target cleaning performance. Material compatibility limitations create adoption barriers for certain applications, as high ozone concentrations can damage sensitive materials including some low-k dielectrics and metal films that require alternative cleaning approaches.

Key trends indicate accelerated adoption in China's semiconductor manufacturing sector, where government programs supporting domestic chip production capacity provide equipment subsidies and technology development funding that incentivize advanced manufacturing equipment deployment. Technology advancement trends toward ultra-high concentration ozone generation systems exceeding 50 parts per million, real-time process monitoring with advanced sensors and feedback control, and hybrid cleaning approaches combining ozone water with other sustainable chemistries are driving next-generation product development. However, the market thesis could face disruption if alternative cleaning technologies including supercritical carbon dioxide systems or cryogenic aerosol cleaning methods demonstrate superior performance or cost advantages that shift industry preferences away from ozone-based solutions.
How Are Leading Countries Driving Growth in the Weld Angle Brackets Market?

Wet Cleaning Ozone Water System Market Cagr Analysis By Country

Country CAGR (2025-2035)
China 6.7%
India 6.2%
Germany 5.7%
Brazil 5.2%
U.S. 4.7%
U.K. 4.2%
Japan 3.7%

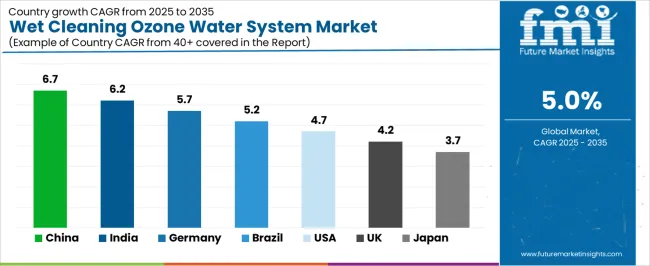
The wet cleaning ozone water system market is gaining momentum worldwide, with China taking the lead thanks to aggressive semiconductor manufacturing expansion and photovoltaic production capacity investments. Close behind, India benefits from electronics manufacturing incentives and renewable energy production targets, positioning itself as a strategic growth hub in the Asia-Pacific region. Germany shows strong advancement, where precision engineering capabilities and semiconductor equipment expertise strengthen its role in European manufacturing technology supply chains. Brazil demonstrates robust growth through renewable energy expansion and regional electronics manufacturing development, signaling continued investment in advanced production infrastructure. Meanwhile, the U.S. stands out for its leading-edge semiconductor fabrication facilities and innovation in cleaning technology development, while the U.K. and Japan continue to record consistent progress driven by specialized semiconductor manufacturing and equipment supplier presence. Together, China and India anchor the global expansion story, while established markets build stability and technological leadership into the market's growth path.

The report covers an in-depth analysis of 40+ countries top-performing countries are highlighted below.
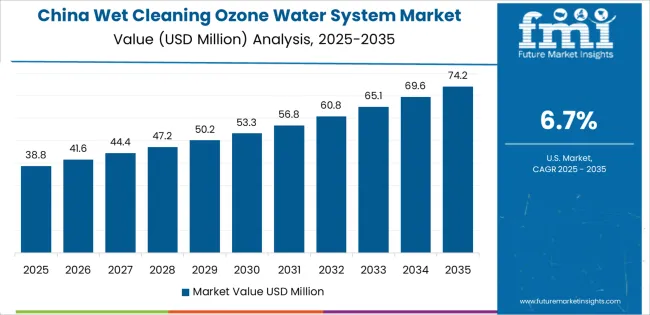
How Is Construction Infrastructure Expansion Accelerating Market Growth in China?

Wet Cleaning Ozone Water System Market Country Value Analysis

China demonstrates the strongest growth potential in the Wet Cleaning Ozone Water System Market with a CAGR of 6.7% through 2035. The country's leadership position stems from comprehensive semiconductor industry development initiatives, massive photovoltaic manufacturing capacity representing over 80% of global solar panel production, and government funding programs driving adoption of advanced manufacturing equipment. Growth is concentrated in major semiconductor clusters, including Shanghai, Beijing, Shenzhen, and Wuxi regions, where leading foundries and integrated device manufacturers are implementing ozone water cleaning systems for 28nm and below production nodes. Distribution channels through domestic equipment manufacturers, international technology suppliers, and fab equipment procurement departments expand deployment across memory fabs, logic production facilities, and compound semiconductor manufacturing operations. The country's Made in China 2025 strategy provides policy support for semiconductor equipment localization, including subsidies for domestic manufacturing equipment adoption and technology transfer partnerships.

Key market factors:

  • Semiconductor capacity expansion in eastern provinces with comprehensive fab construction programs adding 50+ new production lines during the forecast period
  • Government support through National Integrated Circuit Industry Investment Fund and provincial equipment purchase subsidies providing 30-50% capital cost offsets
  • Comprehensive manufacturing ecosystem including established ozone generation equipment suppliers and process engineering service providers with proven capabilities
  • Technology integration featuring advanced process control systems, real-time contamination monitoring, and fab-wide automation platforms supporting Industry 4.0 initiatives

Why Is Structural Modernization Supporting Market Expansion in India?

In technology corridors, semiconductor development zones, and renewable energy manufacturing clusters, the adoption of wet cleaning ozone water systems is accelerating across new semiconductor fabrication projects, photovoltaic manufacturing facilities, and electronics component production operations, driven by Production Linked Incentive schemes and National Solar Mission expansion programs. The market demonstrates strong growth momentum with a CAGR of 6.2% through 2035, linked to comprehensive electronics manufacturing promotion and increasing focus on sustainable production technology deployment. Indian manufacturers are implementing ozone water cleaning platforms and advanced contamination control systems to meet international quality standards while addressing environmental compliance requirements mandated by pollution control authorities. The country's Semicon India Programme creates sustained demand for advanced manufacturing equipment, while increasing emphasis on atmanirbhar (self-reliance) initiatives drives domestic capability development in semiconductor equipment and photovoltaic production technologies.

  • Leading industrial clusters, including Bangalore, Hyderabad, Gujarat, and Tamil Nadu, driving wet cleaning system adoption across semiconductor and solar manufacturing facilities
  • Government incentive programs enabling equipment financing support and capital expenditure subsidies through state industrial development corporations and national schemes
  • Technology collaboration agreements accelerating deployment with international equipment suppliers establishing local assembly operations and technical support centers
  • Policy support through Electronics Manufacturing Clusters and Solar Park development programs providing infrastructure and equipment acquisition assistance

How Does Engineering Excellence Sustain Market Leadership in Germany?

Germany's precision engineering sector demonstrates sophisticated implementation of wet cleaning ozone water systems, with documented case studies showing 30-50% reduction in chemical consumption through ozone water technology adoption across semiconductor equipment manufacturing and photovoltaic production operations. The country's advanced manufacturing infrastructure in major technology centers, including Dresden, Munich, Regensburg, and Frankfurt regions, showcases integration of ozone cleaning technologies with existing production systems, leveraging expertise in process equipment design and environmental engineering standards. German manufacturers emphasize process validation and quality certification, creating demand for fully documented cleaning systems that support ISO standards compliance and meet stringent environmental regulations under German federal and EU directives. The market maintains strong growth through focus on sustainable manufacturing and technology leadership, with a CAGR of 5.7% through 2035.

Key development areas:

  • Semiconductor equipment manufacturers establishing ozone water cleaning as standard process option with comprehensive technical documentation and validation protocols
  • Technical standards development providing market leadership through participation in SEMI standards committees and European equipment certification programs
  • Strategic partnerships between ozone generation specialists and semiconductor equipment integrators expanding turnkey cleaning system offerings
  • Integration of cleaning systems with environmental monitoring and waste reduction programs supporting corporate sustainability reporting requirements

Why Is Building Development Driving Market Opportunities in Brazil?

The Brazilian market leads Latin American adoption based on integration with renewable energy manufacturing expansion and regional electronics assembly operations supporting domestic production capacity development. The country shows solid potential with a CAGR of 5.2% through 2035, driven by photovoltaic manufacturing investments and increasing electronics industry sophistication across São Paulo, Rio de Janeiro, Minas Gerais, and southern regional industrial clusters. Brazilian manufacturers are adopting ozone water cleaning systems for compliance with environmental regulations, particularly in operations requiring hazardous chemical elimination and in facilities seeking international quality certification for export market access. Technology deployment channels through equipment distributors, engineering contractors, and direct manufacturer relationships expand coverage across photovoltaic production lines and electronics manufacturing operations.

Leading market segments:

  • Photovoltaic manufacturing facilities implementing comprehensive ozone water cleaning for silicon wafer processing and module component preparation applications
  • Technology partnerships with international suppliers achieving local content compliance through equipment assembly and service provider development programs
  • Strategic collaborations between industry associations and technology vendors enabling workforce training and process optimization technical assistance
  • Focus on environmental compliance and chemical reduction initiatives driving investment in alternative cleaning technology deployment programs

How Are Construction Innovation Programs Enhancing Market Growth in United States?

The U.S. wet cleaning ozone water system market demonstrates mature implementation focused on leading-edge semiconductor fabrication facilities and advanced technology node development programs, with documented integration across major foundries operating 5nm and 3nm production technologies in Arizona, Texas, Oregon, and New York fabrication facilities. The country maintains steady growth momentum with a CAGR of 4.7% through 2035, driven by CHIPS Act funding supporting domestic semiconductor manufacturing capacity expansion and continued technology leadership in logic chip production. Major semiconductor companies including Intel, Texas Instruments, and GlobalFoundries showcase advanced deployment of ozone water cleaning systems integrated with comprehensive contamination control programs and real-time process monitoring infrastructure.

Key market characteristics:

  • Advanced technology node production requiring ultra-clean wafer surfaces with contamination specifications below 5 particles per square centimeter driving ozone water adoption
  • Equipment supplier concentration with established partnerships between semiconductor fabs and proven cleaning system manufacturers ensuring long-term technology roadmap alignment
  • Collaboration between semiconductor research consortia and equipment vendors enabling next-generation cleaning technology development and validation programs
  • Emphasis on sustainability metrics and chemical reduction targets driving corporate environmental responsibility initiatives and green manufacturing technology investment

How Is Structural Integration Strengthening Market Position in United Kingdom?

In semiconductor equipment manufacturing clusters, compound semiconductor facilities, and photovoltaic research operations across England, Scotland, and Wales, specialized manufacturing operations are implementing ozone water cleaning capabilities to address contamination control requirements in gallium nitride device production, silicon carbide wafer processing, and perovskite solar cell research applications. The market shows solid growth potential with a CAGR of 4.2% through 2035, linked to compound semiconductor industry expansion, defense electronics manufacturing requirements, and renewable energy technology development programs supported by government research funding. British facilities are adopting specialized ozone cleaning configurations and application-specific process protocols to ensure optimal results in demanding materials systems and emerging device technologies.

Market development factors:

  • Compound semiconductor manufacturing clusters implementing customized ozone water cleaning for III-V materials processing and wide bandgap device fabrication
  • Research collaboration programs providing technology validation support through university partnerships and Catapult center demonstration facilities
  • Strategic partnerships between specialty chemical suppliers and equipment manufacturers enabling integrated cleaning process development and optimization services
  • Emphasis on defense and aerospace applications driving adoption of validated cleaning technologies meeting stringent quality and traceability requirements

How Does Precision Manufacturing Drive Market Advancement in Japan?

Japan's wet cleaning ozone water system market demonstrates sophisticated implementation focused on established semiconductor manufacturers and equipment suppliers, with documented integration of ozone cleaning technologies achieving world-class yield performance and contamination control results across memory device production and image sensor manufacturing operations. The country maintains steady growth through emphasis on process perfection and equipment reliability, with a CAGR of 3.7% through 2035, driven by continued leadership in memory chip production and advanced packaging technology development across fabrication facilities in Kyushu, Tohoku, and Kanto regions. Japanese semiconductor manufacturers prioritize long-term supplier relationships and emphasize total cost of ownership considerations when evaluating cleaning equipment investments.

Key market characteristics:
  • Memory device production in advanced fabs implementing ozone water cleaning for DRAM and NAND flash manufacturing with proven yield improvement results
  • Technology partnerships between domestic equipment manufacturers including Ebara and international ozone system suppliers ensuring optimal system integration and support
  • Collaboration between semiconductor manufacturers and equipment suppliers establishing industry-standard cleaning processes and equipment specifications
  • Emphasis on equipment uptime and preventive maintenance driving preference for proven system designs with established reliability track records

How Are Building Standards and Code Compliance Shaping Market Evolution Across Europe?

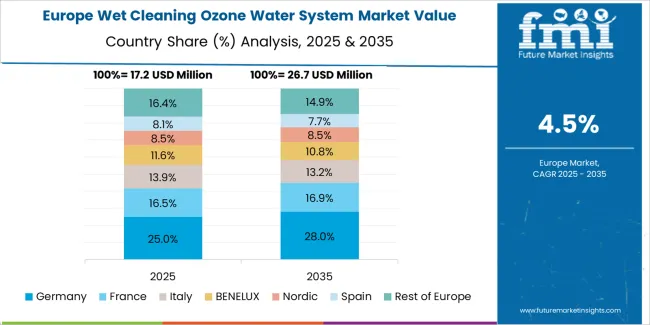
Wet Cleaning Ozone Water System Market Europe Country Market Share Analysis, 2025 & 2035

The wet cleaning ozone water system market in Europe is projected to grow from USD 16.8 million in 2025 to USD 26.8 million by 2035, registering a CAGR of 4.8% over the forecast period. Germany is expected to maintain its leadership position with a 32.5% market share in 2025, declining slightly to 31.8% by 2035, supported by its advanced semiconductor equipment manufacturing infrastructure and major technology centers including Dresden Silicon Saxony and Munich semiconductor clusters.

France follows with a 21.2% share in 2025, projected to reach 21.5% by 2035, driven by compound semiconductor manufacturing expansion and photovoltaic research facility development. The United Kingdom holds a 18.3% share in 2025, expected to reach 18.6% by 2035 through specialty semiconductor manufacturing growth. Italy commands a 12.5% share in both 2025 and 2035, backed by photovoltaic manufacturing and electronics assembly operations. Spain accounts for 8.2% in 2025, rising to 8.4% by 2035 on renewable energy manufacturing investments. The Netherlands maintains 7.3% market share throughout the forecast period. The Rest of Europe region is anticipated to hold 10.0% in 2025, expanding to 10.2% by 2035, attributed to increasing wet cleaning system adoption in Nordic countries and emerging Central & Eastern European semiconductor assembly and photovoltaic manufacturing operations.
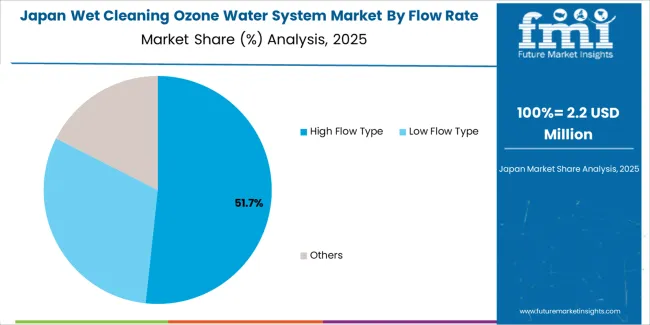
High Flow Systems Dominate Volume Manufacturing in Japan

Wet Cleaning Ozone Water System Market Japan Market Share Analysis By Flow Rate Type

The Japanese wet cleaning ozone water system market demonstrates a mature and technology-focused landscape, characterized by sophisticated integration of high flow type systems and advanced process control capabilities with existing semiconductor fabrication infrastructure across major memory manufacturers, image sensor producers, and power device fabrication facilities. Japan's emphasis on manufacturing excellence and zero-defect production drives demand for validated cleaning equipment that supports consistent process results and meets rigorous contamination control specifications in advanced manufacturing environments. The market benefits from strong partnerships between domestic equipment manufacturers including Ebara, Sumitomo Precision Products, and international ozone technology providers, creating comprehensive service ecosystems that prioritize equipment reliability and process engineering support. Fabrication facilities in Kyushu, Tohoku, and Kanto manufacturing clusters showcase advanced ozone water cleaning implementations where systems achieve 99.5% uptime and seamless integration with fab-wide automation platforms deployed across Japanese semiconductor production operations.
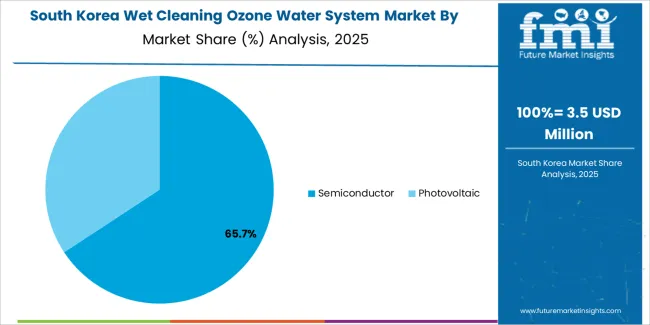
International Providers Lead Technical Services in South Korea

Wet Cleaning Ozone Water System Market South Korea Market Share Analysis By Application

The South Korean wet cleaning ozone water system market is characterized by growing international technology provider presence, with companies maintaining significant positions through comprehensive process validation services and technical support capabilities for memory device manufacturing and display panel production applications. The market demonstrates increasing emphasis on advanced cleaning technologies and process optimization, as Korean semiconductor manufacturers increasingly demand ozone water systems that integrate with domestic equipment platforms and sophisticated process control infrastructure deployed across Samsung, SK hynix, and other leading memory device production facilities. Regional equipment suppliers are gaining market share through strategic partnerships with international ozone generation specialists, offering specialized services including Korean semiconductor industry certification support and customized process programs for DRAM and NAND flash manufacturing operations. The competitive landscape shows increasing collaboration between multinational equipment companies and Korean fab engineering teams, creating hybrid service models that combine international cleaning technology expertise with local semiconductor manufacturing requirements and production efficiency optimization programs.

How Competitive Is the Global Weld Angle Brackets Market and What Defines Its Strategic Landscape?

The wet cleaning ozone water system market features approximately 15-20 meaningful players with moderate fragmentation, where the top three companies control roughly 40-45% of global market share through established semiconductor industry relationships and proven technology platforms. Competition centers on system reliability, cleaning performance validation, and process integration capabilities rather than price competition alone. Suzhou Jingtuo Semiconductor Technology leads in China with approximately 16.0% market share through its comprehensive product portfolio and strong domestic semiconductor fab relationships.

Market leaders include Suzhou Jingtuo Semiconductor Technology, Sumitomo Precision Products, and Ebara, which maintain competitive advantages through decades of semiconductor equipment manufacturing expertise, established customer bases among major foundries and device manufacturers, and proven process validation data from volume production environments across multiple technology nodes. These companies leverage research and development investments in advanced ozone dissolution technologies, precision flow control systems, and real-time monitoring capabilities to defend market positions while expanding into emerging semiconductor manufacturing regions and photovoltaic production applications.

Challengers encompass MKS Instruments and Meidensha Corporation, which compete through specialized cleaning system configurations and strong regional presence in North America and Asia-Pacific markets. Product specialists, including De Nora Permelec, HJS ENG, and MTK, focus on specific application segments or technology components, offering differentiated capabilities in ozone generation, system integration services, and customized cleaning protocols.

Regional players including Qingdao Guolin Semiconductor Technology and emerging equipment suppliers create competitive pressure through localized manufacturing advantages and rapid response capabilities, particularly in high-growth markets including China where proximity to semiconductor fabs provides benefits in installation support and ongoing technical service. Market dynamics favor companies that combine semiconductor industry process knowledge with comprehensive validation services that address the complete equipment lifecycle from initial process development through production ramp and ongoing yield optimization programs.

Who Are the Leading Companies and Innovators in the Weld Angle Brackets Market?

Wet Cleaning Ozone Water System Market Analysis By Company

  • Suzhou Jingtuo Semiconductor Technology
  • Sumitomo Precision Products
  • Ebara
  • MKS Instruments
  • Meidensha Corporation
  • De Nora Permelec
  • HJS ENG
  • MTK
  • Anseros
  • Qingdao Guolin Semiconductor Technology

Scope of the Report

Item Value
Quantitative Units USD 73 million
Flow Rate Type High Flow Type, Low Flow Type, Others
Application Semiconductor, Photovoltaic
Regions Covered Asia Pacific, Europe, North America, Latin America, Middle East & Africa
Country Covered China, India, Germany, Brazil, U.S., U.K., Japan, and 40+ countries
Key Companies Profiled Suzhou Jingtuo Semiconductor Technology, Sumitomo Precision Products, Ebara, MKS Instruments, Meidensha Corporation, De Nora Permelec, HJS ENG, MTK, Anseros, Qingdao Guolin Semiconductor Technology
Additional Attributes Dollar sales by flow rate type and application categories, regional adoption trends across Asia Pacific, Europe, and North America, competitive landscape with semiconductor equipment manufacturers and technology providers, system specifications and integration requirements, compatibility with semiconductor fabrication and photovoltaic manufacturing processes, innovations in ozone generation and dissolution technologies, and development of specialized cleaning systems with enhanced contamination removal and environmental sustainability capabilities.

How Is the Weld Angle Brackets Market Structured Across Material Type, Application, and Regional Segments?

Flow Rate Type:

  • High Flow Type
  • Low Flow Type
  • Others

Application:

  • Semiconductor
  • Photovoltaic

Region:

  • Asia Pacific
    • China
    • India
    • Japan
    • South Korea
    • Vietnam
    • Australia & New Zealand
    • ASEAN
    • Rest of Asia Pacific
  • Europe
    • Germany
    • United Kingdom
    • France
    • Italy
    • Spain
    • Netherlands
    • Nordic
    • BENELUX
    • Rest of Europe
  • North America
    • United States
    • Canada
    • Mexico
  • Latin America
    • Brazil
    • Argentina
    • Rest of Latin America
  • Middle East & Africa
    • Kingdom of Saudi Arabia
    • Other GCC Countries
    • Turkey
    • South Africa
    • Other African Union
    • Rest of Middle East & Africa

Frequently Asked Questions

How big is the wet cleaning ozone water system market in 2025?

The global wet cleaning ozone water system market is estimated to be valued at USD 73.0 million in 2025.

What will be the size of wet cleaning ozone water system market in 2035?

The market size for the wet cleaning ozone water system market is projected to reach USD 118.9 million by 2035.

How much will be the wet cleaning ozone water system market growth between 2025 and 2035?

The wet cleaning ozone water system market is expected to grow at a 5.0% CAGR between 2025 and 2035.

What are the key product types in the wet cleaning ozone water system market?

The key product types in wet cleaning ozone water system market are high flow type, low flow type and others.

Which application segment to contribute significant share in the wet cleaning ozone water system market in 2025?

In terms of application, semiconductor segment to command 68.0% share in the wet cleaning ozone water system market in 2025.

Table of Content

  1. Executive Summary
    • Global Market Outlook
    • Demand to side Trends
    • Supply to side Trends
    • Technology Roadmap Analysis
    • Analysis and Recommendations
  2. Market Overview
    • Market Coverage / Taxonomy
    • Market Definition / Scope / Limitations
  3. Market Background
    • Market Dynamics
      • Drivers
      • Restraints
      • Opportunity
      • Trends
    • Scenario Forecast
      • Demand in Optimistic Scenario
      • Demand in Likely Scenario
      • Demand in Conservative Scenario
    • Opportunity Map Analysis
    • Product Life Cycle Analysis
    • Supply Chain Analysis
    • Investment Feasibility Matrix
    • Value Chain Analysis
    • PESTLE and Porter’s Analysis
    • Regulatory Landscape
    • Regional Parent Market Outlook
    • Production and Consumption Statistics
    • Import and Export Statistics
  4. Global Market Analysis 2020 to 2024 and Forecast, 2025 to 2035
    • Historical Market Size Value (USD Million) Analysis, 2020 to 2024
    • Current and Future Market Size Value (USD Million) Projections, 2025 to 2035
      • Y to o to Y Growth Trend Analysis
      • Absolute $ Opportunity Analysis
  5. Global Market Pricing Analysis 2020 to 2024 and Forecast 2025 to 2035
  6. Global Market Analysis 2020 to 2024 and Forecast 2025 to 2035, By Flow Rate Type
    • Introduction / Key Findings
    • Historical Market Size Value (USD Million) Analysis By Flow Rate Type , 2020 to 2024
    • Current and Future Market Size Value (USD Million) Analysis and Forecast By Flow Rate Type , 2025 to 2035
      • High Flow Type
      • Low Flow Type
      • Others
    • Y to o to Y Growth Trend Analysis By Flow Rate Type , 2020 to 2024
    • Absolute $ Opportunity Analysis By Flow Rate Type , 2025 to 2035
  7. Global Market Analysis 2020 to 2024 and Forecast 2025 to 2035, By Application
    • Introduction / Key Findings
    • Historical Market Size Value (USD Million) Analysis By Application, 2020 to 2024
    • Current and Future Market Size Value (USD Million) Analysis and Forecast By Application, 2025 to 2035
      • Semiconductor
      • Photovoltaic
    • Y to o to Y Growth Trend Analysis By Application, 2020 to 2024
    • Absolute $ Opportunity Analysis By Application, 2025 to 2035
  8. Global Market Analysis 2020 to 2024 and Forecast 2025 to 2035, By Region
    • Introduction
    • Historical Market Size Value (USD Million) Analysis By Region, 2020 to 2024
    • Current Market Size Value (USD Million) Analysis and Forecast By Region, 2025 to 2035
      • North America
      • Latin America
      • Western Europe
      • Eastern Europe
      • East Asia
      • South Asia and Pacific
      • Middle East & Africa
    • Market Attractiveness Analysis By Region
  9. North America Market Analysis 2020 to 2024 and Forecast 2025 to 2035, By Country
    • Historical Market Size Value (USD Million) Trend Analysis By Market Taxonomy, 2020 to 2024
    • Market Size Value (USD Million) Forecast By Market Taxonomy, 2025 to 2035
      • By Country
        • USA
        • Canada
        • Mexico
      • By Flow Rate Type
      • By Application
    • Market Attractiveness Analysis
      • By Country
      • By Flow Rate Type
      • By Application
    • Key Takeaways
  10. Latin America Market Analysis 2020 to 2024 and Forecast 2025 to 2035, By Country
    • Historical Market Size Value (USD Million) Trend Analysis By Market Taxonomy, 2020 to 2024
    • Market Size Value (USD Million) Forecast By Market Taxonomy, 2025 to 2035
      • By Country
        • Brazil
        • Chile
        • Rest of Latin America
      • By Flow Rate Type
      • By Application
    • Market Attractiveness Analysis
      • By Country
      • By Flow Rate Type
      • By Application
    • Key Takeaways
  11. Western Europe Market Analysis 2020 to 2024 and Forecast 2025 to 2035, By Country
    • Historical Market Size Value (USD Million) Trend Analysis By Market Taxonomy, 2020 to 2024
    • Market Size Value (USD Million) Forecast By Market Taxonomy, 2025 to 2035
      • By Country
        • Germany
        • UK
        • Italy
        • Spain
        • France
        • Nordic
        • BENELUX
        • Rest of Western Europe
      • By Flow Rate Type
      • By Application
    • Market Attractiveness Analysis
      • By Country
      • By Flow Rate Type
      • By Application
    • Key Takeaways
  12. Eastern Europe Market Analysis 2020 to 2024 and Forecast 2025 to 2035, By Country
    • Historical Market Size Value (USD Million) Trend Analysis By Market Taxonomy, 2020 to 2024
    • Market Size Value (USD Million) Forecast By Market Taxonomy, 2025 to 2035
      • By Country
        • Russia
        • Poland
        • Hungary
        • Balkan & Baltic
        • Rest of Eastern Europe
      • By Flow Rate Type
      • By Application
    • Market Attractiveness Analysis
      • By Country
      • By Flow Rate Type
      • By Application
    • Key Takeaways
  13. East Asia Market Analysis 2020 to 2024 and Forecast 2025 to 2035, By Country
    • Historical Market Size Value (USD Million) Trend Analysis By Market Taxonomy, 2020 to 2024
    • Market Size Value (USD Million) Forecast By Market Taxonomy, 2025 to 2035
      • By Country
        • China
        • Japan
        • South Korea
      • By Flow Rate Type
      • By Application
    • Market Attractiveness Analysis
      • By Country
      • By Flow Rate Type
      • By Application
    • Key Takeaways
  14. South Asia and Pacific Market Analysis 2020 to 2024 and Forecast 2025 to 2035, By Country
    • Historical Market Size Value (USD Million) Trend Analysis By Market Taxonomy, 2020 to 2024
    • Market Size Value (USD Million) Forecast By Market Taxonomy, 2025 to 2035
      • By Country
        • India
        • ASEAN
        • Australia & New Zealand
        • Rest of South Asia and Pacific
      • By Flow Rate Type
      • By Application
    • Market Attractiveness Analysis
      • By Country
      • By Flow Rate Type
      • By Application
    • Key Takeaways
  15. Middle East & Africa Market Analysis 2020 to 2024 and Forecast 2025 to 2035, By Country
    • Historical Market Size Value (USD Million) Trend Analysis By Market Taxonomy, 2020 to 2024
    • Market Size Value (USD Million) Forecast By Market Taxonomy, 2025 to 2035
      • By Country
        • Kingdom of Saudi Arabia
        • Other GCC Countries
        • Turkiye
        • South Africa
        • Other African Union
        • Rest of Middle East & Africa
      • By Flow Rate Type
      • By Application
    • Market Attractiveness Analysis
      • By Country
      • By Flow Rate Type
      • By Application
    • Key Takeaways
  16. Key Countries Market Analysis
    • USA
      • Pricing Analysis
      • Market Share Analysis, 2024
        • By Flow Rate Type
        • By Application
    • Canada
      • Pricing Analysis
      • Market Share Analysis, 2024
        • By Flow Rate Type
        • By Application
    • Mexico
      • Pricing Analysis
      • Market Share Analysis, 2024
        • By Flow Rate Type
        • By Application
    • Brazil
      • Pricing Analysis
      • Market Share Analysis, 2024
        • By Flow Rate Type
        • By Application
    • Chile
      • Pricing Analysis
      • Market Share Analysis, 2024
        • By Flow Rate Type
        • By Application
    • Germany
      • Pricing Analysis
      • Market Share Analysis, 2024
        • By Flow Rate Type
        • By Application
    • UK
      • Pricing Analysis
      • Market Share Analysis, 2024
        • By Flow Rate Type
        • By Application
    • Italy
      • Pricing Analysis
      • Market Share Analysis, 2024
        • By Flow Rate Type
        • By Application
    • Spain
      • Pricing Analysis
      • Market Share Analysis, 2024
        • By Flow Rate Type
        • By Application
    • France
      • Pricing Analysis
      • Market Share Analysis, 2024
        • By Flow Rate Type
        • By Application
    • India
      • Pricing Analysis
      • Market Share Analysis, 2024
        • By Flow Rate Type
        • By Application
    • ASEAN
      • Pricing Analysis
      • Market Share Analysis, 2024
        • By Flow Rate Type
        • By Application
    • Australia & New Zealand
      • Pricing Analysis
      • Market Share Analysis, 2024
        • By Flow Rate Type
        • By Application
    • China
      • Pricing Analysis
      • Market Share Analysis, 2024
        • By Flow Rate Type
        • By Application
    • Japan
      • Pricing Analysis
      • Market Share Analysis, 2024
        • By Flow Rate Type
        • By Application
    • South Korea
      • Pricing Analysis
      • Market Share Analysis, 2024
        • By Flow Rate Type
        • By Application
    • Russia
      • Pricing Analysis
      • Market Share Analysis, 2024
        • By Flow Rate Type
        • By Application
    • Poland
      • Pricing Analysis
      • Market Share Analysis, 2024
        • By Flow Rate Type
        • By Application
    • Hungary
      • Pricing Analysis
      • Market Share Analysis, 2024
        • By Flow Rate Type
        • By Application
    • Kingdom of Saudi Arabia
      • Pricing Analysis
      • Market Share Analysis, 2024
        • By Flow Rate Type
        • By Application
    • Turkiye
      • Pricing Analysis
      • Market Share Analysis, 2024
        • By Flow Rate Type
        • By Application
    • South Africa
      • Pricing Analysis
      • Market Share Analysis, 2024
        • By Flow Rate Type
        • By Application
  17. Market Structure Analysis
    • Competition Dashboard
    • Competition Benchmarking
    • Market Share Analysis of Top Players
      • By Regional
      • By Flow Rate Type
      • By Application
  18. Competition Analysis
    • Competition Deep Dive
      • Suzhou Jingtuo Semiconductor Technology
        • Overview
        • Product Portfolio
        • Profitability by Market Segments (Product/Age /Sales Channel/Region)
        • Sales Footprint
        • Strategy Overview
          • Marketing Strategy
          • Product Strategy
          • Channel Strategy
      • Sumitomo Precision Products
      • Ebara
      • MKS Instruments
      • Meidensha Corporation
      • De Nora Permelec
      • HJS ENG
      • MTK
      • Anseros
      • Qingdao Guolin Semiconductor Technology
  19. Assumptions & Acronyms Used
  20. Research Methodology

List of Tables

  • Table 1: Global Market Value (USD Million) Forecast by Region, 2020 to 2035
  • Table 2: Global Market Value (USD Million) Forecast by Flow Rate Type , 2020 to 2035
  • Table 3: Global Market Value (USD Million) Forecast by Application, 2020 to 2035
  • Table 4: North America Market Value (USD Million) Forecast by Country, 2020 to 2035
  • Table 5: North America Market Value (USD Million) Forecast by Flow Rate Type , 2020 to 2035
  • Table 6: North America Market Value (USD Million) Forecast by Application, 2020 to 2035
  • Table 7: Latin America Market Value (USD Million) Forecast by Country, 2020 to 2035
  • Table 8: Latin America Market Value (USD Million) Forecast by Flow Rate Type , 2020 to 2035
  • Table 9: Latin America Market Value (USD Million) Forecast by Application, 2020 to 2035
  • Table 10: Western Europe Market Value (USD Million) Forecast by Country, 2020 to 2035
  • Table 11: Western Europe Market Value (USD Million) Forecast by Flow Rate Type , 2020 to 2035
  • Table 12: Western Europe Market Value (USD Million) Forecast by Application, 2020 to 2035
  • Table 13: Eastern Europe Market Value (USD Million) Forecast by Country, 2020 to 2035
  • Table 14: Eastern Europe Market Value (USD Million) Forecast by Flow Rate Type , 2020 to 2035
  • Table 15: Eastern Europe Market Value (USD Million) Forecast by Application, 2020 to 2035
  • Table 16: East Asia Market Value (USD Million) Forecast by Country, 2020 to 2035
  • Table 17: East Asia Market Value (USD Million) Forecast by Flow Rate Type , 2020 to 2035
  • Table 18: East Asia Market Value (USD Million) Forecast by Application, 2020 to 2035
  • Table 19: South Asia and Pacific Market Value (USD Million) Forecast by Country, 2020 to 2035
  • Table 20: South Asia and Pacific Market Value (USD Million) Forecast by Flow Rate Type , 2020 to 2035
  • Table 21: South Asia and Pacific Market Value (USD Million) Forecast by Application, 2020 to 2035
  • Table 22: Middle East & Africa Market Value (USD Million) Forecast by Country, 2020 to 2035
  • Table 23: Middle East & Africa Market Value (USD Million) Forecast by Flow Rate Type , 2020 to 2035
  • Table 24: Middle East & Africa Market Value (USD Million) Forecast by Application, 2020 to 2035

List of Figures

  • Figure 1: Global Market Pricing Analysis
  • Figure 2: Global Market Value (USD Million) Forecast 2020-2035
  • Figure 3: Global Market Value Share and BPS Analysis by Flow Rate Type , 2025 and 2035
  • Figure 4: Global Market Y to o to Y Growth Comparison by Flow Rate Type , 2025-2035
  • Figure 5: Global Market Attractiveness Analysis by Flow Rate Type
  • Figure 6: Global Market Value Share and BPS Analysis by Application, 2025 and 2035
  • Figure 7: Global Market Y to o to Y Growth Comparison by Application, 2025-2035
  • Figure 8: Global Market Attractiveness Analysis by Application
  • Figure 9: Global Market Value (USD Million) Share and BPS Analysis by Region, 2025 and 2035
  • Figure 10: Global Market Y to o to Y Growth Comparison by Region, 2025-2035
  • Figure 11: Global Market Attractiveness Analysis by Region
  • Figure 12: North America Market Incremental Dollar Opportunity, 2025-2035
  • Figure 13: Latin America Market Incremental Dollar Opportunity, 2025-2035
  • Figure 14: Western Europe Market Incremental Dollar Opportunity, 2025-2035
  • Figure 15: Eastern Europe Market Incremental Dollar Opportunity, 2025-2035
  • Figure 16: East Asia Market Incremental Dollar Opportunity, 2025-2035
  • Figure 17: South Asia and Pacific Market Incremental Dollar Opportunity, 2025-2035
  • Figure 18: Middle East & Africa Market Incremental Dollar Opportunity, 2025-2035
  • Figure 19: North America Market Value Share and BPS Analysis by Country, 2025 and 2035
  • Figure 20: North America Market Value Share and BPS Analysis by Flow Rate Type , 2025 and 2035
  • Figure 21: North America Market Y to o to Y Growth Comparison by Flow Rate Type , 2025-2035
  • Figure 22: North America Market Attractiveness Analysis by Flow Rate Type
  • Figure 23: North America Market Value Share and BPS Analysis by Application, 2025 and 2035
  • Figure 24: North America Market Y to o to Y Growth Comparison by Application, 2025-2035
  • Figure 25: North America Market Attractiveness Analysis by Application
  • Figure 26: Latin America Market Value Share and BPS Analysis by Country, 2025 and 2035
  • Figure 27: Latin America Market Value Share and BPS Analysis by Flow Rate Type , 2025 and 2035
  • Figure 28: Latin America Market Y to o to Y Growth Comparison by Flow Rate Type , 2025-2035
  • Figure 29: Latin America Market Attractiveness Analysis by Flow Rate Type
  • Figure 30: Latin America Market Value Share and BPS Analysis by Application, 2025 and 2035
  • Figure 31: Latin America Market Y to o to Y Growth Comparison by Application, 2025-2035
  • Figure 32: Latin America Market Attractiveness Analysis by Application
  • Figure 33: Western Europe Market Value Share and BPS Analysis by Country, 2025 and 2035
  • Figure 34: Western Europe Market Value Share and BPS Analysis by Flow Rate Type , 2025 and 2035
  • Figure 35: Western Europe Market Y to o to Y Growth Comparison by Flow Rate Type , 2025-2035
  • Figure 36: Western Europe Market Attractiveness Analysis by Flow Rate Type
  • Figure 37: Western Europe Market Value Share and BPS Analysis by Application, 2025 and 2035
  • Figure 38: Western Europe Market Y to o to Y Growth Comparison by Application, 2025-2035
  • Figure 39: Western Europe Market Attractiveness Analysis by Application
  • Figure 40: Eastern Europe Market Value Share and BPS Analysis by Country, 2025 and 2035
  • Figure 41: Eastern Europe Market Value Share and BPS Analysis by Flow Rate Type , 2025 and 2035
  • Figure 42: Eastern Europe Market Y to o to Y Growth Comparison by Flow Rate Type , 2025-2035
  • Figure 43: Eastern Europe Market Attractiveness Analysis by Flow Rate Type
  • Figure 44: Eastern Europe Market Value Share and BPS Analysis by Application, 2025 and 2035
  • Figure 45: Eastern Europe Market Y to o to Y Growth Comparison by Application, 2025-2035
  • Figure 46: Eastern Europe Market Attractiveness Analysis by Application
  • Figure 47: East Asia Market Value Share and BPS Analysis by Country, 2025 and 2035
  • Figure 48: East Asia Market Value Share and BPS Analysis by Flow Rate Type , 2025 and 2035
  • Figure 49: East Asia Market Y to o to Y Growth Comparison by Flow Rate Type , 2025-2035
  • Figure 50: East Asia Market Attractiveness Analysis by Flow Rate Type
  • Figure 51: East Asia Market Value Share and BPS Analysis by Application, 2025 and 2035
  • Figure 52: East Asia Market Y to o to Y Growth Comparison by Application, 2025-2035
  • Figure 53: East Asia Market Attractiveness Analysis by Application
  • Figure 54: South Asia and Pacific Market Value Share and BPS Analysis by Country, 2025 and 2035
  • Figure 55: South Asia and Pacific Market Value Share and BPS Analysis by Flow Rate Type , 2025 and 2035
  • Figure 56: South Asia and Pacific Market Y to o to Y Growth Comparison by Flow Rate Type , 2025-2035
  • Figure 57: South Asia and Pacific Market Attractiveness Analysis by Flow Rate Type
  • Figure 58: South Asia and Pacific Market Value Share and BPS Analysis by Application, 2025 and 2035
  • Figure 59: South Asia and Pacific Market Y to o to Y Growth Comparison by Application, 2025-2035
  • Figure 60: South Asia and Pacific Market Attractiveness Analysis by Application
  • Figure 61: Middle East & Africa Market Value Share and BPS Analysis by Country, 2025 and 2035
  • Figure 62: Middle East & Africa Market Value Share and BPS Analysis by Flow Rate Type , 2025 and 2035
  • Figure 63: Middle East & Africa Market Y to o to Y Growth Comparison by Flow Rate Type , 2025-2035
  • Figure 64: Middle East & Africa Market Attractiveness Analysis by Flow Rate Type
  • Figure 65: Middle East & Africa Market Value Share and BPS Analysis by Application, 2025 and 2035
  • Figure 66: Middle East & Africa Market Y to o to Y Growth Comparison by Application, 2025-2035
  • Figure 67: Middle East & Africa Market Attractiveness Analysis by Application
  • Figure 68: Global Market - Tier Structure Analysis
  • Figure 69: Global Market - Company Share Analysis
Dashboard
Dashboard
Dashboard
Dashboard
Dashboard
Dashboard

Full Research Suite comprises of:

Market outlook & trends analysis

Market outlook & trends analysis

Interviews & case studies

Interviews & case studies

Strategic recommendations

Strategic recommendations

Vendor profiles & capabilities analysis

Vendor profiles & capabilities analysis

5-year forecasts

5-year forecasts

8 regions and 60+ country-level data splits

8 regions and 60+ country-level data splits

Market segment data splits

Market segment data splits

12 months of continuous data updates

12 months of continuous data updates

DELIVERED AS:

PDF EXCEL ONLINE

Full Research Suite


$5000

$7500

$10000

Buy Report Now
Similar Industry Reports

Similar Industry Reports

Wet Food for Cat Market

Wet Food for Cat Market Size and Share Forecast Outlook 2025 to 2035

Wet Food Pouch Market

Wet Food Pouch Market Size and Share Forecast Outlook 2025 to 2035

Wetting Agent Market

Wetting Agent Market Size and Share Forecast Outlook 2025 to 2035

Wet Mix Plant Market Analysis and Opportunity Assessment in India

Wet Mix Plant Market Analysis and Opportunity Assessment in India Size and Share Forecast Outlook 2025 to 2035

Wet Process Equipment Market

Wet Process Equipment Market Size and Share Forecast Outlook 2025 to 2035

Wet Vacuum Pumps Market

Wet Vacuum Pumps Market Size and Share Forecast Outlook 2025 to 2035

Wet Electrostatic Precipitator Market

Wet Electrostatic Precipitator Market Size and Share Forecast Outlook 2025 to 2035

Wet Pet Food Market
Wet Pet Food Market

Wet Pet Food Market Analysis - Size, Share, and Forecast Outlook 2025 to 2035

Wet Vacuum Cleaner Market

Wet Vacuum Cleaner Market Size and Share Forecast Outlook 2025 to 2035

Wet Strength Paper Market

Wet Strength Paper Market Analysis - Size, Share, and Forecast Outlook 2025 to 2035

Wet Wipes Canister Market

Wet Wipes Canister Market - Demand & Forecast 2025 to 2035

Wetsuit Market
Wetsuit Market

Wetsuit Market Trends - Growth, Demand & Forecast 2025 to 2035

Wet Wipes Market
Wet Wipes Market

Wet Wipes Market - Trends & Forecast 2025 to 2035

Wet Glue Labelling Machines Market

Wet Glue Labelling Machines Market

Wet Fertilizer Spreaders Market

Wet Fertilizer Spreaders Market

Wet Ink Coding Machines Market

Wet Ink Coding Machines Market

Corn Wet Milling Services Market

Corn Wet Milling Services Market Size, Growth, and Forecast for 2025 to 2035

Burn-Wet Gas Abatement System Market

Burn-Wet Gas Abatement System Market Size and Share Forecast Outlook 2025 to 2035

Canned Wet Cat Food Market

Canned Wet Cat Food Market Size and Share Forecast Outlook 2025 to 2035

Dry and Wet Wipes Market

Dry and Wet Wipes Market Size and Share Forecast Outlook 2025 to 2035

Future Market Insights

Wet Cleaning Ozone Water System Market

Chat With MaRIA

Chat With

MaRIA

Hi There, I am MaRIA, Your Market Research Intelligence Assistant. How may I help you?