The wet electrostatic precipitator market is estimated to be valued at USD 1.3 billion in 2025 and is projected to reach USD 2.5 billion by 2035, registering a compound annual growth rate (CAGR) of 6.9% over the forecast period.
These systems are increasingly deployed in industries such as power generation, chemical processing, cement, steel, and waste-to-energy, where effective removal of fine particulate matter, aerosols, and acid mists is critical to meet tightening emission regulations. Their ability to handle sticky or high-resistivity particles gives them an edge over dry alternatives in niche but expanding applications. Rolling CAGR analysis highlights the variability in growth momentum across the forecast horizon. Between 2025 and 2028, the market records moderate rolling CAGR values of 6.5–6.8%, supported by regulatory compliance initiatives in North America and Europe.
The middle phase from 2029 to 2032 shows stronger rolling CAGR of around 7.0–7.2%, as Asia Pacific industrial expansion and stricter environmental enforcement accelerate adoption. The final phase from 2033 to 2035 shows a slight moderation with rolling CAGR stabilizing near 6.6–6.8% as penetration levels rise and replacement demand becomes more prominent. Overall, the USD 1.2 billion absolute gain across the period reflects consistent upward momentum, with rolling CAGR trends confirming steady, regulation-driven adoption balanced between developed and emerging regions.
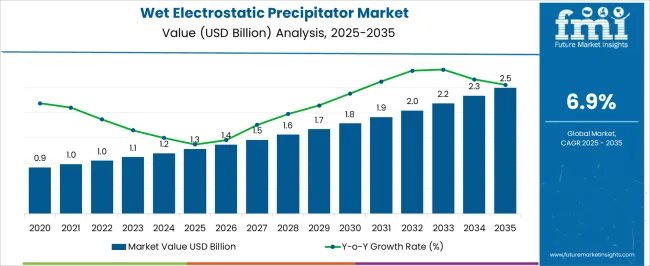
| Metric | Value |
|---|---|
| Wet Electrostatic Precipitator Market Estimated Value in (2025 E) | USD 1.3 billion |
| Wet Electrostatic Precipitator Market Forecast Value in (2035 F) | USD 2.5 billion |
| Forecast CAGR (2025 to 2035) | 6.9% |
The wet electrostatic precipitator market is primarily driven by the power generation industry, which holds about 30% of the market share, using these systems to control fine particulate emissions from coal and biomass plants. The chemical and petrochemical sector contributes around 25%, requiring effective gas cleaning solutions for production processes. The cement industry represents nearly 15%, where emission regulations encourage adoption of wet ESPs. The pulp and paper sector accounts for approximately 15%, deploying them to manage recovery boiler emissions. The remaining 15% comes from steel and other heavy industries, where wet ESPs ensure compliance with strict air quality standards. The wet electrostatic precipitator market is experiencing growth through technological innovation and regulatory influence.
Compact and modular wet ESP designs are gaining popularity as industries seek space-efficient solutions. Advanced electrode and power supply technologies are being adopted to improve collection efficiency for submicron particles and acid mists. Demand for corrosion-resistant materials is rising, enhancing system durability in harsh industrial environments. Digital monitoring and control systems are increasingly integrated to optimize performance and reduce maintenance downtime. Manufacturers are expanding their product portfolios to target new applications while collaborating with environmental solution providers to address stricter global emission norms.
The market is undergoing sustained growth, supported by stricter global regulations targeting fine particulate emissions and hazardous air pollutants. Industrial sectors are increasingly investing in advanced emission control technologies to meet compliance standards and reduce environmental impact.
Wet electrostatic precipitators are being favored for their high efficiency in capturing submicron particles, acid mists, and heavy metals that conventional dry systems cannot effectively manage. Demand is also being driven by growing environmental awareness, expansion of industrial infrastructure, and the need for improved air quality in both developed and emerging economies.
As industries continue to prioritize ESG goals and long-term operational sustainability, the adoption of wet electrostatic precipitators is expected to rise The future outlook remains strong, with innovation focused on cost-efficient designs, enhanced corrosion resistance, and integration with continuous emission monitoring systems for real-time optimization.
The wet electrostatic precipitator market is segmented by design, emitting industry, and geographic regions. By design, wet electrostatic precipitator market is divided into plate and tubular. In terms of emitting industry, wet electrostatic precipitator market is classified into power generation, chemicals and petrochemicals, cement, metal processing & mining, manufacturing, marine, and others. Regionally, the wet electrostatic precipitator industry is classified into North America, Latin America, Western Europe, Eastern Europe, Balkan & Baltic Countries, Russia & Belarus, Central Asia, East Asia, South Asia & Pacific, and the Middle East & Africa.
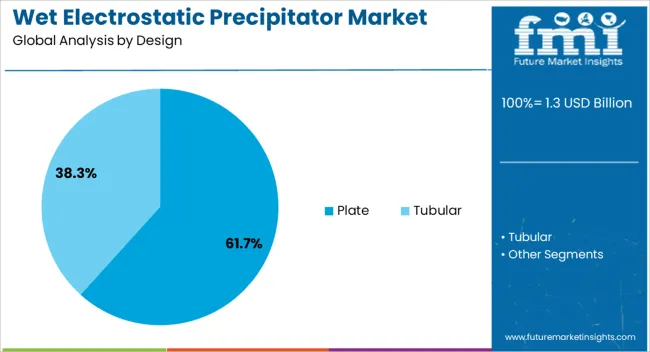
The plate design segment is anticipated to account for 61.7% of the wet electrostatic precipitator market revenue in 2025, making it the most prominent configuration within the design category. This leading position is being attributed to the plate design’s structural simplicity, wide surface area, and consistent performance across high-volume industrial applications. The design is especially effective in applications requiring the removal of fine particulate matter, allowing stable electrical field distribution and uniform particle collection.
Due to its relatively lower maintenance needs and ease of mechanical cleaning, the plate configuration has been widely adopted in continuous operations where uptime is critical. Industries processing corrosive or sticky exhaust compounds have favored this design due to its robustness and adaptability in harsh environments.
Its scalability and suitability for retrofitting existing systems have further contributed to its market leadership With increased investments in emission control technologies and modernization of pollution abatement infrastructure, the plate design segment is expected to maintain its dominance.
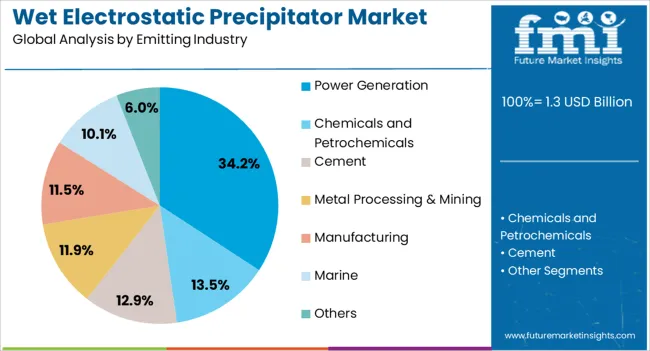
The power generation segment is projected to contribute 34.2% of the total revenue in the market by 2025, establishing it as the leading end-use industry. This share is being driven by the industry's requirement to control emissions from coal-fired and biomass power plants where sulfuric acid mist, fine ash, and heavy metal particulates are prevalent.
The deployment of wet electrostatic precipitators has become essential for facilities operating under tightening air quality regulations, particularly in regions with legacy thermal plants and high pollution burdens. Adoption has been supported by the need to achieve ultra-low emission limits without compromising operational efficiency.
The ability of wet systems to handle high-moisture, high-temperature flue gases has made them ideal for complex power generation processes As many countries continue to upgrade emission control equipment in older plants and integrate pollution abatement systems in new installations, the power generation segment is expected to play a pivotal role in driving sustained market demand.
The wet electrostatic precipitator market is expanding due to stricter emission regulations and rising industrial pollution control requirements. Global revenue crossed USD 3.1 billion in 2024, with Asia Pacific contributing 43% share led by China, India, and South Korea due to large-scale power and steel plants. Europe holds 27%, supported by Germany, Italy, and UK adopting advanced air quality standards. North America contributes 22%, with strong demand from oil refineries, chemical plants, and pulp & paper industries. WESPs are widely used for removing fine particulates, acid mists, and heavy metals. Adoption is supported by their high efficiency, durability, and ability to capture submicron particles in wet gas streams.
Power generation and heavy industrial facilities account for over 55% of WESP demand globally. Coal-fired and biomass power plants represent 30%, while steel, cement, and non-ferrous smelters contribute another 25%. Asia Pacific leads with 43% share, driven by rapid industrial expansion in China and India. Europe contributes 27%, with energy-intensive industries adopting wet ESPs for fine particulate and SO₃ control. North America accounts for 22% with strong applications in oil refineries and chemical manufacturing. WESPs improve particulate collection efficiency up to 99.9% for wet gas streams. Industrial focus on reducing PM2.5 and hazardous pollutants continues to strengthen global adoption.
Technological improvements in electrode design, gas distribution, and corrosion-resistant materials are increasing WESP efficiency and reliability. High-frequency power supplies improve particle charging and collection, boosting efficiency by 8–12% compared to conventional units. Corrosion-resistant alloys and FRP linings extend equipment lifespan by 15–20%. Modular designs support easy retrofitting in existing plants. Asia Pacific emphasizes large-scale installations for power and steel sectors. Europe invests in compact WESPs suitable for cement and waste-to-energy plants. North America focuses on advanced control systems integrating IoT for real-time monitoring. These innovations ensure compliance with stricter emission norms and reduce overall maintenance costs for end users.
Beyond power and steel, WESPs are increasingly adopted in chemical, pulp & paper, and waste-to-energy sectors. Chemical and petrochemical industries represent 15% of adoption, driven by control of acid mists and VOCs. Pulp & paper contributes 10%, where WESPs control fine particulate emissions from recovery boilers. Waste-to-energy plants account for 12% due to rising urban waste processing. Asia Pacific dominates with strong growth in industrial retrofits. Europe emphasizes installations in waste-to-energy facilities to meet stringent emission rules. North America’s pulp & paper industry continues to invest in upgrades. Broader industrial adoption beyond power plants is sustaining market expansion worldwide.
WESPs involve high installation costs, typically USD 2–8 million per unit depending on size and application, creating barriers for smaller industries. Operating costs increase by 12–18% annually due to energy-intensive power supplies, water usage, and maintenance requirements. Complexities in handling wet gas streams, corrosion, and scaling add to operational challenges. Skilled labor is required for efficient operation and regular inspections. Supply chain disruptions for specialty alloys and FRP linings affect project timelines. Manufacturers address these challenges by offering modular systems, energy-efficient power supplies, and advanced corrosion protection. Despite these improvements, capital intensity and operational complexity remain key constraints globally.
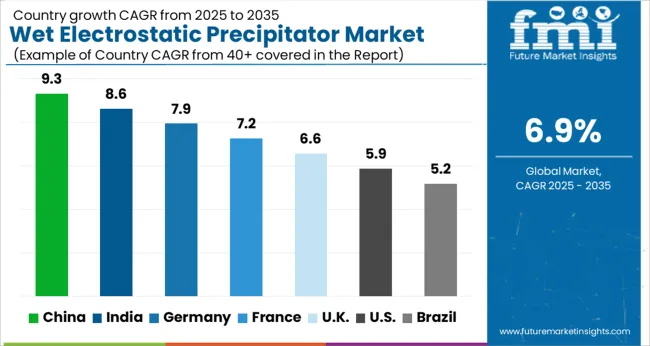
| Country | CAGR |
|---|---|
| China | 9.3% |
| India | 8.6% |
| Germany | 7.9% |
| France | 7.2% |
| UK | 6.6% |
| USA | 5.9% |
| Brazil | 5.2% |
The wet electrostatic precipitator market is expected to grow at a global CAGR of 6.9% through 2035, supported by increasing demand for advanced air pollution control systems in power generation, cement, steel, and chemical industries. China leads at 9.3%, 34.8% above the global benchmark, driven by BRICS-led expansion in industrial manufacturing, stricter emission regulations, and investments in energy-intensive sectors. India follows at 8.6%, 24.6% higher than the global average, reflecting rising adoption in thermal power plants, metal processing, and large-scale industrial projects. Germany records 7.9%, 14.5% above the benchmark, shaped by OECD-driven innovation in emission control technologies, integration with clean energy projects, and industrial retrofitting. The United Kingdom posts 6.6%, 4.3% below the global rate, influenced by applications in waste-to-energy facilities, industrial compliance, and specialized projects. The United States stands at 5.9%, 14.5% below the benchmark, with steady adoption in power generation, oil and gas refineries, and industrial manufacturing. BRICS economies account for the largest share of market expansion, OECD countries emphasize efficiency and regulatory compliance, while ASEAN nations contribute through growing industrial capacity and tightening environmental standards.
The wet electrostatic precipitator market in China is forecast to expand at a CAGR of 9.3%, well above the global CAGR of 6.9%, supported by large-scale adoption in power generation, steel, and cement industries. In 2024, installations increased by 17% as stricter emission control policies accelerated adoption. Provincial clusters in Hebei, Shandong, and Jiangsu enhanced capacity to manage industrial particulates and acid mist emissions. Domestic companies including Longking and Feida Environmental are expanding production while global suppliers such as GE and FLSmidth are strengthening partnerships with local players. Demand is reinforced by continuous investments in pollution control infrastructure.
India’s wet electrostatic precipitator market is projected to record a CAGR of 8.6%, above the global CAGR of 6.9%, driven by adoption in thermal power plants, petrochemical complexes, and cement facilities. In 2024, installations rose by 14%, with demand concentrated in industrial hubs across Maharashtra, Gujarat, and Odisha. Domestic manufacturers such as Thermax and BHEL expanded product portfolios, while multinational suppliers including Mitsubishi Hitachi Power Systems introduced advanced high-efficiency units. Growth is further supported by increasing requirements for flue gas desulfurization in coal-fired plants.
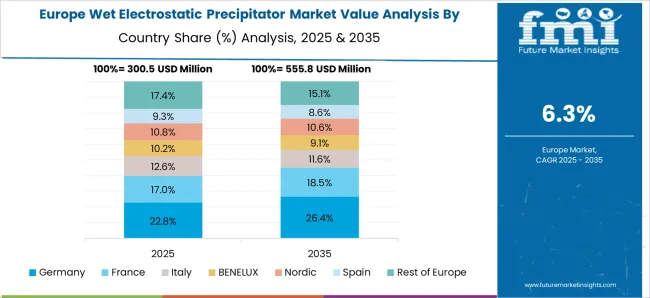
Germany’s wet electrostatic precipitator market is expected to grow at a CAGR of 7.9%, higher than the global 6.9%, with adoption driven by strict air quality directives and demand in chemical and waste-to-energy sectors. In 2024, installations increased by 12% as operators sought compliance with EU-level standards. German engineering firms such as Siemens and GEA are active in supplying high-performance systems with advanced corrosion-resistant designs. Deployment is concentrated in industrial hubs of North Rhine-Westphalia and Bavaria, with applications spanning biomass plants and hazardous waste incinerators.
The wet electrostatic precipitator market in the United Kingdom is estimated to advance at a CAGR of 6.6%, close to the global CAGR of 6.9%, reflecting steady demand in waste management and industrial energy recovery. In 2024, installations increased by 9% with strong uptake in urban incineration facilities and biomass energy plants. Companies such as Babcock UK and Clyde Bergemann targeted advanced system upgrades and retrofits, while international suppliers introduced hybrid designs tailored to the UK market. Expansion is guided by the country’s focus on reducing industrial particulate emissions.
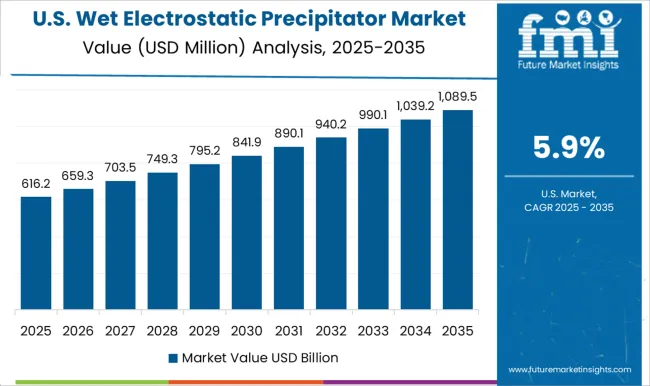
The wet electrostatic precipitator market in the United States is projected to grow at a CAGR of 5.9%, below the global CAGR of 6.9%, with growth shaped by selective adoption in oil refining, pulp and paper, and specialty chemical sectors. In 2024, installations increased by 7%, primarily in states with stricter air emission regulations. Domestic manufacturers such as Belco Technologies and PPC Industries focused on upgrading existing systems with automation and improved efficiency. Growth remains steady, with demand influenced by compliance-driven retrofits rather than large-scale new capacity additions.
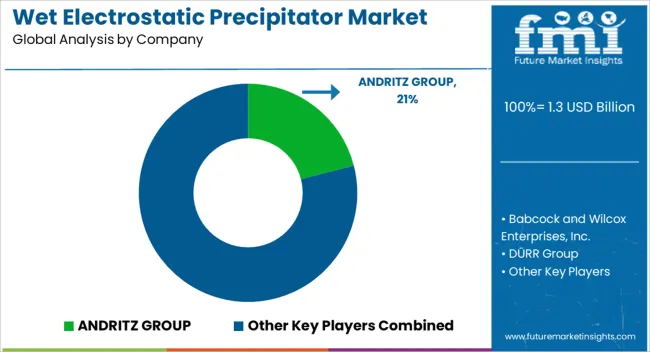
Competition in the wet electrostatic precipitator market is being shaped by efficiency in capturing fine particulates, corrosion resistance, and adaptability to industrial emissions control. Market positions are being sustained through certified systems, engineering support, and reliable installation services that ensure compliance with air quality standards. ANDRITZ GROUP is being represented with wet ESPs designed for high-performance particulate removal in power and pulp sectors, while Babcock and Wilcox Enterprises, Inc. is being promoted with advanced systems structured for energy and heavy industry. DÜRR Group is being applied with solutions tailored for chemical and waste-to-energy facilities.
Duconenv is being showcased with compact wet ESPs designed for flexible applications. Enviropol Engineers is being recognized with customized designs suited for regional environmental needs. KC Cottrell India is being advanced with wet ESPs structured for cement and steel industries. Mitsubishi Heavy Industries, Ltd. is being promoted with large-scale installations designed for power generation and process industries. PPC Industries is being applied with tailored precipitators suited for heavy-duty applications. ReGaWatt GmbH is being represented with systems designed for biomass and renewable energy facilities. Sumitomo Heavy Industries Ltd. is being advanced with precision-engineered wet ESPs optimized for industrial exhaust control. TAPC is being showcased with wet ESPs designed for efficient mist and fume capture. Thermax is being promoted with solutions structured for thermal power and industrial applications.
Valmet is being applied with wet ESPs engineered for pulp, paper, and energy sectors. Wood Plc is being recognized with flexible designs adapted for varied industrial processes. Strategies are being directed toward expanding installation capacity, strengthening regulatory compliance support, and improving long-term service contracts. Product brochures are being structured with specifications covering collection efficiency, gas flow rates, electrode design, corrosion protection, and maintenance requirements. Features such as modular construction, advanced control systems, and adaptability to corrosive environments are being emphasized to support procurement decisions. Each brochure is being arranged to present technical data, operating parameters, and service support. Information is being provided in a clear format to assist plant operators, environmental engineers, and purchasing teams in selecting wet electrostatic precipitators that align with emission control, durability, and operational requirements.
| Item | Value |
|---|---|
| Quantitative Units | USD 1.3 billion |
| Design | Plate and Tubular |
| Emitting Industry | Power Generation, Chemicals and Petrochemicals, Cement, Metal Processing & Mining, Manufacturing, Marine, and Others |
| Regions Covered | North America, Europe, Asia-Pacific, Latin America, Middle East & Africa |
| Country Covered | United States, Canada, Germany, France, United Kingdom, China, Japan, India, Brazil, South Africa |
| Key Companies Profiled | ANDRITZ GROUP, Babcock and Wilcox Enterprises, Inc., DÜRR Group, Duconenv, Enviropol Engineers, KC Cottrell India, Mitsubishi Heavy Industries, Ltd., PPC Industries, ReGaWatt GmbH, Sumitomo Heavy Industries Ltd., TAPC, Thermax, Valmet, and Wood Plc |
| Additional Attributes | Dollar sales by precipitator type and end use, demand dynamics across power generation, chemicals, and metals, regional trends in emission control adoption, innovation in collection efficiency and corrosion resistance, environmental impact of wastewater and sludge, and emerging use cases in biomass plants and waste-to-energy facilities. |
The global wet electrostatic precipitator market is estimated to be valued at USD 1.3 billion in 2025.
The market size for the wet electrostatic precipitator market is projected to reach USD 2.5 billion by 2035.
The wet electrostatic precipitator market is expected to grow at a 6.9% CAGR between 2025 and 2035.
The key product types in wet electrostatic precipitator market are plate and tubular.
In terms of emitting industry, power generation segment to command 34.2% share in the wet electrostatic precipitator market in 2025.


Full Research Suite comprises of:
Market outlook & trends analysis
Interviews & case studies
Strategic recommendations
Vendor profiles & capabilities analysis
5-year forecasts
8 regions and 60+ country-level data splits
Market segment data splits
12 months of continuous data updates
DELIVERED AS:
PDF EXCEL ONLINE
Wet Food for Cat Market Size and Share Forecast Outlook 2025 to 2035
Wet Food Pouch Market Size and Share Forecast Outlook 2025 to 2035
Wetting Agent Market Size and Share Forecast Outlook 2025 to 2035
Wet Mix Plant Market Analysis and Opportunity Assessment in India Size and Share Forecast Outlook 2025 to 2035
Wet Process Equipment Market Size and Share Forecast Outlook 2025 to 2035
Wet Vacuum Pumps Market Size and Share Forecast Outlook 2025 to 2035
Wet Pet Food Market Analysis - Size, Share, and Forecast Outlook 2025 to 2035
Wet Vacuum Cleaner Market Size and Share Forecast Outlook 2025 to 2035
Wet Strength Paper Market Analysis - Size, Share, and Forecast Outlook 2025 to 2035
Wet Wipes Canister Market - Demand & Forecast 2025 to 2035
Wetsuit Market Trends - Growth, Demand & Forecast 2025 to 2035
Wet Wipes Market - Trends & Forecast 2025 to 2035
Wet Glue Labelling Machines Market
Wet Fertilizer Spreaders Market
Wet Ink Coding Machines Market
Burn-Wet Gas Abatement System Market Size and Share Forecast Outlook 2025 to 2035
Corn Wet Milling Services Market Size, Growth, and Forecast for 2025 to 2035
Canned Wet Cat Food Market Size and Share Forecast Outlook 2025 to 2035
Thermal-Wet Gas Abatement System Market Size and Share Forecast Outlook 2025 to 2035
Dry and Wet Wipes Market Size and Share Forecast Outlook 2025 to 2035

Thank you!
You will receive an email from our Business Development Manager. Please be sure to check your SPAM/JUNK folder too.
Chat With
MaRIA