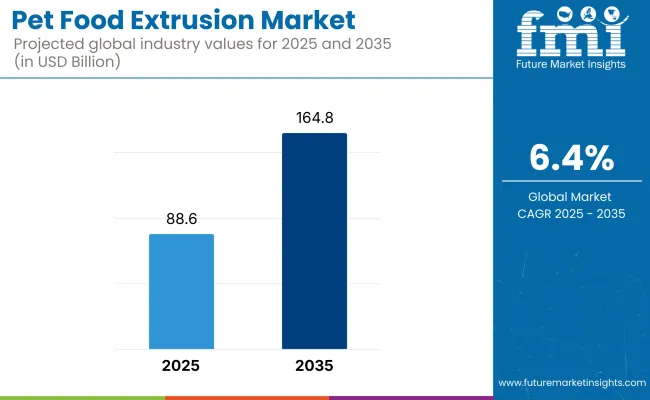
The pet food extrusion market is estimated to be worth USD 88.6 billion by 2025. It is anticipated to reach USD 164.8 billion by 2035, reflecting a CAGR of 6.4% over the assessment period 2025 to 2035.
The pet food extrusion business area is seeing a very positive change caused by the fact that more and more people are looking to have pet foods that contain high levels of nutrients, be easily digestible, and that are of high quality..
The extrusion tech is a significant factor in the pet food manufacturing process, as it facilitates the production of better quality kibbles, snacks, and special pet diets with better texture, shelf stability, and enrichment of nutritional area. The increasing importance given to pet health and wellness is the other factor that is contributing to the growth of the industry.
One of the crucial factors responsible for the growth of the industry is the demand for superior and functional pet food products. A lot of pet owners are now choosing the extruded pet food with probiotics, vitamins, and proteins with a higher quality that are typically associated with the good conditions of digestion, the immune system, and the general well-being of the pet. In addition, the demand for grain-free, hypoallergenic, and plant protein pet foods is inducing pet food extrusion manufacturers to search for new ideas.
The progress of the extrusion technology is also a strong point in the implementation of the newest extrusion techniques in the pet food industry. Twin-screw extrusion and high-moisture extrusion processes are operating for the purpose of ingredient mixing, nutrient retention, and product adjustment to be better. Further to that, manufacturers are taking the road to sustainability and eco-friendly processing methods to achieve waste reduction and improve energy efficiency during pet food production.
Developments of the extrusion processors, automation, and ingredient optimization play a major part in securing the stable and quality pet food products. The uniting of precision techniques of product processing with AI powered systems of quality control is allowing the processors to produce pet food formulations that are very tasty as well as easily digestible. Also, add-ons in co-extrusion technology co-exist with co-extrusion technology in order to enhance the range of treats and functional pet snacks with dual texture.
Though the industry has some hurdles such as the toxic material testing, the regulatory compliance related to pet food safety, and the reasons for concern for the environmental impact of pet food production. Besides, competition will be a factor from alternative processing methods such as freeze-drying and baking and this may adjust the industry situation.
The industry is experiencing consistent growth as a result of the factors such as growing pet ownership, pet humanization, and demand for premium nutrition. Dry pet food is still the leading segment owing to its affordability, longer shelf life, and ease of handling. Wet pet food is, however, on the rise based on pet owners' desire for high moisture and palatability.
Treats & snacks, functional and grain-free, are high in demand as pet parents are looking for rich yet healthy rewards for their pets. The veterinary diet category is on the rise due to greater awareness regarding pet health problems, such as obesity, gastrointestinal disorders, and allergies.
Consumers value ingredient transparency, natural ingredients, and sustainability in pet food products. Companies that use clean-label ingredients, new proteins (e.g., insect-based, plant-based), and sustainable packaging are gaining a competitive advantage in this changing industry.
The following table gives a comparative analysis of the difference in CAGR over six months between the base year (2023) and the current year (2024) for the world industry. This analysis identifies significant changes in performance and reflects revenue realization trends, thereby giving stakeholders a clearer picture of the growth path during the year. The first half of the year, or H1, is from January to June. The second half, H2, is composed of the months July to December.
| Particular | Value CAGR |
|---|---|
| H1 | 4.7% (2024 to 2034) |
| H2 | 5.4% (2024 to 2034) |
| H1 | 6.2% (2025 to 2035) |
| H2 | 6.9% (2025 to 2035) |
During the first half (H1) of the period 2024 to 2034, the company is anticipated to grow at a CAGR of 4.7%, and then at a greater rate of 5.4% in the second half (H2) of the same period. Shifting to the following period, from H1 2025 to H2 203, the CAGR is expected to go up to 6.2% in the first half and stay significantly high at 6.9% in the second half. In the first half (H1) the industry saw a growth of 15 BPS whereas in the second half (H2), the company saw a decline of 10 BPS.
Between 2020 and 2024, the industry saw impressive growth with increasing pet ownership and shifting consumer trends towards premium and high-quality pet nutrition. There was a big change during this period as pet owners began to be more aware of the requirement to provide balanced and specialized diets that met their pets' health needs.
Advances in extrusion technology allowed food companies to produce enormous ranges of pet foods with improved texture, nutrient retention, and flavor. Increasing demand for diet-specific targeting such as breed diets, age diets, and functional diets spurred additional investment in twin-screw extrusion and new coating technologies.
The industry too experienced dynamic growth due to increasing e-commerce impact, enabling high-quality and specialty extruded pet food products to extend their reach to a greater consumer base. The period between 2025 to 2035 is anticipated to usher in a new phase of technological advancement and consumer-driven innovation in the pet food extrusion sector.
Enhanced extrusion technologies will continue to redefine product formulations, enabling the creation of multi-textured and functionally enriched pet foods. Emerging scientific insights into pet health and nutrition will encourage the development of highly specialized extruded products addressing issues such as digestive health, cognitive function, and mobility support.
Increased application of artificial intelligence (AI) and machine learning in extrusion will enhance production efficiency with real-time adjustment for improved ingredient precision and reduced waste in processing. These advances in technology will enable faster reaction to evolving consumer demands, generating a competitive industry scenario.
Comparative Market Shift Analysis (2020 to 2024 vs. 2025 to 2035)
| 2020 to 2024 | 2025 to 2035 |
|---|---|
| Growing demand for higher-quality, grain-free, and protein-rich pet food. | AI personalized pet nutrition for health needs. |
| Introduction of alternative proteins like insect and plant-based. | Mass-scale production of lab-grown protein and cellular agriculture to meet sustainability. |
| Enhanced retention and digestibility of nutrients with high-end processing. | Smart extrusion with AI real-time optimization for precision nutrition. |
| Growing demand for clean-label foods and ethical sources. | Blockchain supply chain with end-to-end traceability and transparency. |
| AI-driven quality control to minimize waste and maximize production efficiency. | Completely automated smart manufacturing for customized pet food manufacturing. |
| Green and recyclable packaging materials shift. | Biodegradable and edible packaging options with zero waste. |
Unpredictable availability of raw materials is one of the foremost problems to be dealt with by the industry. For example, due to such things as different fruits and vegetables being largely neglected this year, the key ingredients grains and proteins have alternate prices and quantities, which reflect the change in production costs and supply chain situations. The companies have to acquire the raw materials from different sources and that is why they need to provide the best products with the addition of other ingredients.
The transition in tastes of consumers is another factor, whereas there is now a higher demand for pet food that is natural and without grains, as well as those with high protein content. The conventional extrusion pet food might have to deal with competition from other types of food such as raw, freeze-dried, and other processes. Production companies should innovate farmers to use insects, mushrooms, and other organic waste materials, which is far more efficient and cheaper.
The new technology which comes with equipment costs are also financial risks. Increasing the extrusion technology paradigm of efficiency, texture, and nutritional value means that there needs to be a lot of investments. The manufacturers have to manage costs while driving innovation and consider partnerships to fund exploratory research that will help them to lead in the industry.
The issue of sustainability, particularly with the pet food industry, requires action in terms of decreasing environmental damage. Areas of concern regarded with this issue are CO2 emissions, use of resources in the process of ingredient sourcing, and the packaging waste that necessitates collective actions from the industry. The companies need to use green ingredients, modify production practices, and initiate recyclable packaging schemes to meet their sustainability objectives and the consumer's expectations.
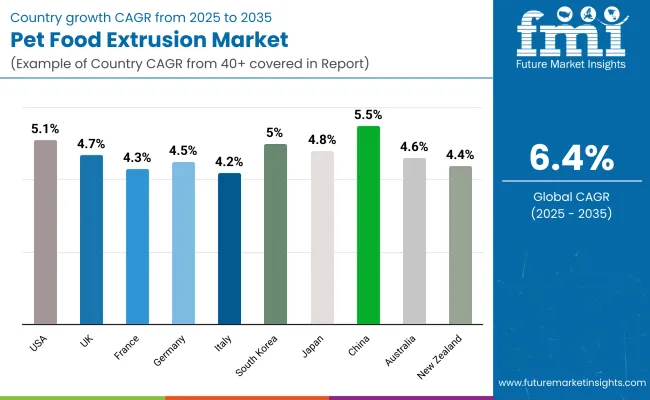
| Countries | CAGR (2025 to 2035) |
|---|---|
| USA | 5.1% |
| UK | 4.7% |
| France | 4.3% |
| Germany | 4.5% |
| Italy | 4.2% |
| South Korea | 5% |
| Japan | 4.8% |
| China | 5.5% |
| Australia | 4.6% |
| New Zealand | 4.4% |
The USA industry for pet food extrusion is characterized by cutting-edge production processes, highly educated consumers, and strict regulatory codes. Suppliers focus on enhanced nutrition profiles, sustainability, and specialty dietary requirements like grain-free, organic, and high-protein diets. Strong regulatory controls ensure ingredient transparency and consumers' trust ensues.
Direct-to-consumer businesses using e-commerce platforms are transforming distribution models, and high-quality extruded pet food is becoming increasingly available. Besides, increasing pet humanization trends are fueling demand for tailored nutrition addressing certain pet health conditions such as obesity, joint health as well as digestive health. Key players are strategically investing in precision extrusion technology to drive competitive advantage and brand loyalty.
The UK industry for pet food extrusion is dominated by increasing premium and natural pet food demand. Customers also like ingredients that have been sourced ethically and sustainable products, and this is leading manufacturers to adopt environmentally friendly production and packaging methods. The industry is also supported by increasing alternative protein sources, including insect-based and plant-based pet food.
Online retailing and subscription models are also on the rise, increasing customer access to customized nutritional solutions. Conformity to stringent European pet food legislation ensures consistent quality consistency, supporting industry expansion. In addition to that, UK extrusion producers are investing in better extrusion technologies to help maintain ingredient composition and nutritional content, another important driver of developing industry potential.
France's industry is expanding due to the increasing demand for gourmet and functional pet food. Pet owners continue to seek duplication diets, as in the case of human beings, and this has resulted in increased demand for products with high meat content and low-processing products. Robust pet food regulations within the country contribute to enhancing consumer confidence through transparency of raw material sourcing and manufacturing processes.
French firms lead the way for extruded diets that incorporate probiotics, prebiotics, and superfoods in their quest for complete pet health. The specialty pet food manufacturers are introducing artisanal styles to extrusion as well, targeting micro-segments of customers who are sensitive to freshness and quality. Growth in specialty stores and pet health store chains is also contributing to industry penetration.
Germany's extruded Pet Food Extrusion industry is backed up by its science-led nutritional and sustainability culture. Scientific formulas for certain conditions are in great demand from consumers in Germany, and as such, significant investment in advanced extrusion technology to enhance digestibility and nutrient bioavailability is occurring
The ever-increasing trend toward personalized feeding solutions, supplemented by vet-recommended recommendations, is also contributing to the strong growth trajectory of the industry. The industry in Italy is marked by its focus on Mediterranean pet cuisine with quality animal ingredients, fish, and plant nutrient incorporation.
Pet owners want artisanal pet food companies that emphasize natural, low-ingredient diets. The industry is experiencing growth in small-batch production with state-of-the-art extrusion technology that maintains ingredient integrity and taste. Moreover, Italy's cultural emphasis on pet companionship is driving demand for functional diets focused on longevity, joint ease, and overall wellness
South Korea's pet food extrusion business is changing rapidly due to its developing pet culture and rising disposable incomes. Consumers are in high demand for scientifically formulated and high-quality diets, and this has generated a huge demand for advanced extrusion technologies that ensure maximum retention of nutrients. Functional pet foods with the addition of probiotics, omega fatty acids, and digestive enzymes are becoming mainstream.
Local producers are also embracing high-pressure extrusion techniques to manufacture highly digestible, grain-free, and hypoallergenic products. The industry is also witnessing a surge in smart pet food products like customized meal plans and artificially intelligent feeding systems, fueling further growth. More pets and a greater focus on longevity-promoting diets are fueling
Japan's extrusion industry for pet food. Pet owners are insisting on high-density-nutrient foods with distinct health impacts, including joint mobility and cognitive support. Japanese manufacturers are leading precision extrusion processes that reduce the loss of nutrients and increase digestibility.
Expansion in functional treats like dental chews for oral care and probiotic-fortified snacks is also growing industry potential. Also fueling it is the high tendency of Japan to embrace technology. Accordingly, progress in smart feeding systems and customized diet formulations are further consolidating the country's leadership in new-generation pet nutrition.
China's industry is growing rapidly due to increased pet ownership and shifting consumer attitudes toward quality nutrition. Firms are leveraging advanced extrusion technology in order to stay in line with demand for high-quality, high-protein, and grain-free diets.
Extrusion operations are also being heavily financed as the industry requires uniformity and efficiency in mass production. International industry players are establishing strategic alliances with domestic firms so that foreign innovations and knowledge transfer can be localized. Ingredient transparency is becoming a consumer need, which is pushing manufacturers to create clean-label products based on safety and nutritional value.
The Australian industry is characterized by a high level of demand for natural and biologically appropriate foods. Consumers prefer raw-based extruded recipes that imitate primeval feeding patterns. Growing demand for single-protein and hypoallergenic food for pet food allergies is also being observed in the industry.
Sustainable sourcing of ingredients, keeping in mind ethically raised meats and alternative proteins, is one of the most powerful purchasing drivers. Convenience-focused consumption, which is being fueled by the rise of specialty pet food retail chain stores and meal subscription programs, is fuelling long-term industry growth.
New Zealand's extrusion Pet Food Extrusion industry benefits from its international status as a high-quality, pasture-based food-producing nation. Domestic pet owners insist on minimally processed foods produced locally to maintain freshness and nutritional integrity. Growing emphasis on holistic pet health is driving demand for functional foods with omega fatty acids, antioxidants, and natural additives.
Manufacturers and producer companies are becoming more delicate in their extrusion processes to preserve crucial nutrients without losing product palatability. Export-led growth and the growing boom of pet food produced in New Zealand and sold as a craze in international markets are also turning the nation into a high-value contributor to the global pet food sector.
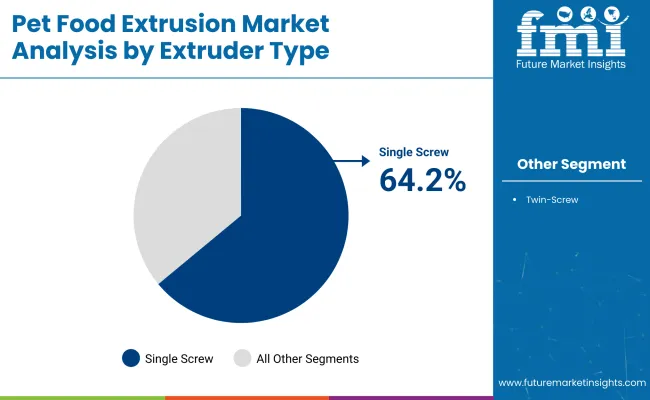
Operational Efficiency and Cost-Effective Processing Driving the Leadership of Single-Screw Extruders
| Segment | Value Share (2025) |
|---|---|
| Single Screw Extruder (By Extruder Type) | 64.2% |
The single screw extruder industry is estimated to command the largest share of the industry, with 64.2% of the industry share in 2025. The extruders have found widespread acceptance because they are cost-effective, energy-efficient, and easy to maintain, thus being the first choice of small and mid-sized pet food producers for the manufacture of dry kibble and treats.
Single screw extrusion is the most efficient technology to minimize energy consumption whilst ensuring ingredient integrity, and Bühler Group and Clextral now pioneer this technology. Bühler's PolyOne extruder is one example of a system that enhances digestibility and texture during pet food extrusion while still enabling manufacturers to remain cost competitive.
In contrast, the twin screw extruder segment is predicted to account for 35.8% of the industry. They allow better mixing, better handling of high-fat/high-moisture formulations, and more effective processing of specialty pet foods.
Extruders also find very extensive use in high protein, grain-free, and functional pet food products owing to their very close control over the final composition of the product, which includes blending ratios and texture. In this sector, Wenger Manufacturing and Baker Perkins are the top players, with Wenger's TX-85 twin-screw extruder revered for high-end, nutrient-rich pet food.
With the rising demand from pet owners for personalized, premium and nutritionally balanced pet food, producers are investing in advanced extrusion technology. The global industry is expected to grow on account of technological advancements that make ingredient processing easier, enhance the efficiency of digestion, and produce new constructs and processes connected to sustainability.
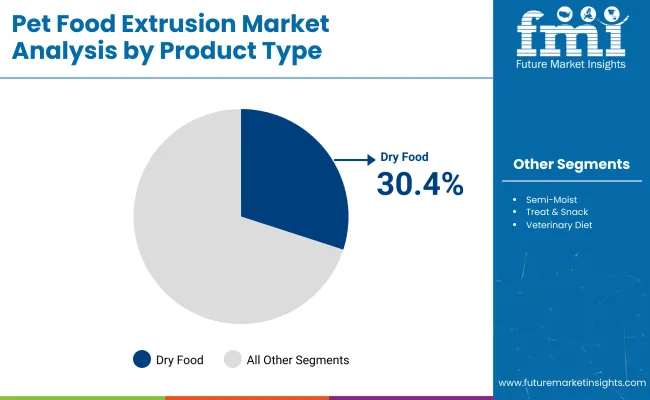
Dry Pet Food’s Versatile Appeal Driving Consistent Market Leadership
| Segment | Value Share (2025) |
|---|---|
| Dry Food (Product Type) | 30.4% |
The dry food (kibble) industry is forecast to account for the largest share of 30.4% in the industry by 2025. Kibble is still the favourite pet food format because it has a long shelf life, is economical, and is easy for pet owners to use. Moreover, innovations in extrusion technology have allowed manufacturers to add functional ingredients such as probiotics, omega fatty acids, and high-protein content to improve pet health.
Industry leaders like Mars Petcare (Royal Canin, Pedigree), Nestlé Purina, and Hill's Pet Nutrition have a strong grip on this industry, with continued investments in breed-specific, grain-free, and high-protein formulas.
The semi-moist pet food segment is likely to account for 25.6% of the industry. This segment is gaining popularity with its improved palatability, softer texture, and moisture retention. Thus, it is becoming the first choice among senior pets, small breeds, and dental-challenged pets.
Players such as Blue Buffalo (General Mills), Wellness Pet Company, and Freshpet are at the forefront of creating semi-moist pet foods with real meats, vegetables, and functional ingredients. Moreover, growing consumer interest in human-grade, preservative-free pet foods is fueling innovation in this category, resulting in the growth of refrigerated and fresh pet food.
As owners look for healthier, more customized nutrition for their pets, manufacturers are targeting high-quality ingredients, extrusion technology, and environmentally friendly manufacturing processes to satisfy changing industry requirements.
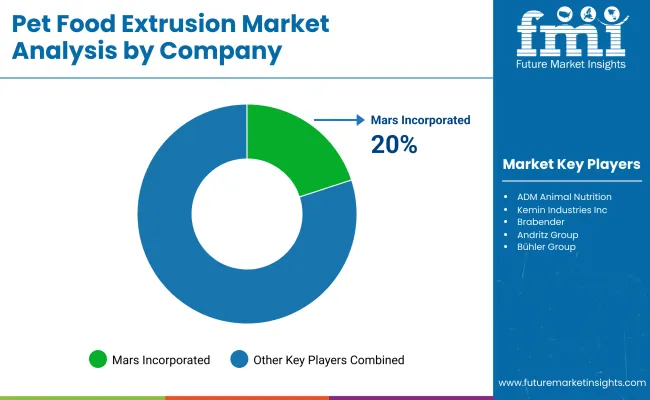
The pet food extrusion industry is innovative with a focus on innovation, new processing technology, and changing consumer trends. The industry is controlled by established brands like Mars, Incorporated, Nestlé Purina PetCare as well as Hill's Pet Nutrition, a Colgate-Palmolive company, through their existing brands, strong distribution networks, and ongoing R&D investment. The competitors are constantly optimizing their extrusion process for product quality, nutritional content, and palatability.
MegaCorp brands such as Royal Canin and Pedigree utilize advanced research to create effective pet food to the best advantage. Nestlé Purina PetCare utilizes advanced extrusion technology and expertise to manufacture high-protein therapeutic pet food to fulfill unique dietary needs, and Hill's Pet Nutrition strengthens its industry leadership in distributing veterinarian-recommended products with a health focus and targeted diets.
New buying behaviors are everything about sustainability and other or plant-based protein. Meatly and The Pack brought to industry "Chick Bites," the world's first commercially produced lab-grown meat pet treats, in February 2024.
Rolled out to a first UK pet store, the technology represents a trend toward sustainable pet food. Furthermore, technologies of extrusion machines are more efficient and accurate in their outputs. Brabender launched in August 2022 the B-TSE-S 30/40 Big Compounder, an electro-thermal twin-screw extruder with high performance that bridges the gap between pilot-scale production and laboratory research with greater flexibility and enhanced process control.
With increasingly enlightened pet owners, other companies will have to bear increased costs of replacement ingredients, green packaging, and new processing technologies. The competitive commercial industry will also be further transformed by more companies investing more in technology advancement and keeping up with changing consumer patterns.
Market Share Analysis by Company
| Company Name | Estimated Market Share (%) |
|---|---|
| Mars, Incorporated | 20-24% |
| Nestlé Purina PetCare | 18-22% |
| Hill’s Pet Nutrition | 12-16% |
| ADM Animal Nutrition | 8-12% |
| Kemin Industries, Inc. | 6-10% |
| Other Key Players | 26-34% |
| Company Name | Key Offerings/Activities |
|---|---|
| Mars, Incorporated | Produces Royal Canin and Pedigree, focusing on research-driven formulations for optimal pet nutrition. |
| Nestlé Purina PetCare | Innovates in extrusion technology to produce high-quality kibble and therapeutic pet foods. |
| Hill’s Pet Nutrition | Specializes in veterinarian-recommended diets with a strong emphasis on pet health and wellness. |
| ADM Animal Nutrition | Develops tailored animal nutrition solutions, including specialty feed ingredients for pets. |
| Kemin Industries, Inc. | Supplies functional ingredients and additives to enhance pet food nutrition and safety. |
Key Company Insights
Mars, Incorporated (20-24%)
A market leader leveraging cutting-edge research to optimize pet food formulations under brands like Royal Canin and Pedigree. Continues to enhance extrusion technology for improved nutritional value and digestibility.
Nestlé Purina PetCare (18-22%)
Innovates in high-protein and therapeutic pet food solutions using advanced extrusion techniques, aligning with growing consumer demand for premium pet diets.
Hill’s Pet Nutrition (12-16%)
Strengthens its position with veterinarian-recommended pet food, emphasizing science-backed formulations for specific dietary needs and health benefits.
ADM Animal Nutrition (8-12%)
Expands its portfolio with specialty feed ingredients, integrating nutritional science into pet food solutions for optimal health and performance.
Kemin Industries, Inc. (6-10%)
Focuses on functional ingredients and feed additives that improve pet food safety, shelf stability, and nutritional enhancement.
Other Key Players (26-34% Combined)
By product type, the industry has been categorized into dry pet food (kibble), semi-moist pet food, treats & snacks, and veterinary diets.
By animal type, the industry has been categorized into dog, cat, fish, birds, and others.
By ingredient type, the industry has been categorized into animal-based, plant-based, functional ingredients, and others.
By extruder type, the industry has been categorized into single-screw extrusion, and twin-screw extrusion.
By region, the industry analysis has been carried out in key countries of North America, Latin America, Western Europe, Eastern Europe, East Asia, South Asia & Pacific, Central Asia, Russia and Belarus, Balkan & Baltic Countries, and the Middle East & Africa.
The industry is expected to generate USD 88.6 billion in revenue by 2025.
The industry is projected to reach USD 164.8 billion by 2035, growing at a CAGR of 6.4%.
Key players include Mars, Incorporated, Nestlé Purina PetCare, Hill’s Pet Nutrition (Colgate-Palmolive), ADM Animal Nutrition, Kemin Industries, Inc., Brabender, Andritz Group, Bühler Group, Kahl Group, and Clextral.
North America and Europe, driven by increasing pet ownership, premiumization of pet food products, and advancements in extrusion technology for enhanced nutritional value.
Dry pet food dominates due to its convenience, longer shelf life, and high digestibility, making it a preferred choice for pet owners worldwide.


Full Research Suite comprises of:
Market outlook & trends analysis
Interviews & case studies
Strategic recommendations
Vendor profiles & capabilities analysis
5-year forecasts
8 regions and 60+ country-level data splits
Market segment data splits
12 months of continuous data updates
DELIVERED AS:
PDF EXCEL ONLINE
Pet Shampoo Market Size and Share Forecast Outlook 2025 to 2035
Pet Perfume Market Size and Share Forecast Outlook 2025 to 2035
Pet Tick and Flea Prevention Market Forecast and Outlook 2025 to 2035
Pet Hotel Market Forecast and Outlook 2025 to 2035
PET Vascular Prosthesis Market Size and Share Forecast Outlook 2025 to 2035
Petroleum Liquid Feedstock Market Size and Share Forecast Outlook 2025 to 2035
PET Stretch Blow Molding Machines Market Size and Share Forecast Outlook 2025 to 2035
PET Injectors Market Size and Share Forecast Outlook 2025 to 2035
PET Material Packaging Market Size and Share Forecast Outlook 2025 to 2035
Petri Dishes Market Size and Share Forecast Outlook 2025 to 2035
Petroleum And Fuel Dyes and Markers Market Size and Share Forecast Outlook 2025 to 2035
Petrochemical Pumps Market Size and Share Forecast Outlook 2025 to 2035
PET Dome Lids Market Size and Share Forecast Outlook 2025 to 2035
Pet Dietary Supplement Market Size and Share Forecast Outlook 2025 to 2035
PET Imaging Workflow Market Analysis - Size, Share, and Forecast Outlook 2025 to 2035
Petroleum Refinery Merchant Hydrogen Generation Market Size and Share Forecast Outlook 2025 to 2035
Pet Bird Health Market Size and Share Forecast Outlook 2025 to 2035
PET Film Coated Steel Coil Market Size and Share Forecast Outlook 2025 to 2035
Petroleum Refinery Hydrogen Market Size and Share Forecast Outlook 2025 to 2035
Pet Collagen Treats Market Analysis - Size and Share Forecast Outlook 2025 to 2035

Thank you!
You will receive an email from our Business Development Manager. Please be sure to check your SPAM/JUNK folder too.
Chat With
MaRIA