Oxytocic Pharmaceuticals Market
Market Insights on Oxytocic Pharmaceuticals covering sales outlook, demand forecast & up-to-date key trends
Oxytocic Pharmaceuticals Market by Indication (Abortion Induced Incomplete, Inevitable Abortion, Post-partum Haemorrhage, Labour Induction, Labour Arrest), Route of administration (Intravenous Infusion/Injection, Intramuscular Injection), Source of Origin, End-User & Region - Forecast to 2021-2031
Oxytocic Pharmaceuticals Market Snapshot
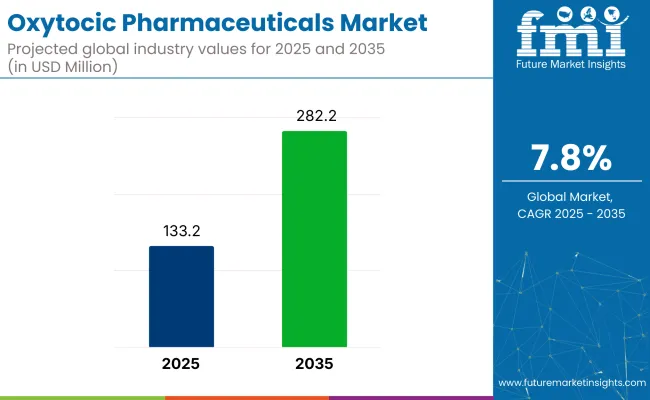
The oxytocic pharmaceuticals market revenue will total US$ 98.60 Mn in 2021, according to Future Market Insights (FMI). Exhibiting a CAGR of 7.74% between 2021 and 31, the market is expected to reach US$ 207.80 Mn by 2031.
Growth predictions remain positive for Europe due to rapid advancements in maternity care, rising government initiatives and growing number of elective caesareans. Germany will hold highest share in the Europe market, accounting for 31% of oxytocic pharmaceuticals sales in the region.
Let us know your requirement to get
100% FREE customization
Key Points Covered In Oxytocic pharmaceuticals Market Research
- Market Estimates And Forecast 2021 - 2031
- Key drivers and restraints impacting the market growth
- Segment wise, Country-wise, and Region-wise Analysis
- Competition Mapping and Benchmarking
- Brand share and Market share Analysis
- Key Product Innovations and Regulatory Climate
- COVID-19 Impact on Oxytocic Pharmaceuticals Market And How to Navigate
- Recommendations on Key Winning Strategies
Oxytocic Pharmaceuticals Market Future Outlook for 2021-2031 vs Historic Sales
Improvements in newer oxytocic pharmaceuticals through licensing agreements will drive sales of the market over the forecast period. Besides this, expanding usage of Antepartum oxytocin injection for improvement in uterine contractions will positively influence the demand outlook for oxytocic pharmaceuticals.
With competition expected to soar in the coming years, manufactures are focusing on adopting strategies such as new product innovations, agreements and expansions to enhance their product portfolio.
For instance, in 2020, Iconovo announced its new developmental agreement with Monash University for production of inhaled oxytocin ICOone. The agreement allows Monash a complete global right to employ ICOone with oxyyocin to inhibit postpartum haemorrhage in women giving birth. This development aids in enhancing Iconovo’s industrial experience and leverages to use its inhalation experience in the upcoming projects.
Coupled with this, mergers and acquisitions remain a key strategy among market players. For instance, in 2020, Tonix Pharmaceuticals announced a licensing deal with Katana Pharmaceuticals for augmenting the use of its intranasal potentiated oxytocin drug to cure metabolic disorders such as obesity, diabetes and insulin resistance.
Post-partum Haemorrhage to Lead Oxytocic Pharmaceuticals Market
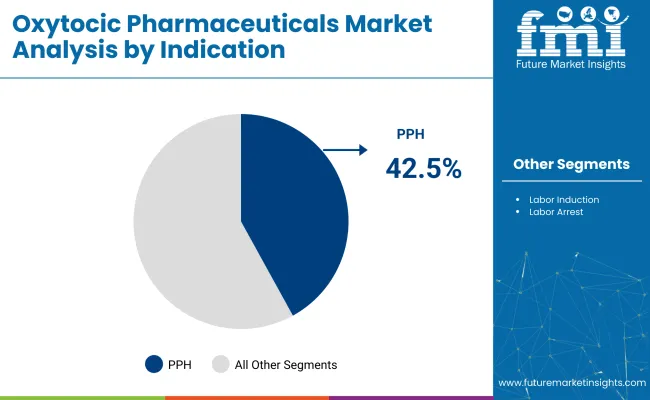
The post-partum haemorrhage segment was estimated to account for more than 75% market share of the global oxytocic pharmaceuticals market by the end of forecast period and is expected to gain more than 200 BPS in its market share by 2026. The post-partum haemorrhage segment is expected to register high Y-o-Y growth during the forecast period and is projected to remain the dominant segment during the forecast period.
Find your sweet spots for generating winning opportunities in this market.
Talk to AnalystLabour Induction during Childbirth Is Likely To Boost Post-Partum Haemorrhage Pharmaceuticals
Increasing childbirth using labour induction proves to be driving factor for the post-partum haemorrhage condition. There are certain situations – for instance, pre-eclampsia – where continuing the pregnancy is dangerous to the mother, or there are instances where women are uncomfortable, sore and tired. In such cases, labour is induced for convenience rather than medical reasons. However, labour induction increases the chances of post-partum haemorrhage.
According to the World Health Organization, the rate of labour induction in developing countries is lower; but in developed countries, the rates are relatively high, which is creating a positive impact on the post-partum haemorrhage segment. Another factor which is likely to fuel the revenue growth of the post-partum haemorrhage segment is the increasing age of mothers. Older and heavier women and women who are smokers are more likely to bleed heavily after delivery.
The ratio of getting pregnant after a certain age in life has increased in almost all the regions across the globe and this is creating robust development in the global oxytocic pharmaceuticals market, and specifically in the post-partum haemorrhage segment.
Demand in Africa Likely to Increase
The post-partum haemorrhage segment is the most attractive segment by indication in the North America oxytocic pharmaceuticals market, with a market attractiveness index of 3.9 estimated during the forecast period. In the Latin America region, the post-partum haemorrhage segment is estimated to reach a market attractiveness index of 3.7 due to increasing adolescent pregnancies. A majority of these pregnancies occur in Brazil in Latin America.
An increase in labour induction procedures in the region is responsible for positioning post-partum haemorrhage as the most attractive indication segment. The MEA region represents a higher prevalence of post-partum haemorrhage among all the regions owing to lack of proper nutrition to pregnant women. Africa’s contribution to the prevalence of post-partum haemorrhage in the MEA region is on the higher end, owing to a lack of healthcare infrastructure and awareness regarding pregnancy related aspects among African women.
Prevalence of post-partum haemorrhage is as high as 25.7% in African countries and 8.5% in Asian countries. In China, the post-partum haemorrhage segment is anticipated to record a market attractiveness index of 3.8 during the forecast period. A large pool of population and China’s altered single child policy to two children policy may likely increase the incidence of post-partum haemorrhage.

An unified Market Research Subscription Platform, built for today’s disparate research needs.
Opportunities in the Global Oxytocic Pharmaceuticals Market
Companies functioning in the global oxytocic pharmaceuticals market can reap larger market revenue from untapped markets in Asia and Africa where the prevalence of post-partum haemorrhage is on the higher side in comparison with other regions. Imparting awareness pertaining to pregnancy among the women in these regions can help create more market opportunities for existing as well as new entrants in the global oxytocic pharmaceuticals market.
The Report Segments the Market into Five Sections:
By Indication
- Abortion Induced Incomplete
- Inevitable Abortion
- Post-partum Haemorrhage
- Labour Induction
- Labour Arrest
By Route of administration
- Intravenous Infusion/Injection
- Intramuscular Injection
By Source of Origin
- Natural Oxytocin
- Synthetic Oxytocin Derivative
By End-User
- Hospitals
- Maternity clinics
By Region
- North America
- Latin America
- Western Europe
- Eastern Europe
- Asia Pacific Excluding Japan and China (APEJC)
- Japan
- China
- Middle East & Africa (MEA)
Frequently Asked Questions
The global oxytocic pharmaceuticals market will reach a valuation of US$ 98.60 Mn in 2021, rising at a CAGR of 7.74% between 2021 and 2031.
The oxytocic pharmaceuticals market exhibited growth at 3.60% CAGR between 2016 and 2020.
The combined market share of tier-1 players stood at 35-40% of the overall market.
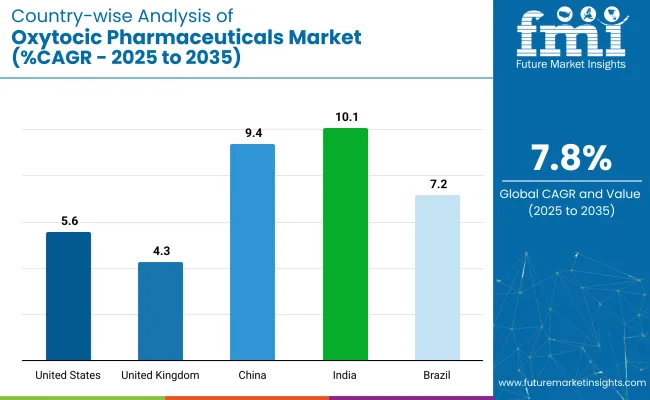
The demand for oxytocic pharmaceuticals is expected to grow at 9% in North America between 2021 and 2031.
In 2021, Germany will account for approximately 31% share of oxytocic pharmaceuticals in the European region.
China, India, U.S., Japan, and GCC Countries are driving demand for oxytocic
Increasing labour induction procedures, growing prevalence of PPH andprequalification from WHO will drive the sales of Oxytocic Pharmaceuticals.
Highly fragmented market and increasing licensing activities are key trendsobserved in the market.
Japan accounts for 2.6% share in the global oxytocic pharmaceuticalsmarket.
1. Executive Summary
2. Market Introduction
2.1. Market Definition
2.2. Market Taxonomy
3. Global Oxytocic Pharmaceuticals Market Analysis Scenario
3.1. Market Size (US$ Mn) and Forecast
3.1.1. Market Size and Y-o-Y Growth
3.1.2. Absolute $ Opportunity
4. Market Dynamics
4.1. Macro-economic Factors
4.2. Drivers
4.2.1. Supply Side
4.2.2. Demand Side
4.3. Restraints
4.4. Opportunity
4.5. Number of procedures by Indications per region (2015-2026)
4.6. Number of procedures by End User per region (2015-2026)
4.7. Number of cervical ripening procedures by region (2015)
4.8. Comparative drugs list other than Oxytocin
5. Global Oxytocic Pharmaceuticals Market Analysis and Forecasts, By Indication
5.1. Introduction
5.2. Basis Point Share (BPS) Analysis By Indication Type
5.3. Y-o-Y Growth Projections By Indication Type
5.4. Market Value Forecast By Indication, 2016–2026
5.4.1. Abortion Induced Incomplete
5.4.2. Inevitable Abortion
5.4.3. Postpartum Hemorrhage
5.4.4. Labor Induction
5.4.5. Labor Arrest
5.5. Market Attractiveness By Indication
6. Global Oxytocic Pharmaceuticals Market Analysis and Forecasts, By End User
6.1. Introduction
6.2. Basis Point Share (BPS) Analysis By End User
6.3. Y-o-Y Growth Projections By End User
6.4. Market Value Forecast By End User, 2016–2026
6.4.1. Hospitals
6.4.2. Maternity Clinics
6.5. Market Attractiveness By End User
7. Global Oxytocic Pharmaceuticals Market Analysis and Forecasts, By Route of Administration
7.1. Introduction
7.2. Basis Point Share (BPS) Analysis By Route of Administration
7.3. Y-o-Y Growth Projections By Route of Administration
7.4. Market Value Forecast By Route of Administration, 2016–2026
7.4.1. Intravenous Infusion/Injection
7.4.2. Intramuscular Injection
7.5. Market Attractiveness By Route of Administration
8. Global Oxytocic Pharmaceuticals Market Analysis and Forecasts, By Source of Origin
8.1. Introduction
8.2. Basis Point Share (BPS) Analysis By Source of Origin
8.3. Y-o-Y Growth Projections By Source of Origin
8.4. Market Value Forecast By Source of Origin, 2016–2026
8.4.1. Synthetic Oxytocin Derivative
8.4.2. Natural Oxytocin (Animal Pituitary Extract)
8.5. Market Attractiveness By Source of Origin
9. Global Oxytocic Pharmaceuticals Market Analysis and Forecasts, By Region
9.1. Basis Point Share (BPS) Analysis By Region
9.2. Y-o-Y Growth Projections By Region
9.3. Market Value Forecast By Region
9.3.1. North America
9.3.2. Latin America
9.3.3. Western Europe
9.3.4. Eastern Europe
9.3.5. China
9.3.6. Japan
9.3.7. APEJC
9.3.8. MEA
9.4. Market Attractiveness By Region
10. North America Oxytocic Pharmaceuticals Market Analysis and Forecast
10.1.Introduction
10.1.1. Basis Point Share (BPS) Analysis By Country
10.1.2. Y-o-Y Growth Projections By Country
10.2.Market Value Forecast By Indication, 2016–2026
10.2.1. Abortion Induced Incomplete
10.2.2. Inevitable Abortion
10.2.3. Postpartum Hemorrhage
10.2.4. Labor Induction
10.2.5. Labor Arrest
10.3.Market Value Forecast By End User, 2016–2026
10.3.1. Hospitals
10.3.2. Maternity Clinics
10.4.Market Value Forecast By Route of Administration, 2016–2026
10.4.1. Intravenous Infusion/Injection
10.4.2. Intramuscular Injection
10.5.Market Value Forecast By Source of Origin, 2016–2026
10.5.1. Synthetic Oxytocin Derivative
10.5.2. Natural Oxytocin (Animal Pituitary Extract)
10.6.Market Value Forecast By Country, 2016–2026
10.6.1. US
10.6.2. Canada
10.7.Market Attractiveness Analysis
10.7.1. By Indication
10.7.2. By End User
10.7.3. By Route of Administration
10.7.4. By Source of Origin
10.7.5. By Country
10.8. Prominent Trends
11. Latin America Oxytocic Pharmaceuticals Market Analysis and Forecast
11.1.Introduction
11.1.1. Basis Point Share (BPS) Analysis By Country
11.1.2. Y-o-Y Growth Projections By Country
11.2.Market Value Forecast By Indication, 2016–2026
11.2.1. Abortion Induced Incomplete
11.2.2. Inevitable Abortion
11.2.3. Postpartum Hemorrhage
11.2.4. Labor Induction
11.2.5. Labor Arrest
11.3.Market Value Forecast By End User, 2016–2026
11.3.1. Hospitals
11.3.2. Maternity Clinics
11.4.Market Value Forecast By Route of Administration, 2016–2026
11.4.1. Intravenous Infusion/Injection
11.4.2. Intramuscular Injection
11.5.Market Value Forecast By Source of Origin, 2016–2026
11.5.1. Synthetic Oxytocin Derivative
11.5.2. Natural Oxytocin (Animal Pituitary Extract)
11.6.Market Value Forecast By Country, 2016–2026
11.6.1. Brazil
11.6.2. Mexico
11.6.3. Rest of Latin America
11.7.Market Attractiveness Analysis
11.7.1. By Indication
11.7.2. By End User
11.7.3. By Route of Administration
11.7.4. By Source of Origin
11.7.5. By Country
11.8. Prominent Trends
12. Western Europe Oxytocic Pharmaceuticals Market Analysis and Forecast
12.1.Introduction
12.1.1. Basis Point Share (BPS) Analysis By Country
12.1.2. Y-o-Y Growth Projections By Country
12.2.Market Value Forecast By Indication, 2016–2026
12.2.1. Abortion Induced Incomplete
12.2.2. Inevitable Abortion
12.2.3. Postpartum Hemorrhage
12.2.4. Labor Induction
12.2.5. Labor Arrest
12.3.Market Value Forecast By End User, 2016–2026
12.3.1. Hospitals
12.3.2. Maternity Clinics
12.4.Market Value Forecast By Route of Administration, 2016–2026
12.4.1. Intravenous Infusion/Injection
12.4.2. Intramuscular Injection
12.5.Market Value Forecast By Source of Origin, 2016–2026
12.5.1. Synthetic Oxytocin Derivative
12.5.2. Natural Oxytocin (Animal Pituitary Extract)
12.6.Market Value Forecast By Country, 2016–2026
12.6.1. UK
12.6.2. France
12.6.3. Germany
12.6.4. Italy
12.6.5. Spain
12.6.6. Benelux
12.6.7. Rest of Western Europe
12.7.Market Attractiveness Analysis
12.7.1. By Indication
12.7.2. By End User
12.7.3. By Route of Administration
12.7.4. By Source of Origin
12.7.5. By Country
12.8. Prominent Trends
13. Eastern Europe Oxytocic Pharmaceuticals Market Analysis and Forecast
13.1.Introduction
13.1.1. Basis Point Share (BPS) Analysis By Country
13.1.2. Y-o-Y Growth Projections By Country
13.2.Market Value Forecast By Indication, 2016–2026
13.2.1. Abortion Induced Incomplete
13.2.2. Inevitable Abortion
13.2.3. Postpartum Hemorrhage
13.2.4. Labor Induction
13.2.5. Labor Arrest
13.3.Market Value Forecast By End User, 2016–2026
13.3.1. Hospitals
13.3.2. Maternity Clinics
13.4.Market Value Forecast By Route of Administration, 2016–2026
13.4.1. Intravenous Infusion/Injection
13.4.2. Intramuscular Injection
13.5.Market Value Forecast By Source of Origin, 2016–2026
13.5.1. Synthetic Oxytocin Derivative
13.5.2. Natural Oxytocin (Animal Pituitary Extract)
13.6.Market Value Forecast By Country, 2016–2026
13.6.1. Russia
13.6.2. Poland
13.6.3. Rest of Eastern Europe
13.7.Market Attractiveness Analysis
13.7.1. By Indication
13.7.2. By End User
13.7.3. By Route of Administration
13.7.4. By Source of Origin
13.7.5. By Country
13.8. Prominent Trends
14. APEJC Oxytocic Pharmaceuticals Market Analysis and Forecast
14.1.Introduction
14.1.1. Basis Point Share (BPS) Analysis By Country
14.1.2. Y-o-Y Growth Projections By Country
14.2.Market Value Forecast By Indication, 2016–2026
14.2.1. Abortion Induced Incomplete
14.2.2. Inevitable Abortion
14.2.3. Postpartum Hemorrhage
14.2.4. Labor Induction
14.2.5. Labor Arrest
14.3.Market Value Forecast By End User, 2016–2026
14.3.1. Hospitals
14.3.2. Maternity Clinics
14.4.Market Value Forecast By Route of Administration, 2016–2026
14.4.1. Intravenous Infusion/Injection
14.4.2. Intramuscular Injection
14.5.Market Value Forecast By Source of Origin, 2016–2026
14.5.1. Synthetic Oxytocin Derivative
14.5.2. Natural Oxytocin (Animal Pituitary Extract)
14.6.Market Value Forecast By Country, 2016–2026
14.6.1. India
14.6.2. Australia & New Zealand
14.6.3. ASEAN
14.6.4. Rest of APEJC
14.7.Market Attractiveness Analysis
14.7.1. By Indication
14.7.2. By End User
14.7.3. By Route of Administration
14.7.4. By Source of Origin
14.7.5. By Country
14.8. Prominent Trends
15. Japan Oxytocic Pharmaceuticals Market Analysis and Forecast
15.1.Introduction
15.1.1. Basis Point Share (BPS) Analysis By Country
15.1.2. Y-o-Y Growth Projections By Country
15.2.Market Value Forecast By Indication, 2016–2026
15.2.1. Abortion Induced Incomplete
15.2.2. Inevitable Abortion
15.2.3. Postpartum Hemorrhage
15.2.4. Labor Induction
15.2.5. Labor Arrest
15.3.Market Value Forecast By End User, 2016–2026
15.3.1. Hospitals
15.3.2. Maternity Clinics
15.4.Market Value Forecast By Route of Administration, 2016–2026
15.4.1. Intravenous Infusion/Injection
15.4.2. Intramuscular Injection
15.5.Market Value Forecast By Source of Origin, 2016–2026
15.5.1. Synthetic Oxytocin Derivative
15.5.2. Natural Oxytocin (Animal Pituitary Extract)
15.6.Market Attractiveness Analysis
15.6.1. By Indication
15.6.2. By End User
15.6.3. By Route of Administration
15.6.4. By Source of Origin
15.7. Prominent Trends
16. MEA Oxytocic Pharmaceuticals Market Analysis and Forecast
16.1.Introduction
16.1.1. Basis Point Share (BPS) Analysis By Country
16.1.2. Y-o-Y Growth Projections By Country
16.2.Market Value Forecast By Indication, 2016–2026
16.2.1. Abortion Induced Incomplete
16.2.2. Inevitable Abortion
16.2.3. Postpartum Hemorrhage
16.2.4. Labor Induction
16.2.5. Labor Arrest
16.3.Market Value Forecast By End User, 2016–2026
16.3.1. Hospitals
16.3.2. Maternity Clinics
16.4.Market Value Forecast By Route of Administration, 2016–2026
16.4.1. Intravenous Infusion/Injection
16.4.2. Intramuscular Injection
16.5.Market Value Forecast By Source of Origin, 2016–2026
16.5.1. Synthetic Oxytocin Derivative
16.5.2. Natural Oxytocin (Animal Pituitary Extract)
16.6.Market Value Forecast By Country, 2016–2026
16.6.1. GCC Countries
16.6.2. South Africa
16.6.3. Rest of MEA
16.7.Market Attractiveness Analysis
16.7.1. By Indication
16.7.2. By End User
16.7.3. By Route of Administration
16.7.4. By Source of Origin
16.7.5. By Country
16.8. Prominent Trends
17. China Oxytocic Pharmaceuticals Market Analysis and Forecast
17.1.Introduction
17.1.1. Basis Point Share (BPS) Analysis By Country
17.1.2. Y-o-Y Growth Projections By Country
17.2.Market Value Forecast By Indication, 2016–2026
17.2.1. Abortion Induced Incomplete
17.2.2. Inevitable Abortion
17.2.3. Postpartum Hemorrhage
17.2.4. Labor Induction
17.2.5. Labor Arrest
17.3.Market Value Forecast By End User, 2016–2026
17.3.1. Hospitals
17.3.2. Maternity Clinics
17.4.Market Value Forecast By Route of Administration, 2016–2026
17.4.1. Intravenous Infusion/Injection
17.4.2. Intramuscular Injection
17.5.Market Value Forecast By Source of Origin, 2016–2026
17.5.1. Synthetic Oxytocin Derivative
17.5.2. Natural Oxytocin (Animal Pituitary Extract)
17.6.Market Attractiveness Analysis
17.6.1. By Indication
17.6.2. By End User
17.6.3. By Route of Administration
17.6.4. By Source of Origin
17.7. Prominent Trends
18. Competition Landscape
18.1. Competition Dashboard
18.2. Company Profiles (Details – Overview, Financials, Strategy, Recent Developments)
18.2.1. Fresenius Kaci AG
18.2.2. Biofutura SpA
18.2.3. Baxter Healthcare Corporation
18.2.4. Pfizer Inc.
18.2.5. Ferring B.V.
18.2.6. Novartis AG
18.2.7. Teva Pharmaceutical Industries Ltd.
19. Assumptions and Acronyms Used
20. Research Methodology
Let us know your requirement to get
100% FREE customization
Table 1: Global Oxytocic Pharmaceuticals Market Volume (In Thousands) Analysis and Forecast by Region, 2015–2026
Table 2: Global Oxytocic Pharmaceuticals Market Volume (In Thousands) Analysis and Forecast by End User, 2015–2026
Table 3: North America Oxytocic Pharmaceuticals Market Volume (In Thousands) Analysis and Forecast by Region, 2015–2026
Table 4: North America Oxytocic Pharmaceuticals Market Volume (In Thousands) Analysis and Forecast by End User, 2015–2026
Table 5: Latin America Oxytocic Pharmaceuticals Market Volume (In Thousands) Analysis and Forecast by Region, 2015–2026
Table 6: Latin America Oxytocic Pharmaceuticals Market Volume (In Thousands) Analysis and Forecast by End User, 2015–2026
Table 7: Western Europe Oxytocic Pharmaceuticals Market Volume (In Thousands) Analysis and Forecast by Region, 2015–2026
Table 8: Western Europe Oxytocic Pharmaceuticals Market Volume (In Thousands) Analysis and Forecast by End User, 2015–2026
Table 9: Eastern Europe Oxytocic Pharmaceuticals Market Volume (In Thousands) Analysis and Forecast by Region, 2015–2026
Table 10: Eastern Europe Oxytocic Pharmaceuticals Market Volume (In Thousands) Analysis and Forecast by End User, 2015–2026
Table 11: China Oxytocic Pharmaceuticals Market Volume (In Thousands) Analysis and Forecast by Region, 2015–2026
Table 12: China Oxytocic Pharmaceuticals Market Volume (In Thousands) Analysis and Forecast by End User, 2015–2026
Table 13: Japan Oxytocic Pharmaceuticals Market Volume (In Thousands) Analysis and Forecast by Region, 2015–2026
Table 14: Japan Oxytocic Pharmaceuticals Market Volume (In Thousands) Analysis and Forecast by End User, 2015–2026
Table 15: APEJC Oxytocic Pharmaceuticals Market Volume (In Thousands) Analysis and Forecast by Region, 2015–2026
Table 16: APEJC Oxytocic Pharmaceuticals Market Volume (In Thousands) Analysis and Forecast by End User, 2015–2026
Table 17: MEA Oxytocic Pharmaceuticals Market Volume (In Thousands) Analysis and Forecast by Region, 2015–2026
Table 18: MEA Oxytocic Pharmaceuticals Market Volume (In Thousands) Analysis and Forecast by End User, 2015–2026
Table 19: Global Cervical Ripening Procedures Market Volume (In Thousands) Analysis by Region, 2015
Table 20: Comparative drugs for controlling PPH conditions
Table 21: Comparative drugs for controlling PPH conditions
Table 22: Comparative drugs for controlling PPH conditions
Table 23: Comparative drugs for controlling PPH conditions
Table 24: Comparative drugs for controlling PPH conditions
Table 25: Global Oxytocic Pharmaceuticals Market Value (US$ Mn) Analysis and Forecast by Indication, 2016 – 2026
Table 26: Global Oxytocic Pharmaceuticals Market Value (US$ Mn) Analysis and Forecast by Route of Administration, 2016 – 2026
Table 27: Global Oxytocic Pharmaceuticals Market Value (US$ Mn) Analysis and Forecast by Source of Origin, 2015 – 2026
Table 28: Global Oxytocic Pharmaceuticals Market Value (US$ Mn) Analysis and Forecast by End User, 2015–2026
Table 29: Global Oxytocic Pharmaceuticals Market Value (US$ Mn) Analysis and Forecast by Region, 2015–2026
Table 30: North America Oxytocic Pharmaceuticals Market Value (US$ Mn) Analysis and Forecast by Country, 2015–2026
Table 31: North America Oxytocic Pharmaceuticals Market Value (US$ Mn) Analysis and Forecast by Indication, 2015 – 2026
Table 32: North America Oxytocic Pharmaceuticals Market Value (US$ Mn) Analysis and Forecast by Route of Administration, 2015 – 2026
Table 33: North America Oxytocic Pharmaceuticals Market Value (US$ Mn) Analysis and Forecast by Source of Origin, 2015 – 2026
Table 34: North America Oxytocic Pharmaceuticals Market Value (US$ Mn) Analysis and Forecast by End User, 2015–2026
Table 35: Latin America Oxytocic Pharmaceuticals Market Value (US$ Mn) Analysis and Forecast by Country, 2015–2026
Table 36: Latin America Oxytocic Pharmaceuticals Market Value (US$ Mn) Analysis and Forecast by Indication, 2015 – 2026
Table 37: Latin America Oxytocic Pharmaceuticals Market Value (US$ Mn) Analysis and Forecast by Route of Administration, 2015 – 2026
Table 38: Latin America Oxytocic Pharmaceuticals Market Value (US$ Mn) Analysis and Forecast by Source of Origin, 2015 – 2026
Table 39: Latin America Oxytocic Pharmaceuticals Market Value (US$ Mn) Analysis and Forecast by End User, 2015–2026
Table 40: Western Europe Oxytocic Pharmaceuticals Market Value (US$ Mn) Analysis and Forecast by Country, 2015–2026
Table 41: Western Europe Oxytocic Pharmaceuticals Market Value (US$ Mn) Analysis and Forecast by Indication, 2015 – 2026
Table 42: Western Europe Oxytocic Pharmaceuticals Market Value (US$ Mn) Analysis and Forecast by Route of Administration, 2015 – 2026
Table 43: Western Europe Oxytocic Pharmaceuticals Market Value (US$ Mn) Analysis and Forecast by Source of Origin, 2015 – 2026
Table 44: Western Europe Oxytocic Pharmaceuticals Market Value (US$ Mn) Analysis and Forecast by End User, 2015–2026
Table 45: Eastern Europe Oxytocic Pharmaceuticals Market Value (US$ Mn) Analysis and Forecast by Country, 2015–2026
Table 46: Eastern Europe Oxytocic Pharmaceuticals Market Value (US$ Mn) Analysis and Forecast by Indication, 2015 – 2026
Table 47: Eastern Europe Oxytocic Pharmaceuticals Market Value (US$ Mn) Analysis and Forecast by Route of Administration, 2015 – 2026
Table 48: Eastern Europe Oxytocic Pharmaceuticals Market Value (US$ Mn) Analysis and Forecast by Source of Origin, 2015 – 2026
Table 49: Eastern Europe Oxytocic Pharmaceuticals Market Value (US$ Mn) Analysis and Forecast by End User, 2015–2026
Table 50: China Oxytocic Pharmaceuticals Market Value (US$ Mn) Analysis and Forecast by Indication, 2015 – 2026
Table 51: China Oxytocic Pharmaceuticals Market Value (US$ Mn) Analysis and Forecast by Route of Administration, 2015 – 2026
Table 52: China Oxytocic Pharmaceuticals Market Value (US$ Mn) Analysis and Forecast by Source of Origin, 2015 – 2026
Table 53: China Oxytocic Pharmaceuticals Market Value (US$ Mn) Analysis and Forecast by End User, 2015–2026
Table 54: Japan Oxytocic Pharmaceuticals Market Value (US$ Mn) Analysis and Forecast by Indication, 2015 – 2026
Table 55: Japan Oxytocic Pharmaceuticals Market Value (US$ Mn) Analysis and Forecast by Route of Administration, 2015 – 2026
Table 56: Japan Oxytocic Pharmaceuticals Market Value (US$ Mn) Analysis and Forecast by Source of Origin, 2015 – 2026
Table 57: Japan Oxytocic Pharmaceuticals Market Value (US$ Mn) Analysis and Forecast by End User, 2015–2026
Table 58: APEJC Oxytocic Pharmaceuticals Market Value (US$ Mn) Analysis and Forecast by Country, 2015–2026
Table 59: APEJC Oxytocic Pharmaceuticals Market Value (US$ Mn) Analysis and Forecast by Indication, 2015 – 2026
Table 60: APEJC Oxytocic Pharmaceuticals Market Value (US$ Mn) Analysis and Forecast by Route of Administration, 2015 – 2026
Table 61: APEJC Oxytocic Pharmaceuticals Market Value (US$ Mn) Analysis and Forecast by Source of Origin, 2015 – 2026
Table 62: APEJC Oxytocic Pharmaceuticals Market Value (US$ Mn) Analysis and Forecast by Source of Origin, 2015 – 2026
Table 63: APEJC Oxytocic Pharmaceuticals Market Value (US$ Mn) Analysis and Forecast by End User, 2015–2026
Table 64: MEA Oxytocic Pharmaceuticals Market Value (US$ Mn) Analysis and Forecast by Country, 2015–2026
Table 65: MEA Oxytocic Pharmaceuticals Market Value (US$ Mn) Analysis and Forecast by Indication, 2015 – 2026
Table 66: MEA Oxytocic Pharmaceuticals Market Value (US$ Mn) Analysis and Forecast by Route of Administration, 2015 – 2026
Table 67: MEA Oxytocic Pharmaceuticals Market Value (US$ Mn) Analysis and Forecast by Source of Origin, 2015 – 2026
Table 68: MEA Oxytocic Pharmaceuticals Market Value (US$ Mn) Analysis and Forecast by End User, 2015–2026
Find your sweet spots for generating winning opportunities in this market.
Talk to AnalystFigure 01: Global Oxytocic Pharmaceuticals Market Value Share By, Indication, 2016
Figure 02: Global Oxytocic Pharmaceuticals Market Value Share By, Source of Origin, 2016
Figure 03: Global Oxytocic Pharmaceuticals Market Value Share By, Route of Administration, 2016
Figure 04: Global Oxytocic Pharmaceuticals Market Value Share By, Region, 2016
Figure 05: Global Oxytocic Pharmaceuticals Market Value (US$ Mn) Forecast, 2015–2026
Figure 06: Global Oxytocic Pharmaceuticals Market Absolute $ Opportunity, 2015–2026
Figure 07: Global Oxytocic Pharmaceuticals Market Y-o-Y Growth, 2015–2026
Figure 08: Global Oxytocic Pharmaceuticals Market Share Analysis (%) By Indication, 2016 - 2026
Figure 09: Global Oxytocic Pharmaceuticals Market Y-o-Y Growth (%) By Indication, 2016–2026
Figure 10: Global Oxytocic Pharmaceuticals Market Absolute $ Opportunity (US$ Mn) by abortion induced incomplete Segment, 2016 – 2026
Figure 11: Global Oxytocic Pharmaceuticals Market Absolute $ Opportunity (US$ Mn) by inevitable abortion Segment, 2015 – 2026
Figure 12: Global Oxytocic Pharmaceuticals Market Absolute $ Opportunity (US$ Mn) by post-partum hemorrhage Segment, 2015 – 2026
Figure 13: Global Oxytocic Pharmaceuticals Market Absolute $ Opportunity (US$ Mn) by labor induction Segment, 2015 – 2026
Figure 14: Global Oxytocic Pharmaceuticals Market Absolute $ Opportunity (US$ Mn) by labor arrest Segment, 2015 – 2026
Figure 15: Global Oxytocic Pharmaceuticals Market Absolute $ Opportunity (US$ Mn) by labor arrest Segment, 2015 – 2026
Figure 16: Global Oxytocic Pharmaceuticals Market Attractiveness Analysis by Indication, 2016–2026
Figure 17: Global Oxytocic Pharmaceuticals Market Share Analysis (%) By Route of Administration, 2016- 2026
Figure 18: Global Oxytocic Pharmaceuticals Market Y-o-Y Growth (%) By Route of Administration, 2016–2026
Figure 19: Global Oxytocic Pharmaceuticals Market Absolute $ Opportunity (US$ Mn) By Intramuscular
Figure 20: Global Oxytocic Pharmaceuticals Market Absolute $ Opportunity (US$ Mn) By Intravenous Injection/Infusion Segment, 2015 – 2026
Figure 21: Global Oxytocic Pharmaceuticals Market Share Analysis (%) By Source of Origin, 2016- 2026
Figure 22: Global Oxytocic Pharmaceuticals Market Y-o-Y Growth (%) By Source of Origin, 2016–2026
Figure 23: Global Oxytocic Pharmaceuticals Market Absolute $ Opportunity (US$ Mn) By Synthetic Oxytocin, 2015 – 2026
Figure 24: Global Oxytocic Pharmaceuticals Market Absolute $ Opportunity (US$ Mn) By Natural Oxytocin Segment, 2015 – 2026
Figure 25: Global Oxytocic Pharmaceuticals Market Attractiveness Analysis by Source of Origin, 2016–2026
Figure 26: Global Oxytocic Pharmaceuticals Market Share Analysis (%) By End User, 2016, 2026
Figure 27: Global Oxytocic Pharmaceuticals Market Y-o-Y Growth (%) By End User, 2015–2026
Figure 28: Global Oxytocic Pharmaceuticals Market Absolute $ Opportunity (US$ Mn) By Hospitals Segment, 2015 – 2026
Figure 29: Global Oxytocic Pharmaceuticals Market Absolute $ Opportunity (US$ Mn) By Maternity Centers Segment, 2015 – 2026
Figure 30: Global Oxytocic Pharmaceuticals Market Attractiveness Analysis by End User, 2016–2026
Figure 31: Global Oxytocic Pharmaceuticals Market Share Analysis (%) By Region, 2016, 2026
Figure 32: Global Oxytocic Pharmaceuticals Market Y-o-Y Growth (%) By Region, 2015–2026
Figure 33: North America Oxytocic Pharmaceuticals Market Absolute $ Opportunity (US$ Mn), 2015 – 2026
Figure 34: Latin America Oxytocic Pharmaceuticals Market Absolute $ Opportunity (US$ Mn), 2015 – 2026
Figure 35: Western Europe Oxytocic Pharmaceuticals Market Absolute $ Opportunity (US$ Mn), 2015 – 2026
Figure 36: Eastern Europe Oxytocic Pharmaceuticals Market Absolute $ Opportunity (US$ Mn), 2015 – 2026
Figure 37: APEJC Oxytocic Pharmaceuticals Market Absolute $ Opportunity (US$ Mn), 2015 – 2026
Figure 38: Japan Oxytocic Pharmaceuticals Market Absolute $ Opportunity (US$ Mn), 2015 – 2026
Figure 39: MEA Oxytocic Pharmaceuticals Market Absolute $ Opportunity (US$ Mn), 2015 – 2026
Figure 40: China Oxytocic Pharmaceuticals Market Absolute $ Opportunity (US$ Mn), 2015 – 2026
Figure 41: Global Oxytocic Pharmaceuticals Market Attractiveness Analysis by Region, 2016–2026
Figure 42: North America Oxytocic Pharmaceuticals Market Share Analysis (%) By Country, 2016, 2026
Figure 43: North America Oxytocic Pharmaceuticals Market Y-o-Y Growth (%) By Country, 2015–2026
Figure 44: The U.S. Oxytocic Pharmaceuticals Market Absolute $ Opportunity (US$ Mn), 2015 – 2026
Figure 45: Canada Oxytocic Pharmaceuticals Market Absolute $ Opportunity (US$ Mn), 2015 – 2026
Figure 46: North America Oxytocic Pharmaceuticals Market Attractiveness Analysis by Country, 2016 – 2026
Figure 47: North America Oxytocic Pharmaceuticals Market Attractiveness Analysis by Indication, 2016 – 2026
Figure 48: North America Oxytocic Pharmaceuticals Market Attractiveness Analysis by Source of Origin, 2016 – 2026
Figure 49: North America Oxytocic Pharmaceuticals Market Attractiveness Analysis by End User, 2016 – 2026
Figure 50: Latin America Oxytocic Pharmaceuticals Market Share Analysis (%) By Country, 2016, 2026
Figure 51: Latin America Oxytocic Pharmaceuticals Market Y-o-Y Growth (%) By Country, 2015–2026
Figure 52: The Brazil Oxytocic Pharmaceuticals Market Absolute $ Opportunity (US$ Mn), 2015 – 2026
Figure 53: Mexico Oxytocic Pharmaceuticals Market Absolute $ Opportunity (US$ Mn), 2015 – 2026
Figure 54: The Rest of Latin America Oxytocic Pharmaceuticals Market Absolute $ Opportunity (US$ Mn), 2015 – 2026
Figure 55: Latin America Oxytocic Pharmaceuticals Market Attractiveness Analysis by Country, 2016 – 2026
Figure 56: Latin America Oxytocic Pharmaceuticals Market Attractiveness Analysis by Indication, 2016 – 2026
Figure 57: Latin America Oxytocic Pharmaceuticals Market Attractiveness Analysis by Source of Origin, 2016 – 2026
Figure 58: Latin America Oxytocic Pharmaceuticals Market Attractiveness Analysis by End User, 2016 – 2026
Figure 59: Western Europe Oxytocic Pharmaceuticals Market Share Analysis (%) By Country, 2016, 2026
Figure 60: Western Europe Oxytocic Pharmaceuticals Market Y-o-Y Growth (%) By Country, 2015–2026
Figure 61: Germany Oxytocic Pharmaceuticals Market Absolute $ Opportunity (US$ Mn), 2015 – 2026
Figure 62: France Oxytocic Pharmaceuticals Market Absolute $ Opportunity (US$ Mn), 2015 – 2026
Figure 63: Italy Oxytocic Pharmaceuticals Market Absolute $ Opportunity (US$ Mn), 2015 – 2026
Figure 64: Spain Oxytocic Pharmaceuticals Market Absolute $ Opportunity (US$ Mn), 2015 – 2026
Figure 65: U.K. Oxytocic Pharmaceuticals Market Absolute $ Opportunity (US$ Mn), 2015 – 2026
Figure 66: BENELUX Oxytocic Pharmaceuticals Market Absolute $ Opportunity (US$ Mn), 2015 – 2026
Figure 67: The Rest of Western Europe Oxytocic Pharmaceuticals Market Absolute $ Opportunity (US$ Mn), 2015 – 2026
Figure 68: Western Europe Oxytocic Pharmaceuticals Market Attractiveness Analysis by Country, 2016 – 2026
Figure 69: Western Europe Oxytocic Pharmaceuticals Market Attractiveness Analysis by Indication, 2016 – 2026
Figure 70: Western Europe Oxytocic Pharmaceuticals Market Attractiveness Analysis by Source of Origin, 2016 – 2026
Figure 71: Western Europe Oxytocic Pharmaceuticals Market Attractiveness Analysis by End User, 2016 – 2026
Figure 72: Eastern Europe Oxytocic Pharmaceuticals Market Share Analysis (%) By Country, 2016, 2026
Figure 73: Eastern Europe Oxytocic Pharmaceuticals Market Y-o-Y Growth (%) By Country, 2015–2026
Figure 74: Russia Oxytocic Pharmaceuticals Market Absolute $ Opportunity (US$ Mn), 2015 – 2026
Figure 75: Poland Oxytocic Pharmaceuticals Market Absolute $ Opportunity (US$ Mn), 2015 – 2026
Figure 76: The Rest of Eastern Europe Oxytocic Pharmaceuticals Market Absolute $ Opportunity (US$ Mn), 2015 – 2026
Figure 77: Eastern Europe Oxytocic Pharmaceuticals Market Attractiveness Analysis by Country, 2016 – 2026
Figure 78: Eastern Europe Oxytocic Pharmaceuticals Market Attractiveness Analysis by Indication, 2016 – 2026
Figure 79: Eastern Europe Oxytocic Pharmaceuticals Market Attractiveness Analysis by Source of Origin, 2016 – 2026
Figure 80: Eastern Europe Oxytocic Pharmaceuticals Market Attractiveness Analysis by End User, 2016 – 2026
Figure 81: China Oxytocic Pharmaceuticals Market Attractiveness Analysis by Route of Administration, 2016 – 2026
Figure 82: China Oxytocic Pharmaceuticals Market Attractiveness Analysis by Indication, 2016 – 2026
Figure 83: China Oxytocic Pharmaceuticals Market Attractiveness Analysis by Source of Origin, 2016 – 2026
Figure 84: China Oxytocic Pharmaceuticals Market Attractiveness Analysis by End User, 2016 – 2026
Figure 85: Japan Oxytocic Pharmaceuticals Market Attractiveness Analysis by Route of Administration, 2016 – 2026
Figure 86: Japan Oxytocic Pharmaceuticals Market Attractiveness Analysis by Indication, 2016 – 2026
Figure 87: Japan Oxytocic Pharmaceuticals Market Attractiveness Analysis by Source of Origin, 2016 – 2026
Figure 88: Japan Oxytocic Pharmaceuticals Market Attractiveness Analysis by End User, 2016 – 2026
Figure 89: APEJC Oxytocic Pharmaceuticals Market Share Analysis (%) By Country, 2016, 2026
Figure 90: APEJC Oxytocic Pharmaceuticals Market Y-o-Y Growth (%) By Country, 2015–2026
Figure 91: India Oxytocic Pharmaceuticals Market Absolute $ Opportunity (US$ Mn), 2015 – 2026
Figure 92: ASEAN Oxytocic Pharmaceuticals Market Absolute $ Opportunity (US$ Mn), 2015 – 2026
Figure 93: Australia & New Zealand Oxytocic Pharmaceuticals Market Absolute $ Opportunity (US$ Mn), 2015 – 2026
Figure 94: Rest of APEJC Oxytocic Pharmaceuticals Market Absolute $ Opportunity (US$ Mn), 2015 – 2026
Figure 95: APEJC Oxytocic Pharmaceuticals Market Attractiveness Analysis by Country, 2016 – 2026
Figure 96: APEJC Oxytocic Pharmaceuticals Market Attractiveness Analysis by Indication, 2016 – 2026
Figure 97: APEJC Oxytocic Pharmaceuticals Market Attractiveness Analysis by Source of Origin, 2016 – 2026
Figure 98: APEJC Oxytocic Pharmaceuticals Market Attractiveness Analysis by End User, 2016 – 2026
Figure 99: MEA Oxytocic Pharmaceuticals Market Share Analysis (%) By Country, 2016, 2026
Figure 100: MEA Oxytocic Pharmaceuticals Market Y-o-Y Growth (%) By Country, 2015–2026
Figure 101: GCC Countries Oxytocic Pharmaceuticals Market Absolute $ Opportunity (US$ Mn), 2015 – 2026
Figure 102: South Africa Oxytocic Pharmaceuticals Market Absolute $ Opportunity (US$ Mn), 2015 – 2026
Figure 103: The Rest of MEA Oxytocic Pharmaceuticals Market Absolute $ Opportunity (US$ Mn), 2015 – 2026
Figure 104: MEA Oxytocic Pharmaceuticals Market Attractiveness Analysis by Country, 2016 – 2026
Figure 105: MEA Oxytocic Pharmaceuticals Market Attractiveness Analysis by Indication, 2016 – 2026
Figure 106: MEA Oxytocic Pharmaceuticals Market Attractiveness Analysis by Source of Origin, 2016 – 2026
Figure 107: MEA Oxytocic Pharmaceuticals Market Attractiveness Analysis by End User, 2016 – 2026
Need specific information?
Request CustomizationExplore Healthcare Insights
View Reports