Reports

- Global Locations -

Headquarters

Future Market Insights, Inc.

Christiana Corporate, 200
Continental Drive, Suite 401,
Newark, Delaware - 19713,
United States

T: +1-845-579-5705

Americas

Future Market Insights, Inc.

616 Corporate Way, Suite 2-9018,
Valley Cottage, NY 10989, United States

T: +1-347-918-3531

MEA

Future Market Insights

1602-6 Jumeirah Bay X2 Tower, Plot No: JLT-PH2-X2A,
Jumeirah Lakes Towers, Dubai,
United Arab Emirates

Europe

Future Market Insights

3rd Floor, 207 Regent Street,
W1B 3HH London
United Kingdom

T: + 44 (0) 20 8123 9659
D: +44 (0) 20 3287 4268

Asia Pacific

Future Market Insights

IndiaLand Global Tech Park, Unit UG-1, Behind Grand HighStreet, Phase 1, Hinjawadi, MH, Pune – 411057, India

Account-based Advertising Software Market Outlook (2023 to 2033)

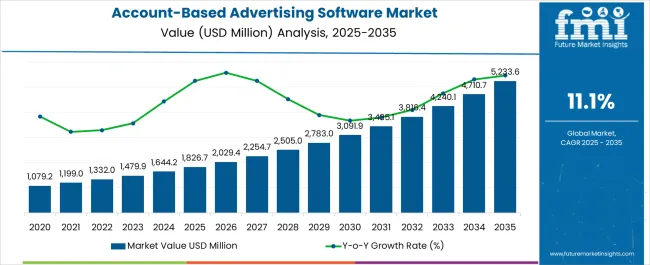
The global account-based advertising software market was valued at around US$ 463.3 million in 2022. With a projected CAGR of 11.1% for the next ten years, the market is likely to reach a valuation of nearly US$ 1,457.9 million by the end of 2033.

Attribute Details
Global Account-based Advertising Software Market Size (2022A) US$ 463.3 million
Global Account-based Advertising Software Estimated Market Value (2023) US$ 507.3 million
Global Account-based Advertising Software Forecasted Market Value (2033) US$ 1,457.9 million
Global Account-based Advertising Software Growth Rate (2023 to 2033) 11.1% CAGR
North America Account-based Advertising Software Share (2022) 30.3%
United States Account-based Advertising Software Market Share % (2022) 17.7%
Key Companies Profiled
  • Terminus
  • Metadata
  • Integrate
  • 6sense
  • RollWorks Madison Logic
  • Triblio ListenLoop
  • Jabmo Demandbase
  • Mintigo
  • Radiate B2B
  • Recotap
  • Bluebird
  • Kwanzoo Inc
  • IDG Communications

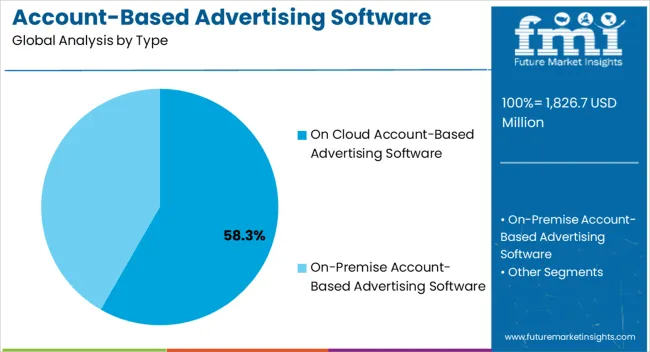
Future Market Insights’ analysis reveals that most of the market revenue is grossed from cloud-based account-based advertising software, which has a forecast CAGR of 10.7% by 2033. The global market for account-based advertising software witnessed a CAGR of 9% over the last four years (2018 to 2022).

Don't pay for what you don't need

Customize your report by selecting specific countries or regions and save 30%!

How is the Increase in adoption of Account-based Marketing Software Affecting the Account Based Advertising demand?

Account-based marketing, of which account-based advertising is an important part, is witnessing a boost in demand as companies attempt to leverage the benefits it provides to sales cycles, customer retention, ROI and lead generation. According to research, around 87% of B2B marketing teams say that their ABM efforts showed better ROI than their other efforts. Around 91% of companies using ABM reported increased average deal size, and a 70% reported increase in opportunities owing to ABM. Through the use of targeted ABM Platform, enterprises can show consumers that they understand their needs.

Through account-based advertising, companies can directly provide ads to businesses they want to target, ensuring that resources are focused only on accounts that are highly likely to convert and provide deals of larger sizes. Companies are benefiting from the advantages of using ADM platforms that can allow for access to the ability to leverage IP addresses and cookies and use advanced artificial intelligence and machine learning technologies for their B2B marketing.

This software can also be integrated with CRM and marketing tools and run multichannel campaigns across personas stages and campaigns. The automation of the ABM process is beneficial since it can shorten the sales cycle and provide a greater ease of scalability. Personalised landing pages, attractive emails, chatbots and other personalised techniques can help in order to scale. However, the high costs of set up and resources required due to the targeted nature of this advertising serves as a restraint.

With the help of ABM, one can make the most out of their clients and build long-term relations with their end-users. The initial stages require significant investments; however, they reward the user in the long run. In contrast to conventional tactics, these investments are exceedingly low, plus they require little to no cost for sustainability. This is especially the case for social media posts, which have long-term opportunities to boost brand awareness. In general, businesses using ABM can control which potential customers they do business with, which cuts down on transaction times considerably. Nevertheless, ABM demands steep investments to make business possible.

It is more customized as opposed to general occupational therapy, which is not quite focused on the specific requirements of each client.

The approach is more personal than the more general types of occupational therapy, which requires more specific research for each individual.

How can Account-based Advertising help Align Sales and Marketing Teams?

According to research, the misalignment between sales and marketing teams can cost businesses over US$1 trillion in just a year. In a survey conducted amongst sales and marketing teams, 90% reported a misalignment. Almost all those asked in survey believed this was harmful to their organization and target accounts as well. According to another study, enterprises where these teams are not misaligned have 36% higher retention rate, 67% higher chances of customer conversion and 38% higher sales win rates.

Under traditional lead-based marketing, sales and marketing teams work separately and have a higher chance of misalignment. This can lead to unqualified leads with conversion rates and chances of displaying lower retention.

Under ABM, both sales and marketing teams must come together to select accounts. In turn, only these accounts are targeted by the advertising teams. Further, only leads that have high potential to be productive and qualified, reach sales teams. Once these teams are selected, it is the marketing teams that must take on the burden of attracting the potential consumers from the selected pool of target accounts through highly personalised and effective advertising strategies and techniques. This level of high collaboration also means that tracking ROI becomes easier.

Sudip Saha
Sudip Saha

Principal Consultant

Talk to Analyst

Find your sweet spots for generating winning opportunities in this market.

How does Account-based Advertising Software Improve Lead Generation?

According to a study conducted amongst ABM markets, 42% believed that lead generation was one of the key indicators of performance. Instead of catching a wide range of potential customers quickly, ABM strategies target a narrower range of customers and targets them with effective advertising strategies.

Further, instead of focusing only on new leads, ABM also looks at retaining existing consumers through upselling and cross selling. For Example, LiveRamp used their ABM to connect and get meetings with 15 different target clients. A media company, GumGum, wanted to attract executives at McDonald’s. They sent out advertising in the form of burger “kits” for a select few top executives that contained information advertising their services, as well as a personalised receipts with the executive’s names, which helped them secure a meeting with some key decision makers.

How Does the Usage of Account-based Advertising Benefit Customer Relations?

Account based advertising can significantly improve customer relations. Highly personalized ads can help organizations get much closer to their customers. Unlike traditional marketing, which uses generalized messages, ABA advertising entails personalized messaging for individual customers, so that enterprises can understand their accounts and get closer to the messages recipients. Further when advertising is in the form of ABA, the advertising is on the specific form of communication and media suitable for a particular customer. This leads to higher customer engagement, and eventually, higher customer retention.

Get the data you need at a Fraction of the cost

Personalize your report by choosing insights you need
and save 40%!

Which Application is the Key Contributor to Demand?

Segment Large Companies
Value Share % (2022) 56.5%

Large companies are the top application for account-based advertising, having witnessed a CAGR of 11.1% with a forecast CAGR of 10.2%. While it does have several benefits, account-based advertising requires higher amounts of resources. According to a study, 37% of marketing teams have trouble in getting resources. Enterprises with products that have high values per customer and a relatively smaller market to target, benefit the most from this software. This tends to be larger enterprises that can afford the extensive data and resource requirements. For smaller businesses or businesses that require less sophistication in their sales cycles, other forms may prove more helpful. However, small and medium companies are also turning to 1: Many forms of ABM campaigns in recent years.
Region-wise Insights

Europe to Emerge as a Significant Contributor

Region Europe
Market Share % (2022) 26.5%

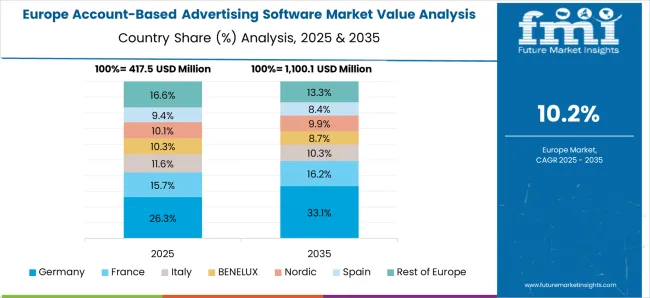
Europe in an emerging market for demand with a 26.5% market share in 2022 and a predicted market size of US$ 325 million by 2033. According to a study conducted amongst 500 marketing professionals, it was observed that nearly 86% of European companies reported plans to use account-based marketing and account-based advertising in the near future. The United Kingdom also emerged as a key country for demand, with the study indicating that 55% respondents showed interest in implementing these strategies.

Country-wise Insights

How the United States continue to be the Nucleus of Global Account-based Advertising Software Demand?

Country The United States
Market Share % (2022) 17.7%

The United States accounted for over 17.7% of the global account-based advertising software market in 2022. The United States is projected to account for an absolute dollar opportunity of US$ 287.2 million between 2023 and 2033 and a forecast market size of US$ 451.8 million by 2033 at 10.6% CAGR. A study conducted across marketing professionals showed that 47% of marketers are already using an ABM technique.

Category-wise Insights

What is the Scope of Cloud Based Account-based Advertising Software?

Cloud based advertising software is the significant type of account-based advertising software, with a historical CAGR of 11.4% and a forecast CAGR of 10.7% in 2023 to 2033. Cloud based systems are highly beneficial since they enable enterprises to access to a wide range of tools and reduces the burden on IT team. For one, cloud systems ensure easy access to customer data that is expected to be harder to store if traditional methods of storage are employed.

Furthermore, cloud is accessible anywhere anytime, enabling ease of remote work and improving collaborative possibilities. Besides, cloud-based systems allow for access to a far wider range of powerful analytic tools that can help gain insights on the customer base. This can also help identify and track which methods work the best and which ones are not to ensure the optimal use of time and resources.
Competitive Landscape

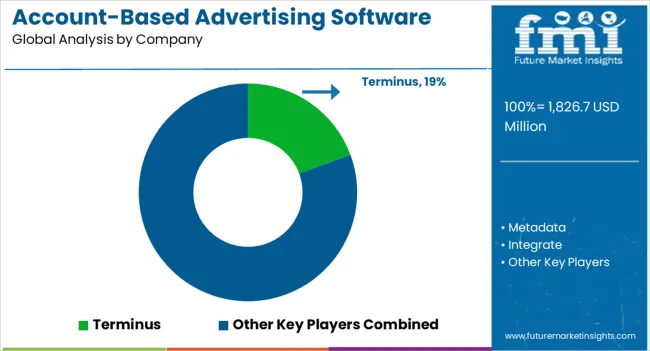
At present, account-based advertising software providers are focused on developments that are expected to afford more opportunities for targeting and analysis to marketing professionals. The key companies operating include Terminus, Metadata, Integrate, 6sense, RollWorks, Madison Logic, Triblio, ListenLoop, Jabmo, Demandbase, Mintigo, Radiate B2B, Recotap, Bluebird, Kwanzoo Inc, MRP and IDG Communications.

Some of the recent development in account-based advertising software are as follows:

  • In June 2022, Folloze and Hunter & Bard announced a partnership under which they aim to provide their customers a combination of Folloze’s speciality of their B2B buyer experience platform and Hunter & Bard’s ABM offerings.
  • In February 2022, ZoomInfo announced the launch of MarketingOS. This product is an ABM platform that uses ZoomInfo’s B2B data to allow for insight-driven information and personalized advertising across varied forms of media.
  • In March 2020, Madison Logic and LinkedIn announced a collaboration under which Madison Logic is expected to gain an integration with the LinkedIn Marketing Analytics API. Therefore, both of their clients can measure accounts across marketing channels on a single platform using LinkedIn’s Marketing Analytics API in combination with Madison Logic’s ML data Platform and ML data cloud.
  • Terminus obtained Ramble, which is an account-based chat application, in April 2020. With Ramble under its wing, Terminus aims to facilitate real-time, account-based ponderings for its customers all throughout customer’s journey.
  • Demand base launched a capability to its platform in January 2020. The new release empowers B2B businesses to automate their campaigns. Companies are able to dynamically alter audiences on the basis of offsite intent activity, CRM updates, and website engagement, and other activities with the help of a new solution called Dynamic Audience.
  • In May 2019, Madison Logic announced the launch of their product, the ML Data Cloud. This cloud uses sources from multiple sources, both first and third party to provide a platform for B2B marketing. This product aims to enable clients to provide, amongst other features, customized advertising and tracking and insights on which techniques and methods are the most efficient.

Similarly, recent developments related to ABM software companies have been tracked by the team at Future Market Insights, which is available in the full report.

Key Segments Covered in Account-Based Advertising Software Industry Survey

By Type:

  • On Cloud Account-based Advertising Software
  • On-Premise Account-based Advertising Software

By Application:

  • Large Companies
  • Small and Medium Companies

By Region:

  • North America
  • Europe
  • Asia Pacific
  • Middle East & Africa
  • Latin America

Frequently Asked Questions

How Big is the Market Going to be by 2033?

The market is valued to achieve US$ 1,457.9 million by 2033.

What is the Growth Forecast for Market?

The market is forecast to record a CAGR of 11.1% through 2033.

What is Current Market Valuation?

The market is estimated to secure a valuation of US$ 507.3 million in 2023.

What is the Market CAGR for United States?

The United States market to thrive at a CAGR of 10.6% through 2033.

Which Application Sector Captures a Significant Share of the Market?

With a significant share of 56.5%, the large companies segment.

Which Type Category Exhibits with a Rapid CAGR?

The CAGR for the cloud-based advertising software segment is 10.7% from 2023 to 2033.

Table of Content

1. Executive Summary

    1.1. Global Market Outlook

    1.2. Demand-side Trends

    1.3. Supply-side Trends

    1.4. Technology Roadmap Analysis

    1.5. Analysis and Recommendations

2. Market Overview

    2.1. Market Coverage / Taxonomy

    2.2. Market Definition / Scope / Limitations

3. Market Background

    3.1. Market Dynamics

        3.1.1. Drivers

        3.1.2. Restraints

        3.1.3. Opportunity

        3.1.4. Trends

    3.2. Scenario Forecast

        3.2.1. Demand in Optimistic Scenario

        3.2.2. Demand in Likely Scenario

        3.2.3. Demand in Conservative Scenario

    3.3. Opportunity Map Analysis

    3.4. Investment Feasibility Matrix

    3.5. PESTLE and Porter’s Analysis

    3.6. Regulatory Landscape

        3.6.1. By Key Regions

        3.6.2. By Key Countries

    3.7. Regional Parent Market Outlook

4. Global Market Analysis 2018 to 2022 and Forecast, 2023 to 2033

    4.1. Historical Market Size Value (US$ Million) Analysis, 2018 to 2022

    4.2. Current and Future Market Size Value (US$ Million) Projections, 2023 to 2033

        4.2.1. Y-o-Y Growth Trend Analysis

        4.2.2. Absolute $ Opportunity Analysis

5. Global Market Analysis 2018 to 2022 and Forecast 2023 to 2033, By Type

    5.1. Introduction / Key Findings

    5.2. Historical Market Size Value (US$ Million) Analysis By Type, 2018 to 2022

    5.3. Current and Future Market Size Value (US$ Million) Analysis and Forecast By Type, 2023 to 2033

        5.3.1. On Cloud

        5.3.2. On-Premise

    5.4. Y-o-Y Growth Trend Analysis By Type, 2018 to 2022

    5.5. Absolute $ Opportunity Analysis By Type, 2023 to 2033

6. Global Market Analysis 2018 to 2022 and Forecast 2023 to 2033, By Application

    6.1. Introduction / Key Findings

    6.2. Historical Market Size Value (US$ Million) Analysis By Application, 2018 to 2022

    6.3. Current and Future Market Size Value (US$ Million) Analysis and Forecast By Application, 2023 to 2033

        6.3.1. Large Companies

        6.3.2. Small and Medium Companies

    6.4. Y-o-Y Growth Trend Analysis By Application, 2018 to 2022

    6.5. Absolute $ Opportunity Analysis By Application, 2023 to 2033

7. Global Market Analysis 2018 to 2022 and Forecast 2023 to 2033, By Region

    7.1. Introduction

    7.2. Historical Market Size Value (US$ Million) Analysis By Region, 2018 to 2022

    7.3. Current Market Size Value (US$ Million) Analysis and Forecast By Region, 2023 to 2033

        7.3.1. North America

        7.3.2. Latin America

        7.3.3. Western Europe

        7.3.4. Eastern Europe

        7.3.5. South Asia and Pacific

        7.3.6. East Asia

        7.3.7. Middle East and Africa

    7.4. Market Attractiveness Analysis By Region

8. North America Market Analysis 2018 to 2022 and Forecast 2023 to 2033, By Country

    8.1. Historical Market Size Value (US$ Million) Trend Analysis By Market Taxonomy, 2018 to 2022

    8.2. Market Size Value (US$ Million) Forecast By Market Taxonomy, 2023 to 2033

        8.2.1. By Country

            8.2.1.1. U.S.

            8.2.1.2. Canada

        8.2.2. By Type

        8.2.3. By Application

    8.3. Market Attractiveness Analysis

        8.3.1. By Country

        8.3.2. By Type

        8.3.3. By Application

    8.4. Key Takeaways

9. Latin America Market Analysis 2018 to 2022 and Forecast 2023 to 2033, By Country

    9.1. Historical Market Size Value (US$ Million) Trend Analysis By Market Taxonomy, 2018 to 2022

    9.2. Market Size Value (US$ Million) Forecast By Market Taxonomy, 2023 to 2033

        9.2.1. By Country

            9.2.1.1. Brazil

            9.2.1.2. Mexico

            9.2.1.3. Rest of Latin America

        9.2.2. By Type

        9.2.3. By Application

    9.3. Market Attractiveness Analysis

        9.3.1. By Country

        9.3.2. By Type

        9.3.3. By Application

    9.4. Key Takeaways

10. Western Europe Market Analysis 2018 to 2022 and Forecast 2023 to 2033, By Country

    10.1. Historical Market Size Value (US$ Million) Trend Analysis By Market Taxonomy, 2018 to 2022

    10.2. Market Size Value (US$ Million) Forecast By Market Taxonomy, 2023 to 2033

        10.2.1. By Country

            10.2.1.1. Germany

            10.2.1.2. U.K.

            10.2.1.3. France

            10.2.1.4. Spain

            10.2.1.5. Italy

            10.2.1.6. Rest of Western Europe

        10.2.2. By Type

        10.2.3. By Application

    10.3. Market Attractiveness Analysis

        10.3.1. By Country

        10.3.2. By Type

        10.3.3. By Application

    10.4. Key Takeaways

11. Eastern Europe Market Analysis 2018 to 2022 and Forecast 2023 to 2033, By Country

    11.1. Historical Market Size Value (US$ Million) Trend Analysis By Market Taxonomy, 2018 to 2022

    11.2. Market Size Value (US$ Million) Forecast By Market Taxonomy, 2023 to 2033

        11.2.1. By Country

            11.2.1.1. Poland

            11.2.1.2. Russia

            11.2.1.3. Czech Republic

            11.2.1.4. Romania

            11.2.1.5. Rest of Eastern Europe

        11.2.2. By Type

        11.2.3. By Application

    11.3. Market Attractiveness Analysis

        11.3.1. By Country

        11.3.2. By Type

        11.3.3. By Application

    11.4. Key Takeaways

12. South Asia and Pacific Market Analysis 2018 to 2022 and Forecast 2023 to 2033, By Country

    12.1. Historical Market Size Value (US$ Million) Trend Analysis By Market Taxonomy, 2018 to 2022

    12.2. Market Size Value (US$ Million) Forecast By Market Taxonomy, 2023 to 2033

        12.2.1. By Country

            12.2.1.1. India

            12.2.1.2. Bangladesh

            12.2.1.3. Australia

            12.2.1.4. New Zealand

            12.2.1.5. Rest of South Asia and Pacific

        12.2.2. By Type

        12.2.3. By Application

    12.3. Market Attractiveness Analysis

        12.3.1. By Country

        12.3.2. By Type

        12.3.3. By Application

    12.4. Key Takeaways

13. East Asia Market Analysis 2018 to 2022 and Forecast 2023 to 2033, By Country

    13.1. Historical Market Size Value (US$ Million) Trend Analysis By Market Taxonomy, 2018 to 2022

    13.2. Market Size Value (US$ Million) Forecast By Market Taxonomy, 2023 to 2033

        13.2.1. By Country

            13.2.1.1. China

            13.2.1.2. Japan

            13.2.1.3. South Korea

        13.2.2. By Type

        13.2.3. By Application

    13.3. Market Attractiveness Analysis

        13.3.1. By Country

        13.3.2. By Type

        13.3.3. By Application

    13.4. Key Takeaways

14. Middle East and Africa Market Analysis 2018 to 2022 and Forecast 2023 to 2033, By Country

    14.1. Historical Market Size Value (US$ Million) Trend Analysis By Market Taxonomy, 2018 to 2022

    14.2. Market Size Value (US$ Million) Forecast By Market Taxonomy, 2023 to 2033

        14.2.1. By Country

            14.2.1.1. GCC Countries

            14.2.1.2. South Africa

            14.2.1.3. Israel

            14.2.1.4. Rest of MEA

        14.2.2. By Type

        14.2.3. By Application

    14.3. Market Attractiveness Analysis

        14.3.1. By Country

        14.3.2. By Type

        14.3.3. By Application

    14.4. Key Takeaways

15. Key Countries Market Analysis

    15.1. U.S.

        15.1.1. Pricing Analysis

        15.1.2. Market Share Analysis, 2022

            15.1.2.1. By Type

            15.1.2.2. By Application

    15.2. Canada

        15.2.1. Pricing Analysis

        15.2.2. Market Share Analysis, 2022

            15.2.2.1. By Type

            15.2.2.2. By Application

    15.3. Brazil

        15.3.1. Pricing Analysis

        15.3.2. Market Share Analysis, 2022

            15.3.2.1. By Type

            15.3.2.2. By Application

    15.4. Mexico

        15.4.1. Pricing Analysis

        15.4.2. Market Share Analysis, 2022

            15.4.2.1. By Type

            15.4.2.2. By Application

    15.5. Germany

        15.5.1. Pricing Analysis

        15.5.2. Market Share Analysis, 2022

            15.5.2.1. By Type

            15.5.2.2. By Application

    15.6. U.K.

        15.6.1. Pricing Analysis

        15.6.2. Market Share Analysis, 2022

            15.6.2.1. By Type

            15.6.2.2. By Application

    15.7. France

        15.7.1. Pricing Analysis

        15.7.2. Market Share Analysis, 2022

            15.7.2.1. By Type

            15.7.2.2. By Application

    15.8. Spain

        15.8.1. Pricing Analysis

        15.8.2. Market Share Analysis, 2022

            15.8.2.1. By Type

            15.8.2.2. By Application

    15.9. Italy

        15.9.1. Pricing Analysis

        15.9.2. Market Share Analysis, 2022

            15.9.2.1. By Type

            15.9.2.2. By Application

    15.10. Poland

        15.10.1. Pricing Analysis

        15.10.2. Market Share Analysis, 2022

            15.10.2.1. By Type

            15.10.2.2. By Application

    15.11. Russia

        15.11.1. Pricing Analysis

        15.11.2. Market Share Analysis, 2022

            15.11.2.1. By Type

            15.11.2.2. By Application

    15.12. Czech Republic

        15.12.1. Pricing Analysis

        15.12.2. Market Share Analysis, 2022

            15.12.2.1. By Type

            15.12.2.2. By Application

    15.13. Romania

        15.13.1. Pricing Analysis

        15.13.2. Market Share Analysis, 2022

            15.13.2.1. By Type

            15.13.2.2. By Application

    15.14. India

        15.14.1. Pricing Analysis

        15.14.2. Market Share Analysis, 2022

            15.14.2.1. By Type

            15.14.2.2. By Application

    15.15. Bangladesh

        15.15.1. Pricing Analysis

        15.15.2. Market Share Analysis, 2022

            15.15.2.1. By Type

            15.15.2.2. By Application

    15.16. Australia

        15.16.1. Pricing Analysis

        15.16.2. Market Share Analysis, 2022

            15.16.2.1. By Type

            15.16.2.2. By Application

    15.17. New Zealand

        15.17.1. Pricing Analysis

        15.17.2. Market Share Analysis, 2022

            15.17.2.1. By Type

            15.17.2.2. By Application

    15.18. China

        15.18.1. Pricing Analysis

        15.18.2. Market Share Analysis, 2022

            15.18.2.1. By Type

            15.18.2.2. By Application

    15.19. Japan

        15.19.1. Pricing Analysis

        15.19.2. Market Share Analysis, 2022

            15.19.2.1. By Type

            15.19.2.2. By Application

    15.20. South Korea

        15.20.1. Pricing Analysis

        15.20.2. Market Share Analysis, 2022

            15.20.2.1. By Type

            15.20.2.2. By Application

    15.21. GCC Countries

        15.21.1. Pricing Analysis

        15.21.2. Market Share Analysis, 2022

            15.21.2.1. By Type

            15.21.2.2. By Application

    15.22. South Africa

        15.22.1. Pricing Analysis

        15.22.2. Market Share Analysis, 2022

            15.22.2.1. By Type

            15.22.2.2. By Application

    15.23. Israel

        15.23.1. Pricing Analysis

        15.23.2. Market Share Analysis, 2022

            15.23.2.1. By Type

            15.23.2.2. By Application

16. Market Structure Analysis

    16.1. Competition Dashboard

    16.2. Competition Benchmarking

    16.3. Market Share Analysis of Top Players

        16.3.1. By Regional

        16.3.2. By Type

        16.3.3. By Application

17. Competition Analysis

    17.1. Competition Deep Dive

        17.1.1. Terminus

            17.1.1.1. Overview

            17.1.1.2. Product Portfolio

            17.1.1.3. Profitability by Market Segments

            17.1.1.4. Sales Footprint

            17.1.1.5. Strategy Overview

                17.1.1.5.1. Marketing Strategy

        17.1.2. Metadata

            17.1.2.1. Overview

            17.1.2.2. Product Portfolio

            17.1.2.3. Profitability by Market Segments

            17.1.2.4. Sales Footprint

            17.1.2.5. Strategy Overview

                17.1.2.5.1. Marketing Strategy

        17.1.3. Integrate

            17.1.3.1. Overview

            17.1.3.2. Product Portfolio

            17.1.3.3. Profitability by Market Segments

            17.1.3.4. Sales Footprint

            17.1.3.5. Strategy Overview

                17.1.3.5.1. Marketing Strategy

        17.1.4. 6sense

            17.1.4.1. Overview

            17.1.4.2. Product Portfolio

            17.1.4.3. Profitability by Market Segments

            17.1.4.4. Sales Footprint

            17.1.4.5. Strategy Overview

                17.1.4.5.1. Marketing Strategy

        17.1.5. RollWorks Madison Logic

            17.1.5.1. Overview

            17.1.5.2. Product Portfolio

            17.1.5.3. Profitability by Market Segments

            17.1.5.4. Sales Footprint

            17.1.5.5. Strategy Overview

                17.1.5.5.1. Marketing Strategy

        17.1.6. Triblio ListenLoop

            17.1.6.1. Overview

            17.1.6.2. Product Portfolio

            17.1.6.3. Profitability by Market Segments

            17.1.6.4. Sales Footprint

            17.1.6.5. Strategy Overview

                17.1.6.5.1. Marketing Strategy

        17.1.7. Jabmo Demandbase

            17.1.7.1. Overview

            17.1.7.2. Product Portfolio

            17.1.7.3. Profitability by Market Segments

            17.1.7.4. Sales Footprint

            17.1.7.5. Strategy Overview

                17.1.7.5.1. Marketing Strategy

        17.1.8. Mintigo

            17.1.8.1. Overview

            17.1.8.2. Product Portfolio

            17.1.8.3. Profitability by Market Segments

            17.1.8.4. Sales Footprint

            17.1.8.5. Strategy Overview

                17.1.8.5.1. Marketing Strategy

        17.1.9. Radiate B2B

            17.1.9.1. Overview

            17.1.9.2. Product Portfolio

            17.1.9.3. Profitability by Market Segments

            17.1.9.4. Sales Footprint

            17.1.9.5. Strategy Overview

                17.1.9.5.1. Marketing Strategy

        17.1.10. Recotap

            17.1.10.1. Overview

            17.1.10.2. Product Portfolio

            17.1.10.3. Profitability by Market Segments

            17.1.10.4. Sales Footprint

            17.1.10.5. Strategy Overview

                17.1.10.5.1. Marketing Strategy

        17.1.11. Bluebird

            17.1.11.1. Overview

            17.1.11.2. Product Portfolio

            17.1.11.3. Profitability by Market Segments

            17.1.11.4. Sales Footprint

            17.1.11.5. Strategy Overview

                17.1.11.5.1. Marketing Strategy

        17.1.12. Kwanzoo Inc

            17.1.12.1. Overview

            17.1.12.2. Product Portfolio

            17.1.12.3. Profitability by Market Segments

            17.1.12.4. Sales Footprint

            17.1.12.5. Strategy Overview

                17.1.12.5.1. Marketing Strategy

        17.1.13. IDG Communications

            17.1.13.1. Overview

            17.1.13.2. Product Portfolio

            17.1.13.3. Profitability by Market Segments

            17.1.13.4. Sales Footprint

            17.1.13.5. Strategy Overview

                17.1.13.5.1. Marketing Strategy

18. Assumptions & Acronyms Used

19. Research Methodology

List of Tables

Table 1: Global Market Value (US$ Million) Forecast by Region, 2018 to 2033

Table 2: Global Market Value (US$ Million) Forecast by Type, 2018 to 2033

Table 3: Global Market Value (US$ Million) Forecast by Application, 2018 to 2033

Table 4: North America Market Value (US$ Million) Forecast by Country, 2018 to 2033

Table 5: North America Market Value (US$ Million) Forecast by Type, 2018 to 2033

Table 6: North America Market Value (US$ Million) Forecast by Application, 2018 to 2033

Table 7: Latin America Market Value (US$ Million) Forecast by Country, 2018 to 2033

Table 8: Latin America Market Value (US$ Million) Forecast by Type, 2018 to 2033

Table 9: Latin America Market Value (US$ Million) Forecast by Application, 2018 to 2033

Table 10: Western Europe Market Value (US$ Million) Forecast by Country, 2018 to 2033

Table 11: Western Europe Market Value (US$ Million) Forecast by Type, 2018 to 2033

Table 12: Western Europe Market Value (US$ Million) Forecast by Application, 2018 to 2033

Table 13: Eastern Europe Market Value (US$ Million) Forecast by Country, 2018 to 2033

Table 14: Eastern Europe Market Value (US$ Million) Forecast by Type, 2018 to 2033

Table 15: Eastern Europe Market Value (US$ Million) Forecast by Application, 2018 to 2033

Table 16: South Asia and Pacific Market Value (US$ Million) Forecast by Country, 2018 to 2033

Table 17: South Asia and Pacific Market Value (US$ Million) Forecast by Type, 2018 to 2033

Table 18: South Asia and Pacific Market Value (US$ Million) Forecast by Application, 2018 to 2033

Table 19: East Asia Market Value (US$ Million) Forecast by Country, 2018 to 2033

Table 20: East Asia Market Value (US$ Million) Forecast by Type, 2018 to 2033

Table 21: East Asia Market Value (US$ Million) Forecast by Application, 2018 to 2033

Table 22: Middle East and Africa Market Value (US$ Million) Forecast by Country, 2018 to 2033

Table 23: Middle East and Africa Market Value (US$ Million) Forecast by Type, 2018 to 2033

Table 24: Middle East and Africa Market Value (US$ Million) Forecast by Application, 2018 to 2033

List of Charts

Figure 1: Global Market Value (US$ Million) by Type, 2023 to 2033

Figure 2: Global Market Value (US$ Million) by Application, 2023 to 2033

Figure 3: Global Market Value (US$ Million) by Region, 2023 to 2033

Figure 4: Global Market Value (US$ Million) Analysis by Region, 2018 to 2033

Figure 5: Global Market Value Share (%) and BPS Analysis by Region, 2023 to 2033

Figure 6: Global Market Y-o-Y Growth (%) Projections by Region, 2023 to 2033

Figure 7: Global Market Value (US$ Million) Analysis by Type, 2018 to 2033

Figure 8: Global Market Value Share (%) and BPS Analysis by Type, 2023 to 2033

Figure 9: Global Market Y-o-Y Growth (%) Projections by Type, 2023 to 2033

Figure 10: Global Market Value (US$ Million) Analysis by Application, 2018 to 2033

Figure 11: Global Market Value Share (%) and BPS Analysis by Application, 2023 to 2033

Figure 12: Global Market Y-o-Y Growth (%) Projections by Application, 2023 to 2033

Figure 13: Global Market Attractiveness by Type, 2023 to 2033

Figure 14: Global Market Attractiveness by Application, 2023 to 2033

Figure 15: Global Market Attractiveness by Region, 2023 to 2033

Figure 16: North America Market Value (US$ Million) by Type, 2023 to 2033

Figure 17: North America Market Value (US$ Million) by Application, 2023 to 2033

Figure 18: North America Market Value (US$ Million) by Country, 2023 to 2033

Figure 19: North America Market Value (US$ Million) Analysis by Country, 2018 to 2033

Figure 20: North America Market Value Share (%) and BPS Analysis by Country, 2023 to 2033

Figure 21: North America Market Y-o-Y Growth (%) Projections by Country, 2023 to 2033

Figure 22: North America Market Value (US$ Million) Analysis by Type, 2018 to 2033

Figure 23: North America Market Value Share (%) and BPS Analysis by Type, 2023 to 2033

Figure 24: North America Market Y-o-Y Growth (%) Projections by Type, 2023 to 2033

Figure 25: North America Market Value (US$ Million) Analysis by Application, 2018 to 2033

Figure 26: North America Market Value Share (%) and BPS Analysis by Application, 2023 to 2033

Figure 27: North America Market Y-o-Y Growth (%) Projections by Application, 2023 to 2033

Figure 28: North America Market Attractiveness by Type, 2023 to 2033

Figure 29: North America Market Attractiveness by Application, 2023 to 2033

Figure 30: North America Market Attractiveness by Country, 2023 to 2033

Figure 31: Latin America Market Value (US$ Million) by Type, 2023 to 2033

Figure 32: Latin America Market Value (US$ Million) by Application, 2023 to 2033

Figure 33: Latin America Market Value (US$ Million) by Country, 2023 to 2033

Figure 34: Latin America Market Value (US$ Million) Analysis by Country, 2018 to 2033

Figure 35: Latin America Market Value Share (%) and BPS Analysis by Country, 2023 to 2033

Figure 36: Latin America Market Y-o-Y Growth (%) Projections by Country, 2023 to 2033

Figure 37: Latin America Market Value (US$ Million) Analysis by Type, 2018 to 2033

Figure 38: Latin America Market Value Share (%) and BPS Analysis by Type, 2023 to 2033

Figure 39: Latin America Market Y-o-Y Growth (%) Projections by Type, 2023 to 2033

Figure 40: Latin America Market Value (US$ Million) Analysis by Application, 2018 to 2033

Figure 41: Latin America Market Value Share (%) and BPS Analysis by Application, 2023 to 2033

Figure 42: Latin America Market Y-o-Y Growth (%) Projections by Application, 2023 to 2033

Figure 43: Latin America Market Attractiveness by Type, 2023 to 2033

Figure 44: Latin America Market Attractiveness by Application, 2023 to 2033

Figure 45: Latin America Market Attractiveness by Country, 2023 to 2033

Figure 46: Western Europe Market Value (US$ Million) by Type, 2023 to 2033

Figure 47: Western Europe Market Value (US$ Million) by Application, 2023 to 2033

Figure 48: Western Europe Market Value (US$ Million) by Country, 2023 to 2033

Figure 49: Western Europe Market Value (US$ Million) Analysis by Country, 2018 to 2033

Figure 50: Western Europe Market Value Share (%) and BPS Analysis by Country, 2023 to 2033

Figure 51: Western Europe Market Y-o-Y Growth (%) Projections by Country, 2023 to 2033

Figure 52: Western Europe Market Value (US$ Million) Analysis by Type, 2018 to 2033

Figure 53: Western Europe Market Value Share (%) and BPS Analysis by Type, 2023 to 2033

Figure 54: Western Europe Market Y-o-Y Growth (%) Projections by Type, 2023 to 2033

Figure 55: Western Europe Market Value (US$ Million) Analysis by Application, 2018 to 2033

Figure 56: Western Europe Market Value Share (%) and BPS Analysis by Application, 2023 to 2033

Figure 57: Western Europe Market Y-o-Y Growth (%) Projections by Application, 2023 to 2033

Figure 58: Western Europe Market Attractiveness by Type, 2023 to 2033

Figure 59: Western Europe Market Attractiveness by Application, 2023 to 2033

Figure 60: Western Europe Market Attractiveness by Country, 2023 to 2033

Figure 61: Eastern Europe Market Value (US$ Million) by Type, 2023 to 2033

Figure 62: Eastern Europe Market Value (US$ Million) by Application, 2023 to 2033

Figure 63: Eastern Europe Market Value (US$ Million) by Country, 2023 to 2033

Figure 64: Eastern Europe Market Value (US$ Million) Analysis by Country, 2018 to 2033

Figure 65: Eastern Europe Market Value Share (%) and BPS Analysis by Country, 2023 to 2033

Figure 66: Eastern Europe Market Y-o-Y Growth (%) Projections by Country, 2023 to 2033

Figure 67: Eastern Europe Market Value (US$ Million) Analysis by Type, 2018 to 2033

Figure 68: Eastern Europe Market Value Share (%) and BPS Analysis by Type, 2023 to 2033

Figure 69: Eastern Europe Market Y-o-Y Growth (%) Projections by Type, 2023 to 2033

Figure 70: Eastern Europe Market Value (US$ Million) Analysis by Application, 2018 to 2033

Figure 71: Eastern Europe Market Value Share (%) and BPS Analysis by Application, 2023 to 2033

Figure 72: Eastern Europe Market Y-o-Y Growth (%) Projections by Application, 2023 to 2033

Figure 73: Eastern Europe Market Attractiveness by Type, 2023 to 2033

Figure 74: Eastern Europe Market Attractiveness by Application, 2023 to 2033

Figure 75: Eastern Europe Market Attractiveness by Country, 2023 to 2033

Figure 76: South Asia and Pacific Market Value (US$ Million) by Type, 2023 to 2033

Figure 77: South Asia and Pacific Market Value (US$ Million) by Application, 2023 to 2033

Figure 78: South Asia and Pacific Market Value (US$ Million) by Country, 2023 to 2033

Figure 79: South Asia and Pacific Market Value (US$ Million) Analysis by Country, 2018 to 2033

Figure 80: South Asia and Pacific Market Value Share (%) and BPS Analysis by Country, 2023 to 2033

Figure 81: South Asia and Pacific Market Y-o-Y Growth (%) Projections by Country, 2023 to 2033

Figure 82: South Asia and Pacific Market Value (US$ Million) Analysis by Type, 2018 to 2033

Figure 83: South Asia and Pacific Market Value Share (%) and BPS Analysis by Type, 2023 to 2033

Figure 84: South Asia and Pacific Market Y-o-Y Growth (%) Projections by Type, 2023 to 2033

Figure 85: South Asia and Pacific Market Value (US$ Million) Analysis by Application, 2018 to 2033

Figure 86: South Asia and Pacific Market Value Share (%) and BPS Analysis by Application, 2023 to 2033

Figure 87: South Asia and Pacific Market Y-o-Y Growth (%) Projections by Application, 2023 to 2033

Figure 88: South Asia and Pacific Market Attractiveness by Type, 2023 to 2033

Figure 89: South Asia and Pacific Market Attractiveness by Application, 2023 to 2033

Figure 90: South Asia and Pacific Market Attractiveness by Country, 2023 to 2033

Figure 91: East Asia Market Value (US$ Million) by Type, 2023 to 2033

Figure 92: East Asia Market Value (US$ Million) by Application, 2023 to 2033

Figure 93: East Asia Market Value (US$ Million) by Country, 2023 to 2033

Figure 94: East Asia Market Value (US$ Million) Analysis by Country, 2018 to 2033

Figure 95: East Asia Market Value Share (%) and BPS Analysis by Country, 2023 to 2033

Figure 96: East Asia Market Y-o-Y Growth (%) Projections by Country, 2023 to 2033

Figure 97: East Asia Market Value (US$ Million) Analysis by Type, 2018 to 2033

Figure 98: East Asia Market Value Share (%) and BPS Analysis by Type, 2023 to 2033

Figure 99: East Asia Market Y-o-Y Growth (%) Projections by Type, 2023 to 2033

Figure 100: East Asia Market Value (US$ Million) Analysis by Application, 2018 to 2033

Figure 101: East Asia Market Value Share (%) and BPS Analysis by Application, 2023 to 2033

Figure 102: East Asia Market Y-o-Y Growth (%) Projections by Application, 2023 to 2033

Figure 103: East Asia Market Attractiveness by Type, 2023 to 2033

Figure 104: East Asia Market Attractiveness by Application, 2023 to 2033

Figure 105: East Asia Market Attractiveness by Country, 2023 to 2033

Figure 106: Middle East and Africa Market Value (US$ Million) by Type, 2023 to 2033

Figure 107: Middle East and Africa Market Value (US$ Million) by Application, 2023 to 2033

Figure 108: Middle East and Africa Market Value (US$ Million) by Country, 2023 to 2033

Figure 109: Middle East and Africa Market Value (US$ Million) Analysis by Country, 2018 to 2033

Figure 110: Middle East and Africa Market Value Share (%) and BPS Analysis by Country, 2023 to 2033

Figure 111: Middle East and Africa Market Y-o-Y Growth (%) Projections by Country, 2023 to 2033

Figure 112: Middle East and Africa Market Value (US$ Million) Analysis by Type, 2018 to 2033

Figure 113: Middle East and Africa Market Value Share (%) and BPS Analysis by Type, 2023 to 2033

Figure 114: Middle East and Africa Market Y-o-Y Growth (%) Projections by Type, 2023 to 2033

Figure 115: Middle East and Africa Market Value (US$ Million) Analysis by Application, 2018 to 2033

Figure 116: Middle East and Africa Market Value Share (%) and BPS Analysis by Application, 2023 to 2033

Figure 117: Middle East and Africa Market Y-o-Y Growth (%) Projections by Application, 2023 to 2033

Figure 118: Middle East and Africa Market Attractiveness by Type, 2023 to 2033

Figure 119: Middle East and Africa Market Attractiveness by Application, 2023 to 2033

Figure 120: Middle East and Africa Market Attractiveness by Country, 2023 to 2033

Recommendations

Technology

Social Advertising Tools Market

Published : July 2022

Technology

Cross-platform and Mobile Advertising Market

Published : February 2019

Explore Technology Insights

View Reports

Account-Based Advertising Software Market