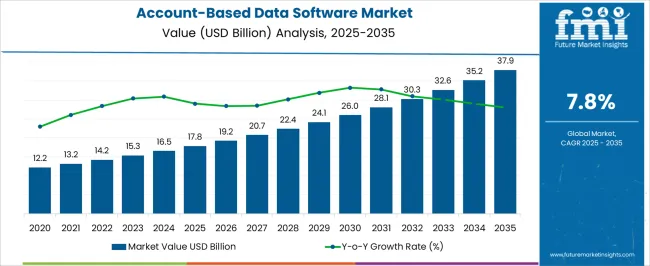
The Account-Based Data Software Market is estimated to be valued at USD 17.8 billion in 2025 and is projected to reach USD 37.9 billion by 2035, registering a compound annual growth rate (CAGR) of 7.8% over the forecast period.

| Metric | Value |
|---|---|
| Account-Based Data Software Market Estimated Value in (2025 E) | USD 17.8 billion |
| Account-Based Data Software Market Forecast Value in (2035 F) | USD 37.9 billion |
| Forecast CAGR (2025 to 2035) | 7.8% |
The account-based data software market is experiencing strong growth, fueled by the increasing adoption of account-based strategies in sales and marketing. Industry announcements and company earnings presentations have highlighted rising investments in data-driven technologies that enable businesses to identify, segment, and engage high-value accounts more effectively. The shift towards personalization and precision targeting has accelerated demand for platforms that integrate customer data, predictive analytics, and AI-driven insights.
Organizations are focusing on improving ROI from marketing campaigns, and account-based data software has emerged as a critical enabler by aligning sales and marketing functions. Cloud computing has further enhanced scalability and accessibility, allowing companies to deploy advanced tools with lower infrastructure costs.
As enterprises pursue digital transformation, the market outlook is expected to remain positive, driven by the increasing need for unified account intelligence, higher demand from large organizations, and the proliferation of cloud-based deployment models that support flexibility and integration with other enterprise platforms.

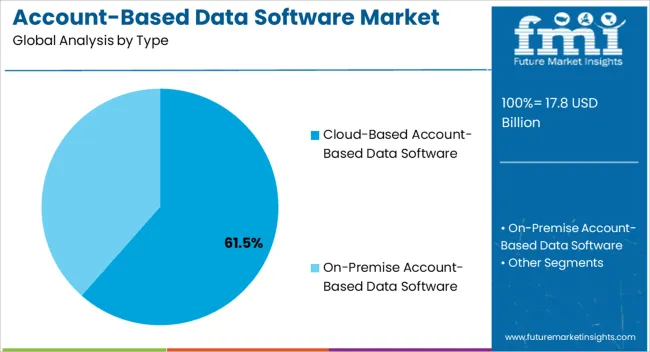
The Cloud-Based Account-Based Data Software segment is projected to account for 61.50% of the market revenue in 2025, reflecting its dominance over on-premise solutions. Growth in this segment has been driven by the scalability, accessibility, and lower upfront costs associated with cloud deployment. Enterprises have increasingly prioritized cloud solutions to enable remote access, seamless updates, and integration with other SaaS-based tools in the marketing and sales technology stack.
Cloud platforms have provided advanced analytics and real-time account insights while reducing the burden of IT maintenance. Vendor strategies emphasizing subscription-based models have further supported adoption by offering cost predictability and flexibility in scaling resources.
Additionally, cloud deployment has facilitated faster implementation and broader adoption across geographically dispersed teams, aligning with the growing need for agility in data-driven decision-making. With continuous innovations in AI-powered analytics and customer data management within cloud ecosystems, this segment is expected to sustain its market leadership.

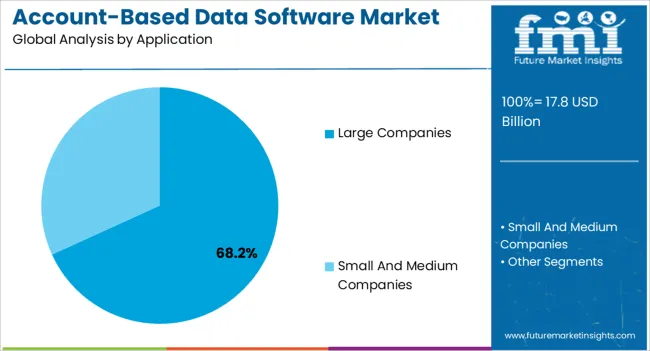
The Large Companies segment is projected to contribute 68.20% of the account-based data software market revenue in 2025, maintaining its position as the dominant application segment. Growth in this segment has been supported by the complexity of managing vast customer bases and the need for sophisticated tools to target key accounts. Large enterprises have allocated significant budgets to account-based marketing strategies, emphasizing personalized engagement with high-value clients.
Industry reports and corporate disclosures have highlighted that large organizations rely on account-based data software to integrate sales, marketing, and customer success functions for improved alignment and efficiency. The ability of these platforms to handle massive datasets, deliver predictive insights, and automate workflows has been critical for enterprise-scale adoption.
Furthermore, large companies have leveraged such software to support global operations, ensuring consistency in targeting and messaging across multiple markets. With growing competitive pressures and the increasing role of data-driven strategies in revenue generation, the Large Companies segment is expected to remain the cornerstone of market growth.
As per the account-based data software market research by Future Market Insights - market research and competitive intelligence provider, from 2025 to 2035, the market value of the account-based data software market increased at around 8.2% CAGR. With an absolute dollar opportunity of USD 37.9 billion, the market is projected to reach a valuation of USD 33.62 billion by 2035.
Future Market Insights’ analysis reveals that most of the market revenue is grossed from Cloud-based Account-Based Data software, which is accounted for a forecasted CAGR of 7.9%. Account-Based Data software provides. The global market for account-based data software witnessed a CAGR of 6.1% over the last five years (2020 to 2025).
Benefits to ICP selection to provide a boost to demand in the forecast period
According to research, companies can gain the benefits of a 68% higher win rate if they create thorough and clear Ideal Customer Profiles (ICPs). The use of three different metrics of data can help companies define an ICP accurately. Qualitative data from teams must be used in comparison with actual data from data software such as analysis and historical sales and interaction data. There are numerous parts to the creation of the ICP.
For one, a company needs to use data to gain insights on which types and features of profiles have given rise to customer relations with high levels of engagement, high value deals and good retention rates. This requires the existence of a thorough and clear database, which is possible only through Account-Based Data Software utilization. The database must be up-to-date, cover all contacts and accounts, be scalable while maintaining accuracy, and be accessible and collaborative to all branches of the teams within the companies.
The database needs to be inclusive of as many accounts as possible, and regularly updates, since estimates have found that the accuracy of a list can decrease nearly at a rate of 20% per year. Further, the internal structure of the account needs to be collected to ensure that the right people and teams are being connected and engaged with.
Finally, the use of significant data can help define buyer personas more accurately. The buyer data is a key component of this since the persona must be personalized to individualized accounts activities, and goals. The gap between the accounts and buyer personas available needs to be covered.
Intent data to help organizations understand which accounts to target more efficiently.
Intent data, or sales intelligence about accounts that are showing intent or interest, is a key step to optimizing the benefits of B2B ABM marketing. According to research, 87% buyers search online for research before buying a product. Intent data allows an enterprise’s collaborating teams to understand elements such as if an account is actively consuming data that could indicate higher intent.
This data includes things like reviews, blog posts, research papers, news articles and community query sites related to the topic. When buyers with a high level of intent are identified, enterprises can target them through personalised campaigns and gain a competitive edge before the customer even begins engagement – to influence them in the early interest stages.
This can influence better target account selection and allow teams to rank accounts- giving higher priority to buyers showcasing more interest, which more often than not will mean higher conversion rates. It also benefits customer relations, since understanding intent patterns of existing consumers can allow for more efficient upselling strategy and improve relationships. The most efficient method of using this data, however, is through the use of data software that allows for analysis in combination with other data such as whether the customer is actually a good fit.
According to a survey conducted amongst marketing teams, 56% and 43% of participants believed that content and data management, respectively, are the most essential components of ABM. Using Data software, the databases concerned can be inspected to find which content is working the best for which types of clients and provide more personalized messages. Also, insights derived from this data are vital – with the insights collected having the ability to show teams possible new methods of content and advertising they might not even have considered. Thus, the teams can work on customized data for their accounts.
Collaboration between teams leads to better account selection and overall benefits
According to research, the misalignment between sales and marketing teams can cost businesses over USD 1 trillion in just a year. In a survey conducted amongst sales and marketing teams, 90% reported a misalignment. According to another study, enterprises where these teams are not misaligned, have 36% higher retention, 67% higher chances of customer conversion and 38% higher sales win rates. Effective data software ensures that sales and marketing teams are aligned and have access to the same datasets when coming up with ICP guidelines. Under traditional lead-based marketing, sales and marketing teams work separately and have a higher chance of misalignment. This can lead to unqualified leads with conversion rates and chancing of displaying lower retention. With the use of data software, both sales and marketing teams can come together to select accounts based on concrete data that both must agree upon, leading to higher chances of selecting qualified leads.
Using account-based software, companies can account for performance analysis, content engagement metrics across campaigns, activity and retention rates, and LTV. Further data automation can help contribute even after the data is already selected. Predictive analytics can also help teams understand where to adjust campaigns already in progress and where the techniques might need to be adjusted.
Large enterprises continue to contribute the most to the demand, however, small and medium companies can also benefit from Account-Based Data Software
Large Enterprises are the top application for account-based data software with a forecasted CAGR of 7.8% in the next 10-year epoch. While it does have several benefits, account-based data software requires high levels of data and resources to work, which suggests that large companies are the largest contributors to demand, since they benefit from the automation capabilities it can provide and they require the insights it provides. Small and medium-sized companies are increasingly looking to the adoption of account-based data software as the safety of cloud-based systems increases, since cloud systems come at significantly lower costs of setup, installation and upkeep, as well as require smaller IT teams when compared to on-premise options.
Europe is an emerging market with 23.4% market share captured in 2025 and a predicted market size of USD 37.9 billion by 2035. According to a study conducted amongst 500 marketing professionals, it was observed that 86% of European companies reported plans to use account based marketing and account based data in the near future. The United Kingdom also emerged as a key country for demand, with the study indicating that 55% of respondents showed interest in implementing these strategies. The United Kingdom witnessed a CAGR of 8.6% in the past, and has an absolute dollar opportunity of USD 5.8 billion at a CAGR of 37.9% with a forecasted market value of USD 10.9 billion.
The United States to remain a key component of global Consumption
The United States accounted for over 17.1% of the global account-based data software market in 2025. The United States has a USD 17.8 million absolute dollar opportunity of USD 451.8 million between 2025 and 2035 at 10.6% CAGR.
Cloud Based Data Software is currently the leading type of account-based data software, with a historic CAGR of 8.9% and a forecasted CAGR of 8% in 2025 to 2035. Account based data software requires the storage and analysis of massive volumes of data, which needs to be scalable, cost-efficient and collaborative Cloud-based software, is the key solution type for companies to use in data software.
Another feature that makes cloud software preferable is the ability to manage routine processes like backup recovery if it is a feature provided by the service provider. Cloud storage is also beneficial across all sizes of enterprises, since it is significantly cheaper than on-premise solutions.

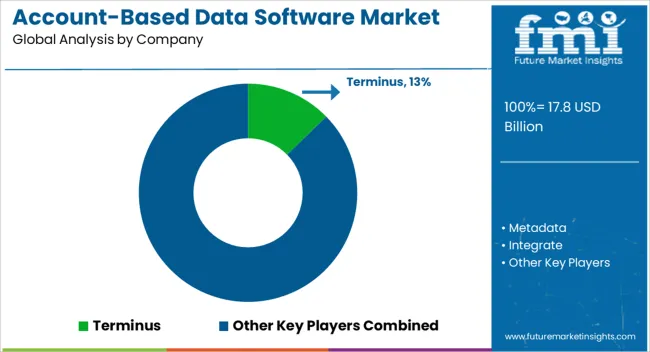
At present, account-based data software providers are focused on developments that will afford deeper insights and understanding of data The key companies operating include Terminus, Metadata, Integrate, 6sense, RollWorks, Madison Logic, Triblio, ListenLoop, Jabmo, Demandbase, Mintigo, Radiate B2B, Recotap, Bluebird, Kwanzoo Inc, MRP and IDG Communications, Intuit Inc., Sage Software Inc., SAP SE, Oracle Corporation, Microsoft Corporation.
Some of the recent development in Account-Based Data Software are as follows:
Similarly, recent developments related to companies manufacturing account-based data software have been tracked by the team at Future Market Insights, which is available in the full report.
The global account-based data software market is estimated to be valued at USD 17.8 billion in 2025.
The market size for the account-based data software market is projected to reach USD 37.9 billion by 2035.
The account-based data software market is expected to grow at a 7.8% CAGR between 2025 and 2035.
The key product types in account-based data software market are cloud-based account-based data software and on-premise account-based data software.
In terms of application, large companies segment to command 68.2% share in the account-based data software market in 2025.


Full Research Suite comprises of:
Market outlook & trends analysis
Interviews & case studies
Strategic recommendations
Vendor profiles & capabilities analysis
5-year forecasts
8 regions and 60+ country-level data splits
Market segment data splits
12 months of continuous data updates
DELIVERED AS:
PDF EXCEL ONLINE
Account-Based Advertising Software Market Size and Share Forecast Outlook 2025 to 2035
Account-Based Direct Mail Software Market Size and Share Forecast Outlook 2025 to 2035
DataOps Platform Market Size and Share Forecast Outlook 2025 to 2035
Datacenter Infrastructure Services Market Size and Share Forecast Outlook 2025 to 2035
Data Acquisition Hardware Market Size and Share Forecast Outlook 2025 to 2035
Data Center Automatic Transfer Switches and Switchgears Market Size and Share Forecast Outlook 2025 to 2035
Data Discovery Market Size and Share Forecast Outlook 2025 to 2035
Data Masking Technology Market Size and Share Forecast Outlook 2025 to 2035
Data Centre Rack Server Market Size and Share Forecast Outlook 2025 to 2035
Data Center Power Management Industry Analysis in Western Europe Size and Share Forecast Outlook 2025 to 2035
Data Center Power Management Industry Analysis in Korea Size and Share Forecast Outlook 2025 to 2035
Data Center Liquid Cooling Market Size and Share Forecast Outlook 2025 to 2035
Data Business in Oil & Gas Market Size and Share Forecast Outlook 2025 to 2035
Data Centre Colocation Market Size and Share Forecast Outlook 2025 to 2035
Data Lake Market Size and Share Forecast Outlook 2025 to 2035
Data Center RFID Market Size and Share Forecast Outlook 2025 to 2035
Data Center Accelerator Market Size and Share Forecast Outlook 2025 to 2035
Data Lakehouse Market Size and Share Forecast Outlook 2025 to 2035
Data Center Outsourcing Market Size and Share Forecast Outlook 2025 to 2035
Data Center Refrigerant Market Size and Share Forecast Outlook 2025 to 2035

Thank you!
You will receive an email from our Business Development Manager. Please be sure to check your SPAM/JUNK folder too.
Chat With
MaRIA