Multi Cloud Storage Market
Players Minimize Cost and Reduce the Need for Hardware & Appliances to Drive More Sales of Multi Cloud Storage. Know More Trends.
Multi Cloud Storage Market by Deployment Type, Enterprise Size, Verticals & Region | Forecast 2022 to 2032
Multi Cloud Storage Market Outlook (2022 to 2032)
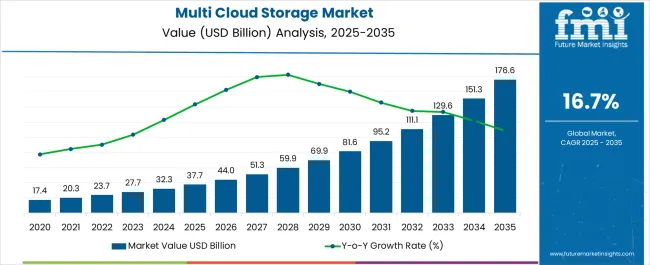
The global multi-cloud storage market is forecasted to be appraised at US$ 111,326.6 Million by 2032, up from US$ 23,711.4 Million in 2022, advancing at a CAGR of 16.7% during the forecast period.
Several enterprises are expected to increase the adoption of multi cloud storage owing to using numerous cloud environments to satisfy business requirements and concerns over increasing data loss. However, there are challenges associated with redesigning the network for the cloud, as well as a prevailing lack of adequate expertise, which are factors expected to hamper the market growth.
Attributes |
Details |
Multi Cloud Storage Market Size (2022) |
US$ 23,711.4 Million |
Multi Cloud Storage Market Size (2032) |
US$ 111,326.6 Million |
Multi Cloud Storage Market CAGR |
16.7% |
On the contrary, key service providers are trying to enter the multi cloud storage management marketplace and maintaining, implementing, and offering support for multiple cloud products, while customization of service and flexibility is anticipated to attract more customers to adopt cloud services on a larger scale. Certain key providers aim to simplify and consolidate hybrid cloud environments for their end users with security-rich, high-performance multi-cloud storage solutions. Their data can be stored in a private environment, and workloads can be managed in the public cloud.
Workloads can further be managed in private data centers, as well as move data in and out of the public cloud. They can be used with traditional applications or modern data lakes. Key players are further offering block storage and rapid scaling for growing volumes of data with a Flash System. Data management can be simplified with AI-driven analytics and hybrid cloud with spectrum virtualized data services. They offer the ability to develop smart applications with embedded machine learning and analyze sensitive data while protecting privacy.
Additionally, high-performance transactional applications and real-time analytics can be built and run at the petabyte scale. Key providers emphasize separating data management and cloud management strategies across multiple public cloud providers, with the user’s data residing on a single power protect appliance consumed as-a-service. Vendor lock-in can be avoided by keeping data independent of the cloud. The data can further be applied to multiple use cases such as replication, cyber resiliency, in-cloud protection, archiving, and disaster recovery to the cloud. Market players are offering the minimization of their end user’s total cost of ownership (TCO) with managed services that eliminate infrastructure maintenance.
Storage can optimize costs based on how frequently and quickly one needs to access data. Most of the top players support more security standards and compliance certifications than any other cloud provider to help customers satisfy requirements for virtually every regulatory agency around the globe. Furthermore, end users can choose from a variety of tools to get more from their data and accelerate new products and service delivery. They can also run big data analytics, artificial intelligence (AI), machine learning (ML), high-performance computing (HPC), and media processing applications on all of their cloud data.
Top providers offer their end users the flexibility to migrate, build and optimize apps across hybrid and multi cloud environments while minimizing vendor lock-in, leveraging best-in-breed solutions, and meeting regulatory requirements. They further empower the end users to increase their agility and reap the benefits of the multi cloud. They offer a consistent platform and data analysis for your deployments, along with a service-centric view of all your environments. Moreover, they aid in reducing security vulnerabilities by implementing guardrails and defense-in-depth security strategies while adhering to the end user’s organization’s governance and compliance requirements. These factors are anticipated to create growth opportunities for the multi cloud storage market share.
Multi cloud storage assists organizations in minimizing costs and reducing the need for hardware and appliances by adopting changing IT environments. Furthermore, governments are enforcing policies and observability on deploying multi cloud storage. It is also durable and has the ability to increase the resiliency of data. These factors are estimated to spark innovations in the multi cloud storage market trends.
Several enterprises are heavily adopting emerging cloud-based platform-as-a-service (PaaS). This helps reduce dependence on a single vendor and provides easy access to end users working on different platforms. In addition, advances in the latest technologies, such as machine learning and AI, along with the continuous rise of high-speed 5G networks, are estimated to boost the global market growth.
Don't pay for what you don't need
Customize your report by selecting specific countries or regions and save 30%!
Pressure to Ensure Compliance & Concerns over Reliability Surging Adoption of Multi-Cloud Storage
Continuous changes presented by the cloud providers in multi-cloud and hybrid environments lead to loss of visibility and loss of synchronization. Therefore, the adoption of multi cloud storage platforms allows users to effectuate all the necessary changes introduced by different cloud and on-premise service providers under a single platform.
There has been increasing pressure to ensure compliance with various data security and privacy protection regulations. Moreover, there have also been concerns over the reliability of a single cloud, as well as a rising predisposition toward price-sensitive cloud installations. These factors are likely to expand the global market size.
End users can employ multi cloud management tools to manage complex applications across several heterogeneous cloud platforms for maximal independence. This removes vendor lock-ins and allows for smooth movement from one provider to another. This is expected to surge the demand for multi cloud storage.
Transferring Workloads & Other Restraints & Revenue Possibilities that Impact the Multi Cloud Storage Market
While transferring workloads from one cloud ecosystem to another, cloud brokers may also face limitations. Hence, once they are designed for or transferred to it, workloads are then bound inside a single public cloud provider. Moreover, cost reductions and moving workloads/applications from location to location in search of the greatest performance are expected to be key impediments to Cloud Services Brokerage (CBS) technology.
Conversely, ISVs are transitioning from software developers to software developers to software providers through the use of visualization and cloud computing to remain competitive. Furthermore, most on-premises suppliers are migrating to the cloud deployment paradigm in order to decrease IT expenses and provide cloud-based products and services.
Find your sweet spots for generating winning opportunities in this market.
Talk to AnalystDeployment of Cloud Services in Different Regions: North America & Europe
North America is the largest multi cloud storage market growing at a notable profit of 41.7%. This is attributed to cloud services transitioning from isolated cloud services to platforms combining on-site, public, and private IaaS. Furthermore, the growing adoption of connected and IoT-enabled devices has driven the demand for innovative solutions based on the latest technologies, as well as the continued rollout of the wireless community. This is likely to expand the global multi cloud storage market size.
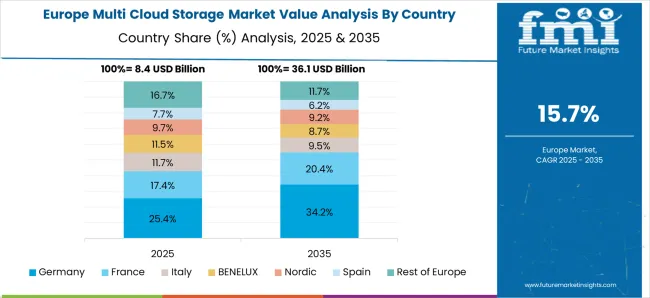
Europe is a growing multi cloud storage market with a revenue of 22.7%. This is owing to its robust connectivity infrastructure, which drives the deployment of cloud services. In addition, to lower the expenses associated with the fixed capacity infrastructure and to leverage cloud-native services to roll out a highly scalable infrastructure using the cloud, a looming migration of workloads to the cloud is effective, particularly in this region.
How Start-up Companies are Contributing to the Multi Cloud Storage Market
Start-up companies have witnessed the growth of multi cloud storage market share, and are contributing to the growth with innovative strategies:
- CloudCheckr - It is a platform that proactively analyzes cloud infrastructure to provide visibility and intelligence to better manage costs, make infrastructure more secure and in compliance, and optimize resources in use. Thousands of enterprises, public sector organizations, and managed service providers rely on CloudCheckr to help manage and govern about US$ 4 Billion in annualized spend for their complex cloud environments.
- Upbound - It offers its range of Internal Cloud Platforms, which enable customers to build, deploy, manage, secure, and consume their very own Internal Cloud Platforms on top of their cloud and on-premises infrastructure already in use. With Upbound, platform teams define custom interfaces like APIs, consoles, and CLIs for developers using the platform to deploy their apps to production.
- Virtana - It is another prominent face in the multi-cloud management landscape. The company offers a range of cloud based products and services for such key end-use verticals as retail, government, financial services, and healthcare. In April 2022, the company announced a new partnership with cloudEQ to help enhance channel momentum and ability to deliver on Financial Operations (FinOps) capabilities through strategic partnerships.
- DivvyCloud - It is a privately held, venture-backed American cybersecurity company with headquarters in Arlington, Virginia. Its core product protects cloud and container environments from misconfigurations, policy violations, threats, and IAM challenges.
Get the data you need at a Fraction of the cost
Personalize your report by choosing insights you need
and save 40%!
Competitive Landscape and Key Developments of the Multi Cloud Storage Market
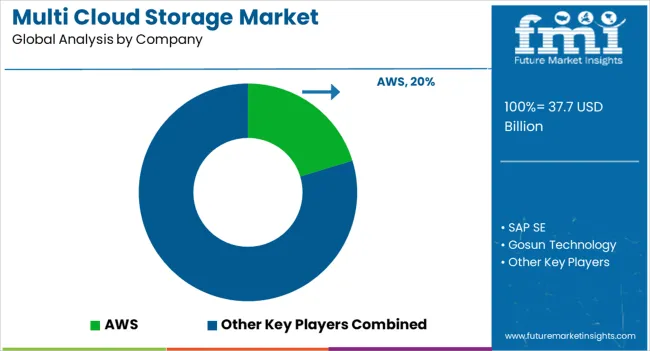
The multi cloud storage market share is bottom fragmented and top consolidated, which is attributed to the presence of some key players obtaining a major block of the market share. The players are often involved in opting for both organic and inorganic growth strategies to expand their geographical presence and their product portfolio.
- In April 2022, Alibaba Cloud teamed with VMware to provide new Alibaba Cloud VMware services in China. This launch has expedited business digital transformation. It allowed businesses to upgrade and transfer apps, as well as shift workloads across VMware and Alibaba's multi-cloud management environments.
- In February 2021, VMware, Inc. upgraded its VMware vRealize Cloud Management on-premises and Software-as-a-Service (SaaS) solutions. Customers' hybrid and multi-cloud infrastructures will be more efficient, secure, and updated as a result of the enhancements.
- In September 2021, VMware, Inc. purchased Mode.net a firm recognized for integrating physically different service underlays into coherent networks that incorporate cloud scale and adaptability with assured QoS and SLAs. The purchase bolstered VMware's portfolio of technology and talents as it continues to supply VMware Telco Cloud Platform to communications service providers throughout the world. Product diversification and enhancements are also expected to be important corporate expansion and growth tactics.
- In May 2022, CoreStack and Ingram Micro Cloud partnered to deliver next-generation solutions for FinOps and Cloud Governance. The CoreStack solutions include CloudOps for cloud management and acceleration, FinOps for cloud cost management (FinOps), and SecOps for cloud security posture management.
KEY MARKET PARTICIPANTS OF THE MULTI CLOUD STORAGE MARKET
- IBM Corporations - It is an American multinational technology corporation headquartered in Armonk, New York, with operations in over 171 countries. It produces and sells computer hardware, middleware, and software, and provides hosting and consulting services in areas ranging from mainframe computers to nanotechnology. IBM is also a major research organization, holding the record for most annual USA patents generated by a business (as of 2021) for 29 consecutive years.
- Google Inc. - It is an American multinational technology company that focuses on search engine technology, online advertising, cloud computing, computer software, quantum computing, e-commerce, artificial intelligence, and consumer electronics.
- Microsoft Corporation - It is an American multinational technology corporation that produces computer software, consumer electronics, personal computers, and related services headquartered at the Microsoft Redmond campus located in Redmond, Washington, United States of America.
- Dell Technologies Inc. - It provides computer products. The company offers laptops, desktops, tablets, workstations, servers, monitors, printers, gateways, software, storage, and networking products. Dell Technologies serves customers worldwide.
- CloudBolt Software Inc. - It is a hybrid cloud management platform developed by CloudBolt Software for deploying and managing virtual machines, applications, and other IT resources, both in public clouds and in private data centers.
OTHER MARKET PLAYERS OF THE MULTI CLOUD STORAGE MARKET
- SAP SE
- AWS
- Gosun Technology
- Nasuni
- Qumulo
- Hewlett Packard Enterprise (HPE)
- EMC
- Flexera Software LLC
- International Business Machines Corporation
- Jamcracker Inc.
- Concierto. cloud
- UnityOneCloud
- VMware Inc.
Scope of the Report
Report Attribute |
Details |
Growth Rate |
CAGR of 16.7% from 2022 to 2032 |
The base year for estimation |
2021 |
Historical data |
2016 to 2021 |
Forecast period |
2022 to 2032 |
Quantitative units |
Revenue in USD million and CAGR from 2022 to 2032 |
Report Coverage |
Revenue forecast, volume forecast, company ranking, competitive landscape, growth factors, and trends, Pricing Analysis |
Segments Covered |
Deployment Type, Enterprise Size, Verticals, and Region. |
Regional scope |
North America; Western Europe, Eastern Europe, Middle East, Africa, ASEAN, South Asia, Rest of Asia, Australia, and New Zealand |
Country scope |
USA; Canada; Mexico; Germany; United Kingdom; France; Italy; Spain; Russia; Belgium; Poland; Czech Republic; China; India; Japan; Australia; Brazil; Argentina; Colombia; Saudi Arabia; United Arab Emirates(UAE); Iran; South Africa |
Key companies profiled |
IBM Corp., Google Inc., Microsoft Corporation, Dell Technologies Inc., CloudBolt Software Inc., SAP SE, AWS, Gosun Technology, Nasuni, Qumule, HPE, EMC, Flexera Software LLC, International Business Machines Corporation, Jamcracker Inc., Concierto.cloud, UnityOneCloud, VMware Inc., etc. |
Customization scope |
Free report customization (equivalent to up to 8 analysts' working days) with purchase. Addition or alteration to country, regional & segment scope. |
Pricing and purchase options |
Avail customized purchase options to meet your exact research needs. |
Key Segments Profiled in the Multi Cloud Storage Market Survey
By Deployment Type:
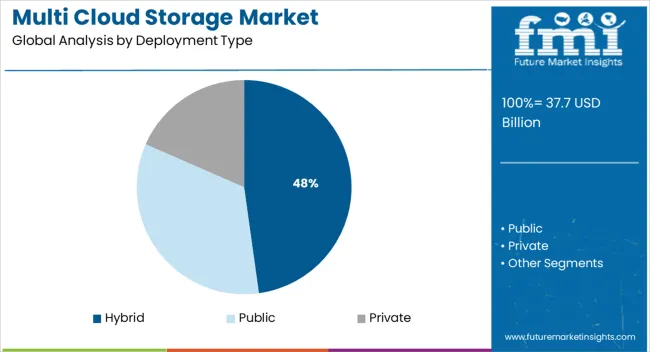
- Public
- Private
- Hybrid
By Enterprise Size:
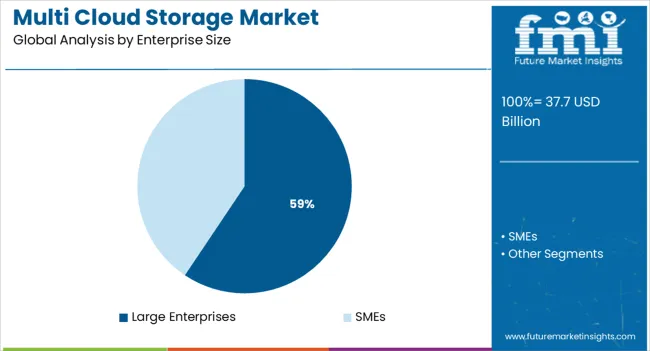
- SMEs
- Large Enterprises
By Verticals:
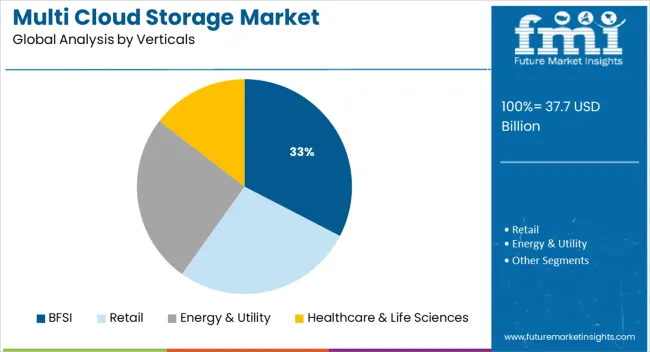
- BFSI
- Retail
- Energy & Utility
- Healthcare & Life Sciences
By Region:
- North America
- Latin America
- Asia Pacific
- Middle East and Africa(MEA)
- Europe
Frequently Asked Questions
How much CAGR can be Approximated for the Multi Cloud Storage Market?
The multi cloud storage market is likely to accumulate a CAGR of 4.6%, during the forecast period.
What is the Leading Regional Market of Multi Cloud Storage?
North America is the leading multi cloud storage market with a revenue of 41.7%.
What will be the Size of the Multi Cloud Storage Market by 2032?
By 2032, the multi cloud storage market is likely to grow to a valuation of US$ 111,326.6 Million.
Table of Content
1. Executive Summary | Multi Cloud Storage Market 1.1. Global Market Outlook 1.2. Demand-side Trends 1.3. Supply-side Trends 1.4. Technology Roadmap Analysis 1.5. Analysis and Recommendations 2. Market Overview 2.1. Market Coverage / Taxonomy 2.2. Market Definition / Scope / Limitations 3. Market Background 3.1. Market Dynamics 3.1.1. Drivers 3.1.2. Restraints 3.1.3. Opportunity 3.1.4. Trends 3.2. Scenario Forecast 3.2.1. Demand in Optimistic Scenario 3.2.2. Demand in Likely Scenario 3.2.3. Demand in Conservative Scenario 3.3. Opportunity Map Analysis 3.4. Investment Feasibility Matrix 3.5. PESTLE and Porter’s Analysis 3.6. Regulatory Landscape 3.6.1. By Key Regions 3.6.2. By Key Countries 3.7. Regional Parent Market Outlook 4. Global Market Analysis 2017 to 2021 and Forecast, 2022 to 2032 4.1. Historical Market Size Value (US$ Million) Analysis, 2017 to 2021 4.2. Current and Future Market Size Value (US$ Million) Projections, 2022 to 2032 4.2.1. Y-o-Y Growth Trend Analysis 4.2.2. Absolute $ Opportunity Analysis 5. Global Market Analysis 2017 to 2021 and Forecast 2022 to 2032, By Deployment Type 5.1. Introduction / Key Findings 5.2. Historical Market Size Value (US$ Million) Analysis By Deployment Type, 2017 to 2021 5.3. Current and Future Market Size Value (US$ Million) Analysis and Forecast By Deployment Type, 2022 to 2032 5.3.1. Public 5.3.2. Private 5.3.3. Hybrid 5.4. Y-o-Y Growth Trend Analysis By Deployment Type, 2017 to 2021 5.5. Absolute $ Opportunity Analysis By Deployment Type, 2022 to 2032 6. Global Market Analysis 2017 to 2021 and Forecast 2022 to 2032, By Enterprise Size 6.1. Introduction / Key Findings 6.2. Historical Market Size Value (US$ Million) Analysis By Enterprise Size, 2017 to 2021 6.3. Current and Future Market Size Value (US$ Million) Analysis and Forecast By Enterprise Size, 2022 to 2032 6.3.1. Small and Medium Enterprises 6.3.2. Large Enterprises 6.4. Y-o-Y Growth Trend Analysis By Enterprise Size, 2017 to 2021 6.5. Absolute $ Opportunity Analysis By Enterprise Size, 2022 to 2032 7. Global Market Analysis 2017 to 2021 and Forecast 2022 to 2032, By Verticals 7.1. Introduction / Key Findings 7.2. Historical Market Size Value (US$ Million) Analysis By Verticals, 2017 to 2021 7.3. Current and Future Market Size Value (US$ Million) Analysis and Forecast By Verticals, 2022 to 2032 7.3.1. BFSI 7.3.2. Retail 7.3.3. Energy and Utility 7.3.4. Health Care and Life Science 7.4. Y-o-Y Growth Trend Analysis By Verticals, 2017 to 2021 7.5. Absolute $ Opportunity Analysis By Verticals, 2022 to 2032 8. Global Market Analysis 2017 to 2021 and Forecast 2022 to 2032, By Region 8.1. Introduction 8.2. Historical Market Size Value (US$ Million) Analysis By Region, 2017 to 2021 8.3. Current Market Size Value (US$ Million) Analysis and Forecast By Region, 2022 to 2032 8.3.1. North America 8.3.2. Latin America 8.3.3. Europe 8.3.4. Asia Pacific 8.3.5. Middle East and Africa(MEA) 8.4. Market Attractiveness Analysis By Region 9. North America Market Analysis 2017 to 2021 and Forecast 2022 to 2032, By Country 9.1. Historical Market Size Value (US$ Million) Trend Analysis By Market Taxonomy, 2017 to 2021 9.2. Market Size Value (US$ Million) Forecast By Market Taxonomy, 2022 to 2032 9.2.1. By Country 9.2.1.1. United Kingdom 9.2.1.2. Canada 9.2.2. By Deployment Type 9.2.3. By Enterprise Size 9.2.4. By Verticals 9.3. Market Attractiveness Analysis 9.3.1. By Country 9.3.2. By Deployment Type 9.3.3. By Enterprise Size 9.3.4. By Verticals 9.4. Key Takeaways 10. Latin America Market Analysis 2017 to 2021 and Forecast 2022 to 2032, By Country 10.1. Historical Market Size Value (US$ Million) Trend Analysis By Market Taxonomy, 2017 to 2021 10.2. Market Size Value (US$ Million) Forecast By Market Taxonomy, 2022 to 2032 10.2.1. By Country 10.2.1.1. Brazil 10.2.1.2. Mexico 10.2.1.3. Rest of Latin America 10.2.2. By Deployment Type 10.2.3. By Enterprise Size 10.2.4. By Verticals 10.3. Market Attractiveness Analysis 10.3.1. By Country 10.3.2. By Deployment Type 10.3.3. By Enterprise Size 10.3.4. By Verticals 10.4. Key Takeaways 11. Europe Market Analysis 2017 to 2021 and Forecast 2022 to 2032, By Country 11.1. Historical Market Size Value (US$ Million) Trend Analysis By Market Taxonomy, 2017 to 2021 11.2. Market Size Value (US$ Million) Forecast By Market Taxonomy, 2022 to 2032 11.2.1. By Country 11.2.1.1. Germany 11.2.1.2. United Kingdom 11.2.1.3. France 11.2.1.4. Spain 11.2.1.5. Italy 11.2.1.6. Rest of Europe 11.2.2. By Deployment Type 11.2.3. By Enterprise Size 11.2.4. By Verticals 11.3. Market Attractiveness Analysis 11.3.1. By Country 11.3.2. By Deployment Type 11.3.3. By Enterprise Size 11.3.4. By Verticals 11.4. Key Takeaways 12. Asia Pacific Market Analysis 2017 to 2021 and Forecast 2022 to 2032, By Country 12.1. Historical Market Size Value (US$ Million) Trend Analysis By Market Taxonomy, 2017 to 2021 12.2. Market Size Value (US$ Million) Forecast By Market Taxonomy, 2022 to 2032 12.2.1. By Country 12.2.1.1. China 12.2.1.2. Japan 12.2.1.3. South Korea 12.2.1.4. Malaysia 12.2.1.5. Singapore 12.2.1.6. Australia 12.2.1.7. Rest of Asia Pacific 12.2.2. By Deployment Type 12.2.3. By Enterprise Size 12.2.4. By Verticals 12.3. Market Attractiveness Analysis 12.3.1. By Country 12.3.2. By Deployment Type 12.3.3. By Enterprise Size 12.3.4. By Verticals 12.4. Key Takeaways 13. MEA Market Analysis 2017 to 2021 and Forecast 2022 to 2032, By Country 13.1. Historical Market Size Value (US$ Million) Trend Analysis By Market Taxonomy, 2017 to 2021 13.2. Market Size Value (US$ Million) Forecast By Market Taxonomy, 2022 to 2032 13.2.1. By Country 13.2.1.1. GCC Countries 13.2.1.2. South Africa 13.2.1.3. Israel 13.2.1.4. Rest of Middle East and Africa(MEA) 13.2.2. By Deployment Type 13.2.3. By Enterprise Size 13.2.4. By Verticals 13.3. Market Attractiveness Analysis 13.3.1. By Country 13.3.2. By Deployment Type 13.3.3. By Enterprise Size 13.3.4. By Verticals 13.4. Key Takeaways 14. Key Countries Market Analysis 14.1. United Kingdom 14.1.1. Pricing Analysis 14.1.2. Market Share Analysis, 2021 14.1.2.1. By Deployment Type 14.1.2.2. By Enterprise Size 14.1.2.3. By Verticals 14.2. Canada 14.2.1. Pricing Analysis 14.2.2. Market Share Analysis, 2021 14.2.2.1. By Deployment Type 14.2.2.2. By Enterprise Size 14.2.2.3. By Verticals 14.3. Brazil 14.3.1. Pricing Analysis 14.3.2. Market Share Analysis, 2021 14.3.2.1. By Deployment Type 14.3.2.2. By Enterprise Size 14.3.2.3. By Verticals 14.4. Mexico 14.4.1. Pricing Analysis 14.4.2. Market Share Analysis, 2021 14.4.2.1. By Deployment Type 14.4.2.2. By Enterprise Size 14.4.2.3. By Verticals 14.5. Rest of Latin America 14.5.1. Pricing Analysis 14.5.2. Market Share Analysis, 2021 14.5.2.1. By Deployment Type 14.5.2.2. By Enterprise Size 14.5.2.3. By Verticals 14.6. Germany 14.6.1. Pricing Analysis 14.6.2. Market Share Analysis, 2021 14.6.2.1. By Deployment Type 14.6.2.2. By Enterprise Size 14.6.2.3. By Verticals 14.7. United Kingdom 14.7.1. Pricing Analysis 14.7.2. Market Share Analysis, 2021 14.7.2.1. By Deployment Type 14.7.2.2. By Enterprise Size 14.7.2.3. By Verticals 14.8. France 14.8.1. Pricing Analysis 14.8.2. Market Share Analysis, 2021 14.8.2.1. By Deployment Type 14.8.2.2. By Enterprise Size 14.8.2.3. By Verticals 14.9. Spain 14.9.1. Pricing Analysis 14.9.2. Market Share Analysis, 2021 14.9.2.1. By Deployment Type 14.9.2.2. By Enterprise Size 14.9.2.3. By Verticals 14.10. Italy 14.10.1. Pricing Analysis 14.10.2. Market Share Analysis, 2021 14.10.2.1. By Deployment Type 14.10.2.2. By Enterprise Size 14.10.2.3. By Verticals 14.11. Rest of Europe 14.11.1. Pricing Analysis 14.11.2. Market Share Analysis, 2021 14.11.2.1. By Deployment Type 14.11.2.2. By Enterprise Size 14.11.2.3. By Verticals 14.12. China 14.12.1. Pricing Analysis 14.12.2. Market Share Analysis, 2021 14.12.2.1. By Deployment Type 14.12.2.2. By Enterprise Size 14.12.2.3. By Verticals 14.13. Japan 14.13.1. Pricing Analysis 14.13.2. Market Share Analysis, 2021 14.13.2.1. By Deployment Type 14.13.2.2. By Enterprise Size 14.13.2.3. By Verticals 14.14. South Korea 14.14.1. Pricing Analysis 14.14.2. Market Share Analysis, 2021 14.14.2.1. By Deployment Type 14.14.2.2. By Enterprise Size 14.14.2.3. By Verticals 14.15. Malaysia 14.15.1. Pricing Analysis 14.15.2. Market Share Analysis, 2021 14.15.2.1. By Deployment Type 14.15.2.2. By Enterprise Size 14.15.2.3. By Verticals 14.16. Singapore 14.16.1. Pricing Analysis 14.16.2. Market Share Analysis, 2021 14.16.2.1. By Deployment Type 14.16.2.2. By Enterprise Size 14.16.2.3. By Verticals 14.17. Australia 14.17.1. Pricing Analysis 14.17.2. Market Share Analysis, 2021 14.17.2.1. By Deployment Type 14.17.2.2. By Enterprise Size 14.17.2.3. By Verticals 14.18. Rest of Asia Pacific 14.18.1. Pricing Analysis 14.18.2. Market Share Analysis, 2021 14.18.2.1. By Deployment Type 14.18.2.2. By Enterprise Size 14.18.2.3. By Verticals 14.19. GCC Countries 14.19.1. Pricing Analysis 14.19.2. Market Share Analysis, 2021 14.19.2.1. By Deployment Type 14.19.2.2. By Enterprise Size 14.19.2.3. By Verticals 14.20. South Africa 14.20.1. Pricing Analysis 14.20.2. Market Share Analysis, 2021 14.20.2.1. By Deployment Type 14.20.2.2. By Enterprise Size 14.20.2.3. By Verticals 14.21. Israel 14.21.1. Pricing Analysis 14.21.2. Market Share Analysis, 2021 14.21.2.1. By Deployment Type 14.21.2.2. By Enterprise Size 14.21.2.3. By Verticals 14.22. Rest of the Middle East and Africa(MEA) 14.22.1. Pricing Analysis 14.22.2. Market Share Analysis, 2021 14.22.2.1. By Deployment Type 14.22.2.2. By Enterprise Size 14.22.2.3. By Verticals 15. Market Structure Analysis 15.1. Competition Dashboard 15.2. Competition Benchmarking 15.3. Market Share Analysis of Top Players 15.3.1. By Regional 15.3.2. By Deployment Type 15.3.3. By Enterprise Size 15.3.4. By Verticals 16. Competition Analysis 16.1. Competition Deep Dive 16.1.1. IBM Corp. 16.1.1.1. Overview 16.1.1.2. Product Portfolio 16.1.1.3. Profitability by Market Segments 16.1.1.4. Sales Footprint 16.1.1.5. Strategy Overview 16.1.1.5.1. Marketing Strategy 16.1.2. SAP SE 16.1.2.1. Overview 16.1.2.2. Product Portfolio 16.1.2.3. Profitability by Market Segments 16.1.2.4. Sales Footprint 16.1.2.5. Strategy Overview 16.1.2.5.1. Marketing Strategy 16.1.3. Microsoft Corp. 16.1.3.1. Overview 16.1.3.2. Product Portfolio 16.1.3.3. Profitability by Market Segments 16.1.3.4. Sales Footprint 16.1.3.5. Strategy Overview 16.1.3.5.1. Marketing Strategy 16.1.4. Gosun Technology 16.1.4.1. Overview 16.1.4.2. Product Portfolio 16.1.4.3. Profitability by Market Segments 16.1.4.4. Sales Footprint 16.1.4.5. Strategy Overview 16.1.4.5.1. Marketing Strategy 16.1.5. Google 16.1.5.1. Overview 16.1.5.2. Product Portfolio 16.1.5.3. Profitability by Market Segments 16.1.5.4. Sales Footprint 16.1.5.5. Strategy Overview 16.1.5.5.1. Marketing Strategy 16.1.6. VMware 16.1.6.1. Overview 16.1.6.2. Product Portfolio 16.1.6.3. Profitability by Market Segments 16.1.6.4. Sales Footprint 16.1.6.5. Strategy Overview 16.1.6.5.1. Marketing Strategy 16.1.7. EMC 16.1.7.1. Overview 16.1.7.2. Product Portfolio 16.1.7.3. Profitability by Market Segments 16.1.7.4. Sales Footprint 16.1.7.5. Strategy Overview 16.1.7.5.1. Marketing Strategy 17. Assumptions & Acronyms Used 18. Research Methodology
Don't pay for what you don't need
Customize your report by selecting specific countries or regions and save 30%!
List of Tables
Table 1: Global Market Value (US$ Million) Forecast by Region, 2017 to 2032 Table 2: Global Market Value (US$ Million) Forecast by Deployment Type, 2017 to 2032 Table 3: Global Market Value (US$ Million) Forecast by Enterprise Size, 2017 to 2032 Table 4: Global Market Value (US$ Million) Forecast by Verticals, 2017 to 2032 Table 5: North America Market Value (US$ Million) Forecast by Country, 2017 to 2032 Table 6: North America Market Value (US$ Million) Forecast by Deployment Type, 2017 to 2032 Table 7: North America Market Value (US$ Million) Forecast by Enterprise Size, 2017 to 2032 Table 8: North America Market Value (US$ Million) Forecast by Verticals, 2017 to 2032 Table 9: Latin America Market Value (US$ Million) Forecast by Country, 2017 to 2032 Table 10: Latin America Market Value (US$ Million) Forecast by Deployment Type, 2017 to 2032 Table 11: Latin America Market Value (US$ Million) Forecast by Enterprise Size, 2017 to 2032 Table 12: Latin America Market Value (US$ Million) Forecast by Verticals, 2017 to 2032 Table 13: Europe Market Value (US$ Million) Forecast by Country, 2017 to 2032 Table 14: Europe Market Value (US$ Million) Forecast by Deployment Type, 2017 to 2032 Table 15: Europe Market Value (US$ Million) Forecast by Enterprise Size, 2017 to 2032 Table 16: Europe Market Value (US$ Million) Forecast by Verticals, 2017 to 2032 Table 17: Asia Pacific Market Value (US$ Million) Forecast by Country, 2017 to 2032 Table 18: Asia Pacific Market Value (US$ Million) Forecast by Deployment Type, 2017 to 2032 Table 19: Asia Pacific Market Value (US$ Million) Forecast by Enterprise Size, 2017 to 2032 Table 20: Asia Pacific Market Value (US$ Million) Forecast by Verticals, 2017 to 2032 Table 21: MEA Market Value (US$ Million) Forecast by Country, 2017 to 2032 Table 22: MEA Market Value (US$ Million) Forecast by Deployment Type, 2017 to 2032 Table 23: MEA Market Value (US$ Million) Forecast by Enterprise Size, 2017 to 2032 Table 24: MEA Market Value (US$ Million) Forecast by Verticals, 2017 to 2032
Find your sweet spots for generating winning opportunities in this market.
Talk to AnalystList of Charts
Figure 1: Global Market Value (US$ Million) by Deployment Type, 2022 to 2032 Figure 2: Global Market Value (US$ Million) by Enterprise Size, 2022 to 2032 Figure 3: Global Market Value (US$ Million) by Verticals, 2022 to 2032 Figure 4: Global Market Value (US$ Million) by Region, 2022 to 2032 Figure 5: Global Market Value (US$ Million) Analysis by Region, 2017 to 2032 Figure 6: Global Market Value Share (%) and BPS Analysis by Region, 2022 to 2032 Figure 7: Global Market Y-o-Y Growth (%) Projections by Region, 2022 to 2032 Figure 8: Global Market Value (US$ Million) Analysis by Deployment Type, 2017 to 2032 Figure 9: Global Market Value Share (%) and BPS Analysis by Deployment Type, 2022 to 2032 Figure 10: Global Market Y-o-Y Growth (%) Projections by Deployment Type, 2022 to 2032 Figure 11: Global Market Value (US$ Million) Analysis by Enterprise Size, 2017 to 2032 Figure 12: Global Market Value Share (%) and BPS Analysis by Enterprise Size, 2022 to 2032 Figure 13: Global Market Y-o-Y Growth (%) Projections by Enterprise Size, 2022 to 2032 Figure 14: Global Market Value (US$ Million) Analysis by Verticals, 2017 to 2032 Figure 15: Global Market Value Share (%) and BPS Analysis by Verticals, 2022 to 2032 Figure 16: Global Market Y-o-Y Growth (%) Projections by Verticals, 2022 to 2032 Figure 17: Global Market Attractiveness by Deployment Type, 2022 to 2032 Figure 18: Global Market Attractiveness by Enterprise Size, 2022 to 2032 Figure 19: Global Market Attractiveness by Verticals, 2022 to 2032 Figure 20: Global Market Attractiveness by Region, 2022 to 2032 Figure 21: North America Market Value (US$ Million) by Deployment Type, 2022 to 2032 Figure 22: North America Market Value (US$ Million) by Enterprise Size, 2022 to 2032 Figure 23: North America Market Value (US$ Million) by Verticals, 2022 to 2032 Figure 24: North America Market Value (US$ Million) by Country, 2022 to 2032 Figure 25: North America Market Value (US$ Million) Analysis by Country, 2017 to 2032 Figure 26: North America Market Value Share (%) and BPS Analysis by Country, 2022 to 2032 Figure 27: North America Market Y-o-Y Growth (%) Projections by Country, 2022 to 2032 Figure 28: North America Market Value (US$ Million) Analysis by Deployment Type, 2017 to 2032 Figure 29: North America Market Value Share (%) and BPS Analysis by Deployment Type, 2022 to 2032 Figure 30: North America Market Y-o-Y Growth (%) Projections by Deployment Type, 2022 to 2032 Figure 31: North America Market Value (US$ Million) Analysis by Enterprise Size, 2017 to 2032 Figure 32: North America Market Value Share (%) and BPS Analysis by Enterprise Size, 2022 to 2032 Figure 33: North America Market Y-o-Y Growth (%) Projections by Enterprise Size, 2022 to 2032 Figure 34: North America Market Value (US$ Million) Analysis by Verticals, 2017 to 2032 Figure 35: North America Market Value Share (%) and BPS Analysis by Verticals, 2022 to 2032 Figure 36: North America Market Y-o-Y Growth (%) Projections by Verticals, 2022 to 2032 Figure 37: North America Market Attractiveness by Deployment Type, 2022 to 2032 Figure 38: North America Market Attractiveness by Enterprise Size, 2022 to 2032 Figure 39: North America Market Attractiveness by Verticals, 2022 to 2032 Figure 40: North America Market Attractiveness by Country, 2022 to 2032 Figure 41: Latin America Market Value (US$ Million) by Deployment Type, 2022 to 2032 Figure 42: Latin America Market Value (US$ Million) by Enterprise Size, 2022 to 2032 Figure 43: Latin America Market Value (US$ Million) by Verticals, 2022 to 2032 Figure 44: Latin America Market Value (US$ Million) by Country, 2022 to 2032 Figure 45: Latin America Market Value (US$ Million) Analysis by Country, 2017 to 2032 Figure 46: Latin America Market Value Share (%) and BPS Analysis by Country, 2022 to 2032 Figure 47: Latin America Market Y-o-Y Growth (%) Projections by Country, 2022 to 2032 Figure 48: Latin America Market Value (US$ Million) Analysis by Deployment Type, 2017 to 2032 Figure 49: Latin America Market Value Share (%) and BPS Analysis by Deployment Type, 2022 to 2032 Figure 50: Latin America Market Y-o-Y Growth (%) Projections by Deployment Type, 2022 to 2032 Figure 51: Latin America Market Value (US$ Million) Analysis by Enterprise Size, 2017 to 2032 Figure 52: Latin America Market Value Share (%) and BPS Analysis by Enterprise Size, 2022 to 2032 Figure 53: Latin America Market Y-o-Y Growth (%) Projections by Enterprise Size, 2022 to 2032 Figure 54: Latin America Market Value (US$ Million) Analysis by Verticals, 2017 to 2032 Figure 55: Latin America Market Value Share (%) and BPS Analysis by Verticals, 2022 to 2032 Figure 56: Latin America Market Y-o-Y Growth (%) Projections by Verticals, 2022 to 2032 Figure 57: Latin America Market Attractiveness by Deployment Type, 2022 to 2032 Figure 58: Latin America Market Attractiveness by Enterprise Size, 2022 to 2032 Figure 59: Latin America Market Attractiveness by Verticals, 2022 to 2032 Figure 60: Latin America Market Attractiveness by Country, 2022 to 2032 Figure 61: Europe Market Value (US$ Million) by Deployment Type, 2022 to 2032 Figure 62: Europe Market Value (US$ Million) by Enterprise Size, 2022 to 2032 Figure 63: Europe Market Value (US$ Million) by Verticals, 2022 to 2032 Figure 64: Europe Market Value (US$ Million) by Country, 2022 to 2032 Figure 65: Europe Market Value (US$ Million) Analysis by Country, 2017 to 2032 Figure 66: Europe Market Value Share (%) and BPS Analysis by Country, 2022 to 2032 Figure 67: Europe Market Y-o-Y Growth (%) Projections by Country, 2022 to 2032 Figure 68: Europe Market Value (US$ Million) Analysis by Deployment Type, 2017 to 2032 Figure 69: Europe Market Value Share (%) and BPS Analysis by Deployment Type, 2022 to 2032 Figure 70: Europe Market Y-o-Y Growth (%) Projections by Deployment Type, 2022 to 2032 Figure 71: Europe Market Value (US$ Million) Analysis by Enterprise Size, 2017 to 2032 Figure 72: Europe Market Value Share (%) and BPS Analysis by Enterprise Size, 2022 to 2032 Figure 73: Europe Market Y-o-Y Growth (%) Projections by Enterprise Size, 2022 to 2032 Figure 74: Europe Market Value (US$ Million) Analysis by Verticals, 2017 to 2032 Figure 75: Europe Market Value Share (%) and BPS Analysis by Verticals, 2022 to 2032 Figure 76: Europe Market Y-o-Y Growth (%) Projections by Verticals, 2022 to 2032 Figure 77: Europe Market Attractiveness by Deployment Type, 2022 to 2032 Figure 78: Europe Market Attractiveness by Enterprise Size, 2022 to 2032 Figure 79: Europe Market Attractiveness by Verticals, 2022 to 2032 Figure 80: Europe Market Attractiveness by Country, 2022 to 2032 Figure 81: Asia Pacific Market Value (US$ Million) by Deployment Type, 2022 to 2032 Figure 82: Asia Pacific Market Value (US$ Million) by Enterprise Size, 2022 to 2032 Figure 83: Asia Pacific Market Value (US$ Million) by Verticals, 2022 to 2032 Figure 84: Asia Pacific Market Value (US$ Million) by Country, 2022 to 2032 Figure 85: Asia Pacific Market Value (US$ Million) Analysis by Country, 2017 to 2032 Figure 86: Asia Pacific Market Value Share (%) and BPS Analysis by Country, 2022 to 2032 Figure 87: Asia Pacific Market Y-o-Y Growth (%) Projections by Country, 2022 to 2032 Figure 88: Asia Pacific Market Value (US$ Million) Analysis by Deployment Type, 2017 to 2032 Figure 89: Asia Pacific Market Value Share (%) and BPS Analysis by Deployment Type, 2022 to 2032 Figure 90: Asia Pacific Market Y-o-Y Growth (%) Projections by Deployment Type, 2022 to 2032 Figure 91: Asia Pacific Market Value (US$ Million) Analysis by Enterprise Size, 2017 to 2032 Figure 92: Asia Pacific Market Value Share (%) and BPS Analysis by Enterprise Size, 2022 to 2032 Figure 93: Asia Pacific Market Y-o-Y Growth (%) Projections by Enterprise Size, 2022 to 2032 Figure 94: Asia Pacific Market Value (US$ Million) Analysis by Verticals, 2017 to 2032 Figure 95: Asia Pacific Market Value Share (%) and BPS Analysis by Verticals, 2022 to 2032 Figure 96: Asia Pacific Market Y-o-Y Growth (%) Projections by Verticals, 2022 to 2032 Figure 97: Asia Pacific Market Attractiveness by Deployment Type, 2022 to 2032 Figure 98: Asia Pacific Market Attractiveness by Enterprise Size, 2022 to 2032 Figure 99: Asia Pacific Market Attractiveness by Verticals, 2022 to 2032 Figure 100: Asia Pacific Market Attractiveness by Country, 2022 to 2032 Figure 101: MEA Market Value (US$ Million) by Deployment Type, 2022 to 2032 Figure 102: MEA Market Value (US$ Million) by Enterprise Size, 2022 to 2032 Figure 103: MEA Market Value (US$ Million) by Verticals, 2022 to 2032 Figure 104: MEA Market Value (US$ Million) by Country, 2022 to 2032 Figure 105: MEA Market Value (US$ Million) Analysis by Country, 2017 to 2032 Figure 106: MEA Market Value Share (%) and BPS Analysis by Country, 2022 to 2032 Figure 107: MEA Market Y-o-Y Growth (%) Projections by Country, 2022 to 2032 Figure 108: MEA Market Value (US$ Million) Analysis by Deployment Type, 2017 to 2032 Figure 109: MEA Market Value Share (%) and BPS Analysis by Deployment Type, 2022 to 2032 Figure 110: MEA Market Y-o-Y Growth (%) Projections by Deployment Type, 2022 to 2032 Figure 111: MEA Market Value (US$ Million) Analysis by Enterprise Size, 2017 to 2032 Figure 112: MEA Market Value Share (%) and BPS Analysis by Enterprise Size, 2022 to 2032 Figure 113: MEA Market Y-o-Y Growth (%) Projections by Enterprise Size, 2022 to 2032 Figure 114: MEA Market Value (US$ Million) Analysis by Verticals, 2017 to 2032 Figure 115: MEA Market Value Share (%) and BPS Analysis by Verticals, 2022 to 2032 Figure 116: MEA Market Y-o-Y Growth (%) Projections by Verticals, 2022 to 2032 Figure 117: MEA Market Attractiveness by Deployment Type, 2022 to 2032 Figure 118: MEA Market Attractiveness by Enterprise Size, 2022 to 2032 Figure 119: MEA Market Attractiveness by Verticals, 2022 to 2032 Figure 120: MEA Market Attractiveness by Country, 2022 to 2032
Recommendations
Explore Technology Insights
View Reports