The biopharmaceutical fermentation excipients market is projected to grow from USD 4,485.5 million in 2025 to approximately USD 9,864.7 million by 2035, recording an absolute increase of USD 5,379.2 million over the forecast period. This translates into a total growth of 119.9%, with the market forecast to expand at a compound annual growth rate (CAGR) of 8.2% between 2025 and 2035.
The overall market size is expected to grow by 2.2X during the same period, supported by increasing demand for advanced biopharmaceutical production technologies, growing prevalence of biologic drugs, and rising adoption of fermentation processes across the global pharmaceutical and biotechnology sectors.
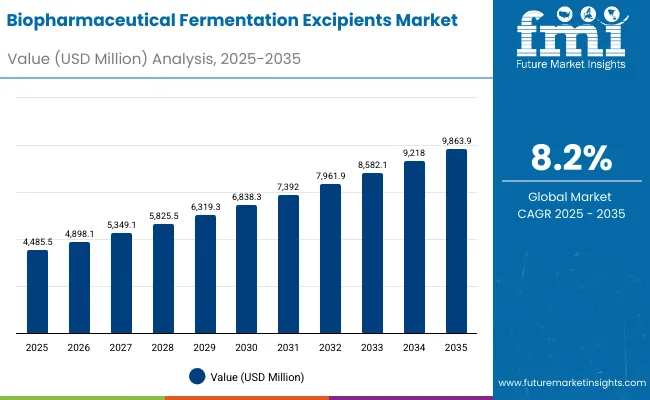
Biopharmaceutical Fermentation Excipients Market Key Takeaways
| Metric | Value |
|---|---|
| Estimated Value in (2025E) | USD 4,485.5 million |
| Forecast Value in (2035F) | USD 9,864.7 million |
| Forecast CAGR (2025 to 2035) | 8.2% |
Between 2025 and 2030, the biopharmaceutical fermentation excipients market is projected to expand from USD 4,485.5 million to USD 6,651.9 million, resulting in a value increase of USD 2,166.4 million, which represents 40.3% of the total forecast growth for the decade. This phase of development will be shaped by increasing biologic drug development, rising demand for cell culture technologies, and growing utilization in pharmaceutical manufacturing applications. Pharmaceutical manufacturers and biotechnology companies are expanding their fermentation capabilities to address the growing preference for advanced bioprocessing solutions in drug development and production systems.
From 2030 to 2035, the market is forecast to grow from USD 6,651.9 million to USD 9,864.7 million, adding another USD 3,212.8 million, which constitutes 59.7% of the overall ten-year expansion. This period is expected to be characterized by the expansion of advanced bioprocessing technologies, the integration of AI-powered fermentation monitoring systems for premium biopharmaceutical products, and the development of enhanced cell culture media formulations for specialized applications. The growing emphasis on personalized medicine and biosimilar development will drive demand for sophisticated fermentation excipients with enhanced performance capabilities and improved production efficiency.
Between 2020 and 2024, the biopharmaceutical fermentation excipients market experienced steady growth at a CAGR of 6.4%, driven by increasing biopharmaceutical development and growing recognition of advanced fermentation technologies' superior production capabilities across pharmaceutical and biotechnology applications. The market developed as manufacturers recognized the potential for fermentation excipients to enhance drug production efficiency while meeting modern pharmaceutical requirements for quality, scalability, and cost-effectiveness. Technological advancement in cell culture media and bioprocessing optimization began emphasizing the critical importance of maintaining production consistency while improving yield and reducing manufacturing costs.
The biopharmaceutical fermentation excipients market represents a rapidly expanding biotechnology opportunity at the intersection of pharmaceutical innovation, biologic drug development, and advanced bioprocessing technology, with the market projected to expand from USD 4,485.5 million in 2025 to USD 9,864.7 million by 2035 at a robust 8.2% CAGR-a 2.2X growth driven by accelerating biologic drug adoption, pharmaceutical demand for superior production efficiency, and the integration of advanced fermentation technologies into therapeutic manufacturing workflows.
This convergence opportunity leverages the critical need for high-quality biologic production, the pharmaceutical industry's shift toward complex therapeutics, and advances in cell culture technology to create manufacturing solutions that offer superior production control in biopharmaceutical development applications. Cell-culture media & feeds lead with 46.6% market share due to their essential role in cell growth support and nutrient delivery, while mammalian cell fermentation applications dominate demand as pharmaceutical companies increasingly adopt biologics and personalized medicine approaches. Geographic growth is strongest in China (7.2% CAGR) and UK (6.8% CAGR), where biopharmaceutical infrastructure development and biotechnology investment create ideal market conditions.
Pathway A - Cell-culture Media & Feeds Technology Leadership
The dominant product category offers superior cell growth support, consistent nutrient delivery, and scalable performance essential for biopharmaceutical manufacturing. Companies developing advanced media formulations with enhanced cell productivity, improved consistency, and optimized cost structures will capture the leading technology segment. Expected revenue pool: USD 4,200-5,100 million.
Pathway B - Mammalian Cell Fermentation Application Focus
The largest application segment benefits from growing biologic drug development, monoclonal antibody production, and therapeutic protein manufacturing requirements. Providers developing comprehensive mammalian cell solutions with integrated bioprocessing platforms, quality control systems, and scalability features will dominate this primary market. Opportunity: USD 5,200-6,300 million.
Pathway C - Advanced Bioprocessing Integration and Automation
Next-generation products require sophisticated manufacturing capabilities for complex biologics, continuous processing, and real-time monitoring applications. Companies investing in AI-powered fermentation systems, process analytics, and automated quality control will create competitive differentiation and premium positioning. Revenue uplift: USD 1,800-2,700 million.
Pathway D - Geographic Expansion in High-Growth Markets
China and UK's biopharmaceutical infrastructure development and biotechnology investment create substantial opportunities. Local manufacturing partnerships, regulatory expertise, and cost-effective production strategies enable market penetration in these high-growth regions. Pool: USD 1,500-2,200 million.
Pathway E - Contract Development and Manufacturing (CDMO/CMO) Services
Modern pharmaceutical companies increasingly outsource specialized fermentation requirements to focus on core drug development. Developing integrated service platforms with custom formulation capabilities, regulatory support, and manufacturing excellence addresses growing outsourcing demands while reducing client operational complexity. Expected upside: USD 2,400-3,600 million.
Pathway F - Personalized Medicine and Cell & Gene Therapy Applications
Advanced therapeutic modalities require specialized fermentation solutions supporting patient-specific production, small-batch manufacturing, and regulatory compliance. Systems offering flexible manufacturing platforms, specialized media formulations, and quality assurance create enhanced value propositions for next-generation therapeutics. USD 1,800-2,700 million.
Pathway G - Research Institutions and Academic Applications
Universities and research centers represent growing opportunities for advanced fermentation platforms supporting fundamental research, educational programs, and collaborative development. Developing specialized solutions for research applications with flexible protocols, educational support, and cost-effective pricing expands beyond commercial markets. Pool: USD 800-1,200 million.
Pathway H - Supplements and Specialty Technologies
Comprehensive fermentation requires specialized supplements, antifoams, and supporting technologies for optimal production performance. Companies developing integrated product portfolios with performance enhancers, process optimization tools, and technical support will capture supporting technology opportunities. Expected revenue: USD 1,200-1,800 million.
Market expansion is being supported by the increasing global demand for biologic drugs and the corresponding shift toward advanced fermentation technologies that can provide superior production efficiency while meeting pharmaceutical requirements for quality, scalability, and regulatory compliance capabilities. Modern pharmaceutical manufacturers and biotechnology companies are increasingly focused on incorporating advanced fermentation excipients to enhance production outcomes while satisfying demands for cost-effective manufacturing technologies and high-quality therapeutic products. Biopharmaceutical fermentation excipients' proven ability to deliver superior cell growth support, consistent product quality, and scalable production capabilities makes them essential components for biologic drug manufacturing and therapeutic protein production applications.
The growing emphasis on personalized medicine and biosimilar development is driving demand for high-quality fermentation excipient products that can support distinctive production requirements and comprehensive bioprocessing across monoclonal antibody, recombinant protein, and cell therapy manufacturing categories. Pharmaceutical manufacturer preference for technologies that combine production excellence with cost optimization is creating opportunities for innovative fermentation implementations in both large-scale commercial and specialized therapeutic applications. The rising influence of contract development and manufacturing organizations and integrated bioprocessing platforms is also contributing to increased adoption of premium fermentation excipient products that can provide reliable manufacturing integration characteristics.
The market is segmented by product type, application, and end user. The demand for product types is divided into cell-culture media & feeds, supplements & specialty recombinant supplements, antifoams/defoamers, and others. Based on application, the market is categorized into mammalian cell fermentation, microbial fermentation, cell & gene therapy, and others. By end user, the market includes pharma & biotech manufacturers, CDMOs/CMOs, research institutions & academic, and others.
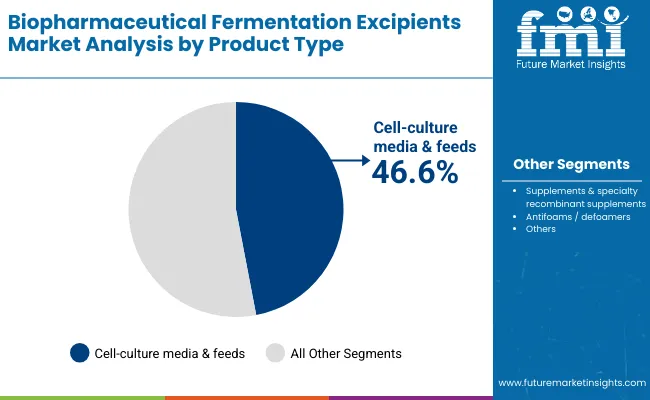
The cell-culture media & feeds segment is projected to account for 46.6% of the biopharmaceutical fermentation excipients market in 2025, expanding to 48.1% by 2035, reaffirming its position as the leading product category. Pharmaceutical manufacturers and biotechnology companies increasingly utilize cell-culture media & feeds technology for their superior cell growth support, consistent nutrient delivery, and scalable performance in critical biopharmaceutical production applications across diverse manufacturing settings. Cell-culture media technology's standardized formulations and proven effectiveness directly address the production requirements for consistent cell cultivation and reliable protein expression in fermentation operations.
This product segment forms the foundation of modern biopharmaceutical manufacturing applications, as it represents the technology with the greatest production impact potential and established compatibility across multiple bioprocessing systems. Manufacturer investments in media optimization and formulation enhancement continue to strengthen adoption among pharmaceutical producers. With biotechnology companies prioritizing production efficiency and product quality, cell-culture media & feeds systems align with both manufacturing effectiveness objectives and cost optimization requirements, making them the central component of comprehensive fermentation strategies.
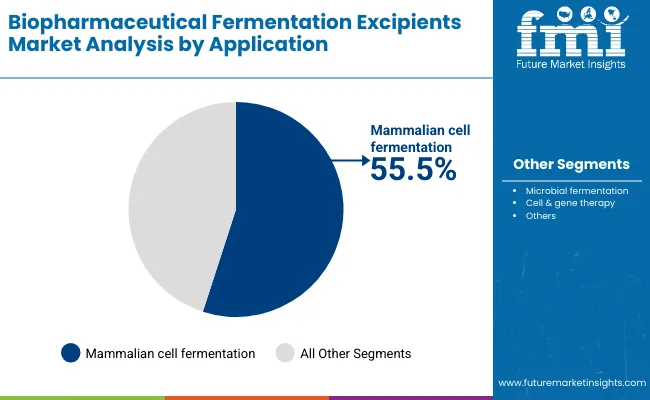
Mammalian cell fermentation applications are projected to represent the largest share of biopharmaceutical fermentation excipients demand in 2025 at 55.5%, increasing to 56.2% by 2035, underscoring their critical role as the primary application for advanced fermentation technologies in biologic drug production and therapeutic protein manufacturing protocols. Pharmaceutical manufacturers and biotechnology companies prefer mammalian cell fermentation systems for their exceptional protein expression capabilities, post-translational modification accuracy, and ability to produce complex therapeutic molecules while supporting scalable manufacturing requirements during commercial production phases. Positioned as essential platforms for monoclonal antibody and recombinant protein manufacturing, mammalian cell fermentation offers both production quality and commercial viability advantages.
The segment is supported by continuous growth in biologic drug development and the growing availability of advanced cell line technologies that enable enhanced production outcomes and cost reduction at the commercial manufacturing level. Additionally, pharmaceutical companies are investing in mammalian cell platforms to support therapeutic innovation and manufacturing optimization. As biopharmaceutical development continues to evolve and manufacturers seek superior production solutions, mammalian cell fermentation applications will continue to dominate the application landscape while supporting technology advancement and manufacturing excellence strategies.
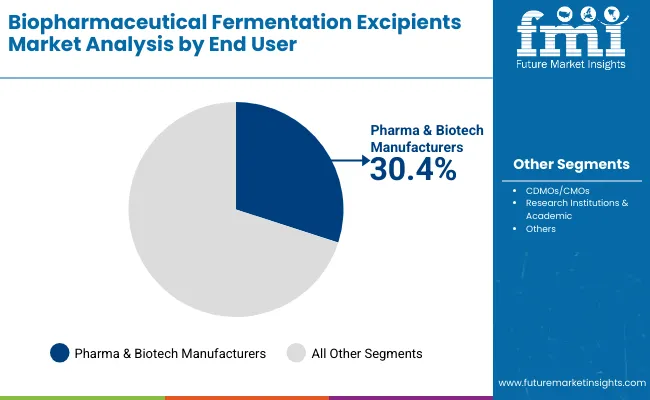
Pharma & biotech manufacturers are projected to account for 30.4% of the market in 2025, increasing to 31.5% by 2035, reflecting their position as key drivers of fermentation excipient demand. This segment benefits from direct involvement in drug development and commercial manufacturing, requiring comprehensive fermentation solutions for diverse therapeutic programs. The growing emphasis on in-house manufacturing capabilities and integrated production strategies supports continued growth in this end-user category.
CDMOs/CMOs represent 27.2% in 2025, expanding to 28.2% by 2035, driven by increasing outsourcing trends and specialized manufacturing requirements. Research institutions & academic organizations account for 21.3% in 2025, growing to 22.4% by 2035, supported by expanding research activities and educational programs in biotechnology and pharmaceutical sciences.
The biopharmaceutical fermentation excipients market is advancing rapidly due to increasing biologic drug development and growing demand for advanced fermentation technologies that emphasize superior production efficiency across pharmaceutical manufacturing and biotechnology applications. However, the market faces challenges, including high development costs compared to traditional chemical synthesis methods, technical complexity in bioprocess optimization, and competition from alternative production platforms. Innovation in cell culture technology and bioprocessing automation continues to influence market development and expansion patterns.
Expansion of Biologic Drug Development Programs
The growing adoption of biopharmaceutical fermentation excipients in comprehensive drug development and commercial manufacturing applications is enabling pharmaceutical companies to develop processes that provide distinctive production capabilities while commanding premium positioning and enhanced therapeutic effectiveness characteristics. Advanced fermentation systems provide superior scalability while allowing more sophisticated bioprocessing across various therapeutic categories and manufacturing segments. Biotechnology companies are increasingly recognizing the competitive advantages of advanced fermentation positioning for comprehensive drug development and pharmaceutical market penetration.
Integration of Advanced Cell Culture Technologies and Process Analytics
Modern biopharmaceutical fermentation excipient suppliers are incorporating advanced cell line development systems, real-time monitoring technologies, and predictive analytics platforms to enhance production efficiency, improve product quality, and meet pharmaceutical manufacturer demands for intelligent and reliable bioprocessing solutions. These programs improve manufacturing performance while enabling new applications, including personalized medicine production and continuous manufacturing systems. Advanced technology integration also allows suppliers to support premium market positioning and manufacturing excellence leadership beyond traditional fermentation products.
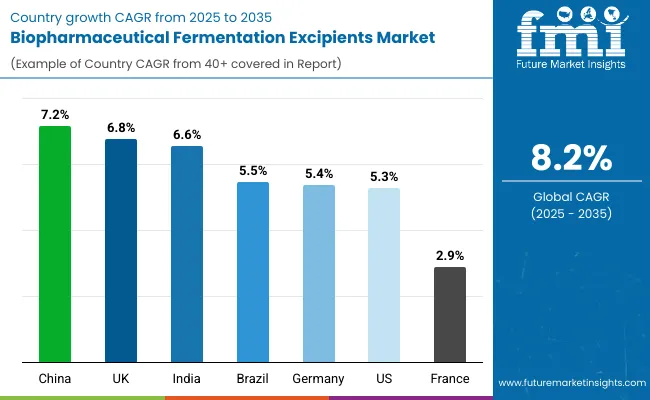
| Countries | CAGR (2025 to 2035) |
|---|---|
| China | 7.2% |
| UK | 6.8% |
| India | 6.6% |
| Brazil | 5.5% |
| Germany | 5.4% |
| USA | 5.3% |
| France | 2.9% |
The biopharmaceutical fermentation excipients market is experiencing robust growth globally, with China leading at a 7.2% CAGR through 2035, driven by expanding biopharmaceutical infrastructure, rising biotechnology investments, and increasing adoption of advanced fermentation technologies. The UK follows at 6.8%, supported by growing pharmaceutical research investments, expanding biotech sector, and rising focus on biologic drug development.
India shows growth at 6.6%, emphasizing healthcare innovation and expanding pharmaceutical manufacturing capabilities. Brazil demonstrates 5.5% growth, prioritizing biotechnology advancement and pharmaceutical sector modernization. Germany records 5.4%, focusing on precision bioprocessing technology and manufacturing excellence. The USA demonstrates 5.3% growth, prioritizing advanced pharmaceutical innovation and comprehensive bioprocessing solutions. France exhibits 2.9% growth, supported by established pharmaceutical infrastructure and steady biotechnology advancement.
The report covers an in-depth analysis of 40+ countries; seven top-performing countries are highlighted below.
Revenue from biopharmaceutical fermentation excipients in China is projected to exhibit exceptional growth with a CAGR of 7.2% through 2035, driven by expanding biopharmaceutical infrastructure and rising investments in biotechnology development across major manufacturing and research centers. The country's growing pharmaceutical market and increasing adoption of advanced fermentation technologies are creating substantial demand for biopharmaceutical fermentation solutions in both domestic and export-oriented applications. Major pharmaceutical manufacturers and biotechnology companies are establishing comprehensive production and research capabilities to serve both domestic healthcare needs and international pharmaceutical markets.
Rising biopharmaceutical infrastructure development and expanding biotechnology investments are driving demand for fermentation excipients across pharmaceutical manufacturers, biotechnology companies, and research institutions throughout major Chinese pharmaceutical systems. Strong government support for pharmaceutical innovation and biotechnology advancement is supporting the rapid adoption of advanced fermentation solutions among manufacturers seeking to meet evolving production standards and international quality expectations.
Revenue from biopharmaceutical fermentation excipients in the UK is expanding at a CAGR of 6.8%, supported by growing pharmaceutical research investments, increasing biotechnology sector development, and expanding biologic drug development infrastructure with advanced manufacturing capabilities. The country's established pharmaceutical ecosystem and expanding biotechnology research sector are driving demand for sophisticated fermentation excipient products across both academic research facilities and commercial manufacturing centers. International pharmaceutical companies and domestic biotechnology manufacturers are establishing comprehensive research and production capabilities to address growing market demand for advanced fermentation solutions.
Rising pharmaceutical research investment and expanding biotechnology development are creating opportunities for fermentation excipient adoption across pharmaceutical companies, research institutions, and biotechnology suppliers in major British pharmaceutical markets. Growing government focus on life sciences advancement and biotechnology innovation is driving the adoption of premium fermentation products among researchers and manufacturers seeking to upgrade to advanced bioprocessing technologies and research excellence standards.
Revenue from biopharmaceutical fermentation excipients in India is projected to grow at a CAGR of 6.6% through 2035, driven by healthcare innovation initiatives, expanding pharmaceutical manufacturing capabilities, and growing focus on biotechnology development requiring advanced production solutions. India's developing pharmaceutical infrastructure and increasing emphasis on biologic drug production are creating substantial demand for both standard and premium fermentation excipient varieties. Leading pharmaceutical companies and biotechnology specialists are establishing comprehensive manufacturing strategies to serve both Indian markets and growing regional pharmaceutical demand.
Rising healthcare innovation and expanding pharmaceutical manufacturing focus are driving demand for premium fermentation excipient products across pharmaceutical companies, biotechnology manufacturers, and research providers seeking superior production capabilities. Strong biotechnology expertise and pharmaceutical development initiatives are supporting the adoption of advanced fermentation technologies among manufacturers prioritizing production excellence and innovation in biopharmaceutical applications.
Revenue from biopharmaceutical fermentation excipients in Brazil is projected to grow at a CAGR of 5.5% through 2035, supported by biotechnology advancement initiatives, pharmaceutical sector modernization, and established focus on healthcare innovation requiring advanced manufacturing solutions. Brazilian pharmaceutical manufacturers and biotechnology companies prioritize production efficiency, cost optimization, and technological advancement, making fermentation excipients essential components for both domestic production and export-oriented manufacturing. The country's comprehensive pharmaceutical ecosystem and research capabilities support continued market development.
Advanced biotechnology capabilities and pharmaceutical sector modernization are driving demand for specialized fermentation excipient products across pharmaceutical manufacturers, biotechnology companies, and research providers serving domestic and international markets. Strong focus on pharmaceutical innovation and cost optimization is encouraging manufacturers to adopt premium fermentation products that support competitive positioning and meet Brazilian quality standards for advanced pharmaceutical applications.
Revenue from biopharmaceutical fermentation excipients in Germany is projected to grow at a CAGR of 5.4% through 2035, supported by precision bioprocessing technology integration initiatives, advanced pharmaceutical development sector, and established expertise in high-quality manufacturing applications. German pharmaceutical manufacturers' focus on manufacturing excellence, technological innovation, and quality optimization creates steady demand for advanced fermentation products. The country's attention to precision engineering and pharmaceutical quality drives consistent adoption across both commercial production and research applications.
Precision bioprocessing integration and advanced pharmaceutical development are driving steady demand for fermentation excipient products across pharmaceutical companies, biotechnology manufacturers, and research specialists seeking superior manufacturing capabilities and quality enhancement. Strong engineering culture and pharmaceutical development focus are supporting the adoption of premium fermentation solutions among manufacturers seeking to meet German quality expectations and technical standards for advanced biopharmaceutical production.
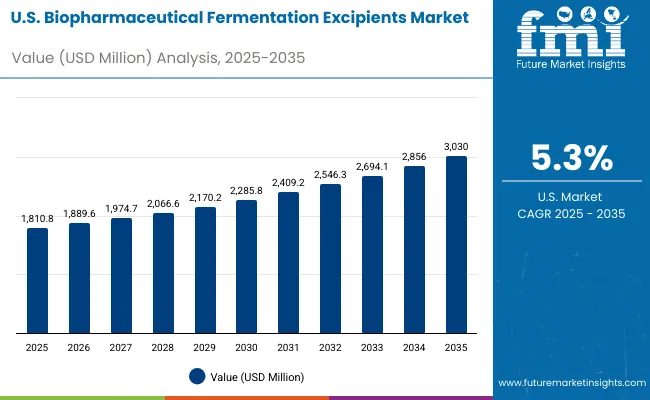
Revenue from biopharmaceutical fermentation excipients in the United States is projected to grow at a CAGR of 5.3% through 2035, supported by pharmaceutical innovation priorities, advanced biotechnology development sector, and established focus on therapeutic advancement and manufacturing optimization. American pharmaceutical manufacturers' emphasis on drug development, manufacturing efficiency, and technological leadership creates steady demand for advanced fermentation products. The country's attention to pharmaceutical quality and innovation drives consistent adoption across both commercial manufacturing and research applications.
Pharmaceutical innovation priorities and advanced biotechnology development are driving steady demand for fermentation excipient products across pharmaceutical companies, biotechnology manufacturers, and research specialists seeking superior production capabilities and innovation enhancement. Strong research culture and pharmaceutical development focus are supporting the adoption of validated fermentation solutions among manufacturers seeking to meet American regulatory standards and innovation expectations for advanced biopharmaceutical development.
Revenue from biopharmaceutical fermentation excipients in France is projected to grow at a CAGR of 2.9% through 2035, supported by pharmaceutical technology advancement sector, established research capabilities, and sustained reputation for producing high-quality pharmaceutical products while working to enhance bioprocessing precision and develop advanced manufacturing technologies. France's pharmaceutical industry continues to benefit from its reputation for scientific excellence while focusing on biotechnology innovation and manufacturing optimization.
Pharmaceutical technology advancement capabilities and established research expertise are driving the development of high-quality fermentation excipient products that command premium prices in international markets while supporting technological advancement and scientific excellence initiatives. Growing focus on pharmaceutical innovation and bioprocessing precision is supporting the adoption of advanced fermentation technologies among manufacturers seeking to ensure product quality and maintain French reputation for pharmaceutical technology excellence in biopharmaceutical applications.
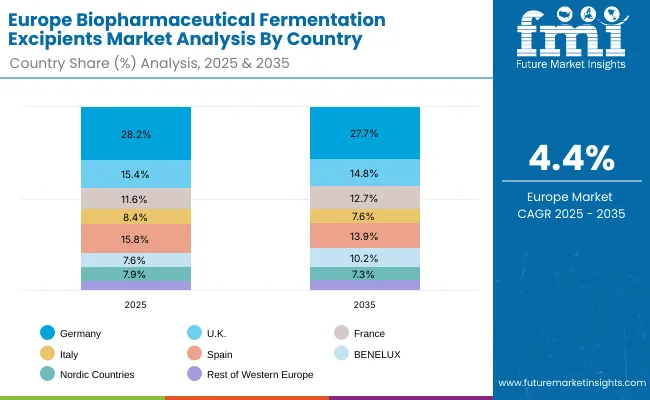
The biopharmaceutical fermentation excipients market in Europe is projected to grow at a CAGR of 4.4% from 2025 to 2035. Germany is expected to maintain its leadership position with a 28.2% market share in 2025, declining slightly to 27.7% by 2035, supported by its precision bioprocessing technology sector, advanced pharmaceutical infrastructure, and manufacturing capabilities serving regional and international markets.
Spain follows with a 15.8% share in 2025, projected to reach 13.9% by 2035, driven by pharmaceutical sector development and biotechnology advancement. The United Kingdom holds a 15.4% share in 2025, expected to maintain 14.8% by 2035, supported by pharmaceutical research excellence and biotechnology innovation, though facing challenges from market competition and regulatory dynamics.
France accounts for 11.6% in 2025, projected to increase to 12.7% by 2035, while BENELUX contributes 7.6% in 2025, expanding to 10.2% by 2035. Italy represents 8.4% in 2025, declining to 7.6% in 2035, while Nordic Countries hold 7.9% in 2025, moderating to 7.3% by 2035. The Rest of Western Europe region is expected to account for 5.2% in 2025, growing to 5.9% by 2035, reflecting mixed growth dynamics across smaller European markets.
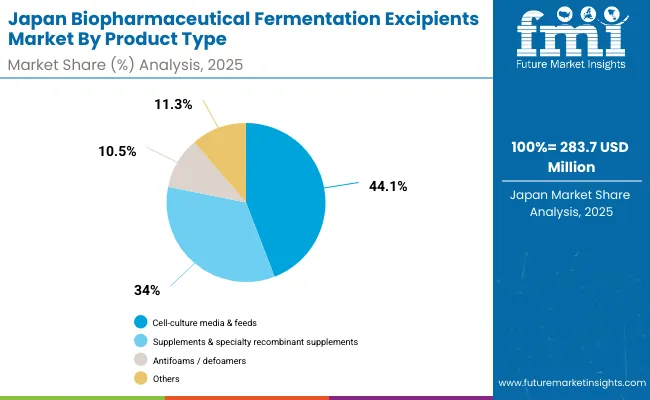
The biopharmaceutical fermentation excipients market in Japan is projected to grow steadily from 2025 to 2035, supported by advanced pharmaceutical infrastructure, strong biotechnology ecosystem, and adoption of innovative manufacturing technologies.
Cell-culture media & feeds are expected to maintain their leadership position with a 44.1% market share in 2025, reflecting strong demand for advanced cell culture solutions and bioprocessing optimization. Supplements & specialty recombinant supplements follow with 34.0% in 2025, supported by robust adoption of specialized additives and performance enhancers.
Antifoams/defoamers hold 10.5% in 2025, leveraging Japan's precision manufacturing and quality control capabilities in bioprocessing applications. Others account for 11.3% in 2025, reflecting stable growth in specialized fermentation accessories and emerging technologies.
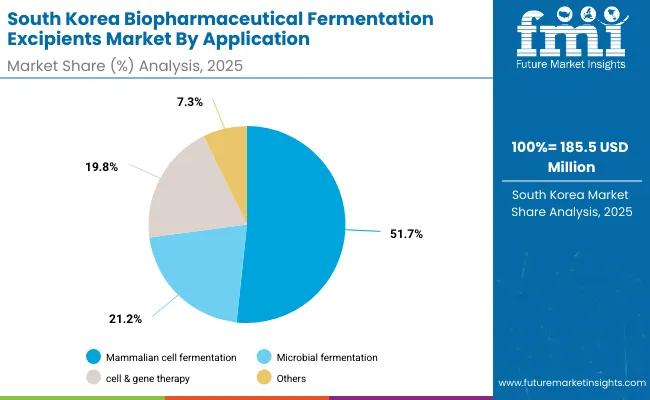
The biopharmaceutical fermentation excipients market in South Korea is projected to expand through 2035, driven by rapid biotechnology advancement, strong pharmaceutical research capabilities, and increasing investment in biologic drug development.
Mammalian cell fermentation is expected to maintain its leadership with a 51.7% market share in 2025, supported by growing focus on monoclonal antibodies, therapeutic proteins, and advanced biologic therapies. Microbial fermentation follows with 21.2% in 2025, reflecting South Korea's established pharmaceutical manufacturing capabilities and biosimilar development programs.
Cell & gene therapy accounts for 19.8% in 2025, supported by government investment in advanced therapeutic research and clinical development programs. Others represent 7.3% in 2025, reflecting steady demand from specialized applications and emerging therapeutic modalities.
The biopharmaceutical fermentation excipients market is characterized by competition among established pharmaceutical suppliers, specialized biotechnology companies, and integrated bioprocessing solution providers. Companies are investing in advanced cell culture technologies, process optimization systems, application-specific product development, and comprehensive technical support capabilities to deliver consistent, high-performance, and reliable fermentation excipient products. Innovation in media formulation enhancement, bioprocess integration, and customized manufacturing compatibility is central to strengthening market position and pharmaceutical manufacturer satisfaction.
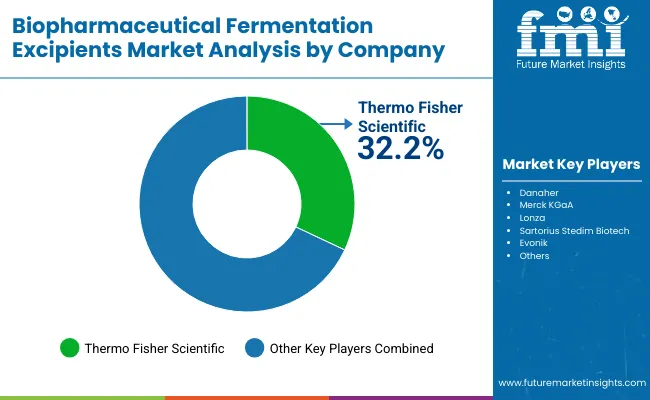
Thermo Fisher Scientific leads the market with a dominant 32.2% share, focusing on comprehensive life sciences solutions and advanced biotechnology platforms, offering premium fermentation excipient products with emphasis on research excellence and manufacturing optimization capabilities. Other key players provide specialized bioprocessing and pharmaceutical manufacturing capabilities with focus on innovation and technical support. Danaher delivers integrated life sciences solutions with emphasis on quality systems and operational excellence. Merck KGaA specializes in pharmaceutical and biotechnology solutions with focus on manufacturing reliability and technical innovation. Lonza focuses on contract development and manufacturing with emphasis on advanced bioprocessing and customer partnership. Sartorius Stedim Biotech emphasizes bioprocessing technologies with focus on single-use systems and manufacturing efficiency. Evonik provides specialty chemicals and biotechnology solutions with emphasis on performance optimization and manufacturing support.
Biopharmaceutical fermentation excipients represent a rapidly expanding $4.5 billion market projected to reach $9.9 billion by 2035, driven by the surge in biologic drug development and advanced cell culture technologies. With cell-culture media & feeds commanding 46.6% market share and mammalian cell fermentation applications leading at 55.5%, this sector requires coordinated stakeholder action to address scaling challenges, technological complexity, and the growing demand for personalized medicine and biosimilar development across pharmaceutical and biotechnology industries.
Advanced Manufacturing Infrastructure Support: Establish specialized biomanufacturing zones with tax incentives targeting fermentation excipient production facilities, particularly in high-growth regions like China (7.2% CAGR) and the UK (6.8% CAGR). Provide infrastructure grants for distributed processing hubs that reduce logistics costs for temperature-sensitive biologics.
Regulatory Harmonization & Fast-Track Pathways: Create expedited approval processes for cell-culture media innovations and specialty recombinant supplements, recognizing their critical role in biologic drug production. Develop clear guidance for mammalian cell fermentation applications that represent 55.5% of market demand, including streamlined pathways for personalized medicine manufacturing.
R&D Investment in Critical Technologies: Fund public-private partnerships focused on advanced cell line development, real-time monitoring systems, and AI-powered fermentation analytics. Prioritize research into continuous manufacturing systems and microencapsulation technologies that enhance product stability and reduce production costs.
Workforce Development Programs: Establish specialized training centers for bioprocess engineers and fermentation technicians, addressing the skilled labor shortage in precision bioprocessing. Partner with CDMOs/CMOs (representing 27.2% of end users) to create apprenticeship programs in advanced fermentation technologies.
Strategic Trade & Export Promotion: Develop export financing programs for domestic fermentation excipient manufacturers, particularly targeting emerging markets in South Asia & Pacific and Latin America where growth opportunities are expanding rapidly.
Comprehensive Quality Standards Framework: Establish standardized protocols for cell-culture media characterization, including detailed specifications for protein content, growth factor concentrations, and contamination thresholds. Develop performance benchmarks for mammalian and microbial fermentation applications that ensure consistent quality across suppliers.
Technology Transfer and Knowledge Sharing Platforms: Create industry consortiums linking established players like Thermo Fisher Scientific (32.2% market share) with emerging biotechnology companies. Facilitate technical knowledge exchange between pharma & biotech manufacturers (30.4% of end users) and specialized suppliers.
Market Intelligence and Forecasting Services: Develop comprehensive databases tracking fermentation excipient performance metrics, pricing trends, and supply chain reliability. Provide market intelligence services that help stakeholders navigate the complex landscape of cell & gene therapy applications (representing growing market segments).
Sustainability and ESG Standards: Create certification programs for environmentally sustainable fermentation processes, addressing the pharmaceutical industry's growing focus on carbon footprint reduction and sustainable manufacturing practices.
Global Market Access Initiatives: Organize trade missions and buyer-supplier matchmaking events, particularly targeting high-growth markets in India (6.6% CAGR) and Brazil (5.5% CAGR). Facilitate partnerships between research institutions & academic organizations (21.3% of end users) and commercial manufacturers.
Modular and Scalable Processing Solutions: Develop flexible fermentation systems that can accommodate both large-scale commercial production and specialized applications like cell & gene therapy. Focus on energy-efficient designs that reduce operational costs while maintaining product quality for temperature-sensitive biologics.
Integration of Smart Manufacturing Technologies: Incorporate IoT sensors, predictive analytics, and automated quality control systems into fermentation equipment. Develop digital twin technologies that optimize cell culture conditions and predict maintenance requirements, reducing downtime in critical biomanufacturing operations.
Advanced Separation and Purification Technologies: Innovate in membrane filtration, chromatography systems, and continuous processing technologies that improve yield and reduce processing time for complex biologics. Focus on single-use systems that eliminate cross-contamination risks and reduce cleaning validation requirements.
Packaging and Stability Solutions: Develop specialized packaging systems for cell-culture media & feeds that maintain product integrity during global distribution. Create cold-chain management solutions that support the international trade of temperature-sensitive fermentation excipients.
Technical Support and Training Services: Establish comprehensive customer support programs including on-site optimization services, remote monitoring capabilities, and technical troubleshooting support. Provide specialized training for operators working with complex mammalian cell fermentation systems.
Portfolio Diversification Strategy: Develop tiered product offerings targeting different market segments - commodity-grade products for cost-sensitive applications, pharmaceutical-grade products for regulated markets, and specialty formulations for advanced therapeutic applications. Focus particularly on supplements & specialty recombinant supplements (growing market segment).
Supply Chain Resilience and Reliability: Implement robust supply chain management systems that ensure consistent availability of critical raw materials. Develop multiple sourcing strategies for key components, particularly important given the complex regulatory requirements in biopharmaceutical manufacturing.
Customer Partnership and Co-Development Programs: Establish long-term partnerships with major pharmaceutical manufacturers and CDMOs/CMOs, offering customized formulation development and technical support services. Provide performance guarantees and risk-sharing arrangements for critical manufacturing applications.
Geographic Expansion in High-Growth Markets: Establish local manufacturing and distribution capabilities in key growth regions, particularly China, India, and other emerging markets where biopharmaceutical infrastructure is rapidly expanding.
Regulatory Compliance and Documentation: Maintain comprehensive quality systems that meet global regulatory standards, including FDA, EMA, and emerging market requirements. Provide complete documentation packages that support customer regulatory filings and inspections.
Strategic Manufacturing Infrastructure Investment: Finance distributed processing networks that serve regional biopharmaceutical clusters, reducing logistics costs and improving supply chain resilience. Focus on facilities that can produce multiple product types (media, supplements, specialty chemicals) to maximize utilization and return on investment.
Technology Innovation Funding: Back startups and established companies developing breakthrough fermentation technologies, including advanced cell line engineering, continuous processing systems, and AI-powered bioprocess optimization. Prioritize investments in companies addressing cell & gene therapy manufacturing challenges.
Market Consolidation and Scale Opportunities: Support strategic acquisitions that create integrated platforms combining fermentation excipient production with specialized services like analytical testing, regulatory support, and technical consulting. Focus on building companies that can compete with industry leaders like Thermo Fisher Scientific and Danaher.
Blended Finance for Emerging Markets: Use development finance instruments to support biopharmaceutical infrastructure development in high-growth markets like India and Brazil, where local production capabilities need to be established to serve growing domestic and regional demand.
ESG-Focused Investment Strategies: Target investments in companies demonstrating measurable sustainability improvements, including energy-efficient manufacturing processes, waste reduction programs, and sustainable sourcing practices. Tie investment returns to specific ESG outcomes and market penetration metrics.
Risk Mitigation Through Portfolio Diversification: Build diversified investment portfolios spanning different product types (cell-culture media, supplements, antifoams), applications (mammalian vs. microbial fermentation), and end-user segments (pharma manufacturers, CDMOs, research institutions) to balance growth opportunities with market risks.
| Items | Values |
|---|---|
| Quantitative Units (2025) | USD 4,485.5 million |
| Product Type | Cell-culture Media & Feeds, Supplements & Specialty Recombinant Supplements, Antifoams/ Defoamers, Others |
| Application | Mammalian Cell Fermentation, Microbial Fermentation, Cell & Gene Therapy, Others |
| End User | Pharma & Biotech Manufacturers, CDMOs/CMOs, Research Institutions & Academic, Others |
| Regions Covered | North America, Europe, East Asia, South Asia & Pacific, Latin America, Middle East & Africa |
| Countries Covered | United States, Germany, United Kingdom, France, China, Japan, South Korea, India, Brazil, and 40+ countries |
| Key Companies Profiled | Thermo Fisher Scientific, Danaher, Merck KGaA, Lonza, Sartorius Stedim Biotech, Evonik, Hoffmann-La Roche Ltd., Nova Biomedicals, Becton, Dickinson and Company |
| Additional Attributes | Dollar sales by product type, application, and end user, regional demand trends, competitive landscape, technological advancements in fermentation technology, pharmaceutical integration initiatives, production optimization programs, and manufacturing excellence enhancement strategies |
By North America
By Europe
By East Asia
By South Asia & Pacific
By Latin America
By Middle East & Africa
The global biopharmaceutical fermentation excipients market is valued at USD 4,485.5 million in 2025.
The size for the biopharmaceutical fermentation excipients market is projected to reach USD 9,864.7 million by 2035.
The biopharmaceutical fermentation excipients market is expected to grow at an 8.2% CAGR between 2025 and 2035.
The key product type segments in the biopharmaceutical fermentation excipients market are cell-culture media & feeds, supplements & specialty recombinant supplements, antifoams/defoamers, and others.
In terms of application, mammalian cell fermentation segment is set to command 55.5% share in the biopharmaceutical fermentation excipients market in 2025.


Our Research Products

The "Full Research Suite" delivers actionable market intel, deep dives on markets or technologies, so clients act faster, cut risk, and unlock growth.

The Leaderboard benchmarks and ranks top vendors, classifying them as Established Leaders, Leading Challengers, or Disruptors & Challengers.

Locates where complements amplify value and substitutes erode it, forecasting net impact by horizon

We deliver granular, decision-grade intel: market sizing, 5-year forecasts, pricing, adoption, usage, revenue, and operational KPIs—plus competitor tracking, regulation, and value chains—across 60 countries broadly.

Spot the shifts before they hit your P&L. We track inflection points, adoption curves, pricing moves, and ecosystem plays to show where demand is heading, why it is changing, and what to do next across high-growth markets and disruptive tech

Real-time reads of user behavior. We track shifting priorities, perceptions of today’s and next-gen services, and provider experience, then pace how fast tech moves from trial to adoption, blending buyer, consumer, and channel inputs with social signals (#WhySwitch, #UX).

Partner with our analyst team to build a custom report designed around your business priorities. From analysing market trends to assessing competitors or crafting bespoke datasets, we tailor insights to your needs.
Supplier Intelligence
Discovery & Profiling
Capacity & Footprint
Performance & Risk
Compliance & Governance
Commercial Readiness
Who Supplies Whom
Scorecards & Shortlists
Playbooks & Docs
Category Intelligence
Definition & Scope
Demand & Use Cases
Cost Drivers
Market Structure
Supply Chain Map
Trade & Policy
Operating Norms
Deliverables
Buyer Intelligence
Account Basics
Spend & Scope
Procurement Model
Vendor Requirements
Terms & Policies
Entry Strategy
Pain Points & Triggers
Outputs
Pricing Analysis
Benchmarks
Trends
Should-Cost
Indexation
Landed Cost
Commercial Terms
Deliverables
Brand Analysis
Positioning & Value Prop
Share & Presence
Customer Evidence
Go-to-Market
Digital & Reputation
Compliance & Trust
KPIs & Gaps
Outputs
Full Research Suite comprises of:
Market outlook & trends analysis
Interviews & case studies
Strategic recommendations
Vendor profiles & capabilities analysis
5-year forecasts
8 regions and 60+ country-level data splits
Market segment data splits
12 months of continuous data updates
DELIVERED AS:
PDF EXCEL ONLINE
Biopharmaceutical Contract Manufacturing Market Analysis - Size, Share, and Forecast 2025 to 2035
Biopharmaceuticals Packaging Market Growth – Forecast 2025 to 2035
Biopharmaceutical Oral Drug Delivery Market
Fermentation Chemicals Market Size and Share Forecast Outlook 2025 to 2035
Fermentation Equipment Market Size and Share Forecast Outlook 2025 to 2035
Fermentation Defoamer Market Size and Share Forecast Outlook 2025 to 2035
Assessing Fermentation Chemicals Market Share & Industry Trends
Fish Fermentation Market Size and Share Forecast Outlook 2025 to 2035
Wine Fermentation Equipment Market Size and Share Forecast Outlook 2025 to 2035
Precision Fermentation Ingredients Market Size and Share Forecast Outlook 2025 to 2035
Probiotic Fermentation Skincare Market Size and Share Forecast Outlook 2025 to 2035
Microbial Fermentation Technology Market Size and Share Forecast Outlook 2025 to 2035
Bioprocess Fermentation Monitoring Market Analysis - Size, Share, and Forecast Outlook 2025 to 2035
Mammalian Cell Fermentation Technology Market Forecast Outlook 2025 to 2035
Sugar-based Excipients Market Analysis by Product, Type, Functionality, Formulation, and Region Through 2035
Nutraceutical Excipients Market Analysis - Size, Share, and Forecast Outlook 2025 to 2035
Sustained Release Excipients Market Report – Trends & Industry Forecast 2018-2026

Thank you!
You will receive an email from our Business Development Manager. Please be sure to check your SPAM/JUNK folder too.
Chat With
MaRIA