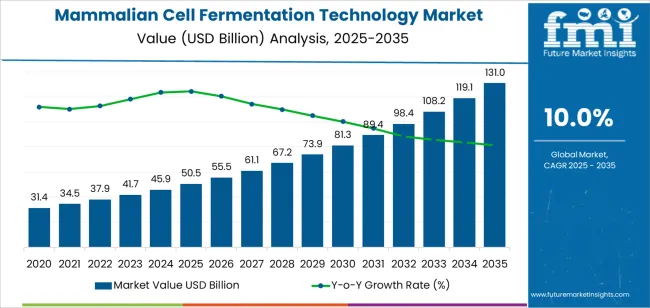
The mammalian cell fermentation technology market is expanding steadily as biologics manufacturing continues to advance globally. Rising demand for recombinant proteins, monoclonal antibodies, and cell-based vaccines has driven sustained adoption of mammalian expression systems. Current market conditions reflect strong investment in bioprocess optimization, enhanced culture media formulations, and scalable production platforms that improve yield and product quality.
Regulatory emphasis on safety and efficacy, coupled with the need for high-fidelity protein expression, has accelerated the use of mammalian cell systems in both research and commercial bioproduction. The future outlook remains positive as biopharmaceutical pipelines increasingly favor complex biologics that require mammalian-based expression systems.
Growth rationale is rooted in technological innovation, continuous process improvement, and expanding contract manufacturing capacity that enables rapid scaling These factors, combined with rising healthcare expenditure and global focus on biologic therapies, are expected to sustain robust market growth across the forecast horizon.
| Metric | Value |
|---|---|
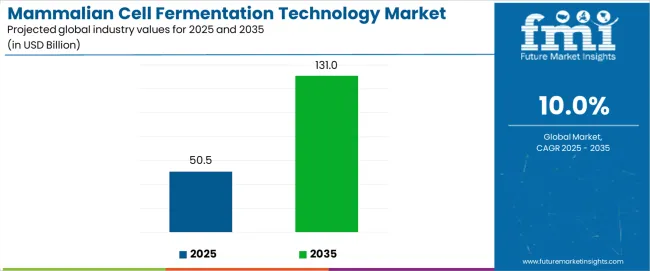
| Mammalian Cell Fermentation Technology Market Estimated Value in (2025 E) | USD 50.5 billion |
| Mammalian Cell Fermentation Technology Market Forecast Value in (2035 F) | USD 131.0 billion |
| Forecast CAGR (2025 to 2035) | 10.0% |
The market is segmented by Type, Application, and End Use and region. By Type, the market is divided into Chinese Hamster Ovary (CHO) Cell Fermentation, Human Embryonic Kidney (HEK) Cell Fermentation, Baby Hamster Kidney (BHK) Cell Fermentation, Murine Myeloma Cell Fermentation, and Other Types. In terms of Application, the market is classified into Monoclonal Antibodies, Recombinant Proteins, Vaccines, Hormones, Enzymes, and Other Application. Based on End Use, the market is segmented into Biopharmaceutical Companies, CMOs & CDMOs, and Academic & Research Institutes. Regionally, the market is classified into North America, Latin America, Western Europe, Eastern Europe, Balkan & Baltic Countries, Russia & Belarus, Central Asia, East Asia, South Asia & Pacific, and the Middle East & Africa.
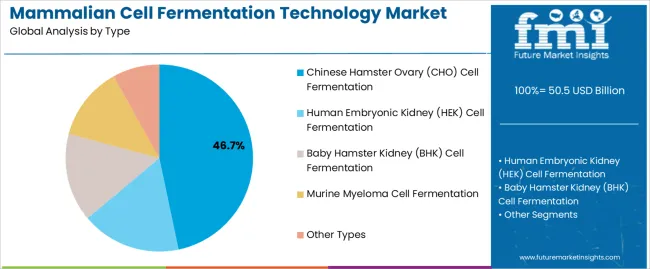
The Chinese Hamster Ovary (CHO) cell fermentation segment, accounting for 46.70% of the type category, has maintained its dominance due to its proven reliability, scalability, and regulatory acceptance in biologics production. The CHO system is favored for its ability to produce complex recombinant proteins with accurate post-translational modifications, making it the industry standard for commercial biopharmaceutical manufacturing.
Process optimization and high-density culture techniques have improved productivity and reduced costs, supporting consistent yield in large-scale operations. Regulatory agencies’ familiarity with CHO-derived products has facilitated smoother approval pathways, reinforcing its market leadership.
Continued innovation in cell line engineering, vector design, and perfusion technologies is expected to enhance efficiency further, ensuring that CHO-based fermentation remains a cornerstone of mammalian cell technology development.
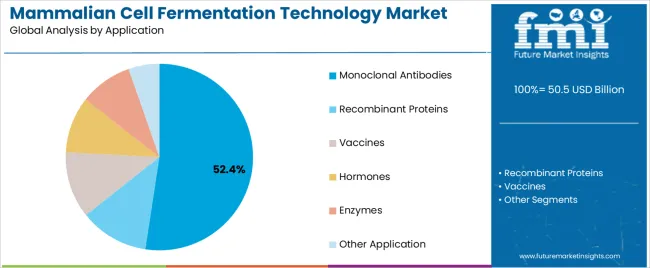
The monoclonal antibodies segment, representing 52.40% of the application category, has emerged as the leading area of application due to growing clinical use in oncology, autoimmune diseases, and infectious disorders. Demand is being driven by the expanding therapeutic pipeline and increasing preference for biologic therapies that offer higher specificity and efficacy.
Mammalian cell systems have proven essential for monoclonal antibody production, ensuring accurate protein folding and glycosylation. Manufacturers are investing heavily in process automation and single-use technologies to enhance output while maintaining regulatory compliance.
Market stability is further supported by patent expirations of key biologics, prompting biosimilar development that relies on mammalian fermentation processes With continuous innovation and expanding production capacities, this segment is expected to sustain long-term dominance in the overall market.
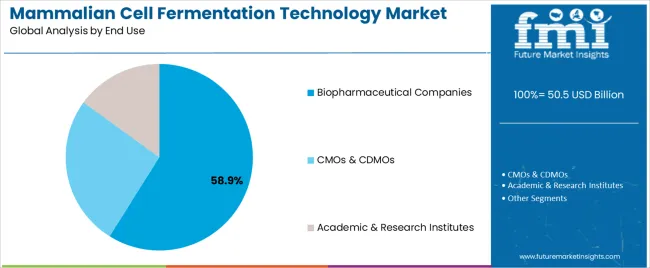
The biopharmaceutical companies segment, holding 58.90% of the end use category, has retained its leading position as large-scale biologics producers increasingly rely on mammalian cell fermentation for manufacturing complex therapeutic proteins. These companies benefit from integrated production capabilities, strong research pipelines, and extensive regulatory expertise, enabling efficient scale-up from laboratory to commercial production.
Continuous investment in facility expansion, bioreactor technologies, and process intensification has improved operational throughput and reduced production timelines. The segment’s growth is further supported by strategic partnerships with contract manufacturing organizations to expand capacity and access global markets.
As the demand for biologics and biosimilars continues to rise, biopharmaceutical companies are expected to maintain their leadership role, driving innovation and sustaining high market share throughout the forecast period.
From 2020 to 2025, the mammalian cell fermentation technology market experienced a CAGR of 11.4%. Mammalian cell fermentation technology has become the cornerstone of biopharmaceutical manufacturing, particularly for complex therapeutics such as monoclonal antibodies and recombinant proteins.
This technology allows for the production of biologics with high yields, proper folding, and post-translational modifications crucial for their efficacy and safety.
The growing emphasis on personalized medicine and targeted therapies is likely to influence the development and production of biologic drugs. Mammalian cell fermentation technology will play a crucial role in manufacturing personalized biologics tailored to individual patient needs.
As the demand for biologic drugs continues to rise and technological advancements accelerate, the market is poised for sustained growth and innovation. Projections indicate that the global mammalian cell fermentation technology market is expected to experience a CAGR of 10.0% from 2025 to 2035.
| Historical CAGR from 2020 to 2025 | 11.4% |
|---|---|
| Forecast CAGR from 2025 to 2035 | 10.0% |
The provided table highlights the top five countries in terms of revenue, with Japan and South Korea leading the list. Japan and South Korea have been focusing on the development of innovative therapies to address unmet medical needs, particularly in areas such as oncology, immunology, and rare diseases.
Mammalian cell fermentation technology plays a crucial role in the production of these advanced biologics, driving market growth in both countries.
| Countries | Forecast CAGRs from 2025 to 2035 |
|---|---|
| The United States | 4.2% |
| The United Kingdom | 5.0% |
| China | 4.8% |
| Japan | 5.5% |
| South Korea | 6.0% |
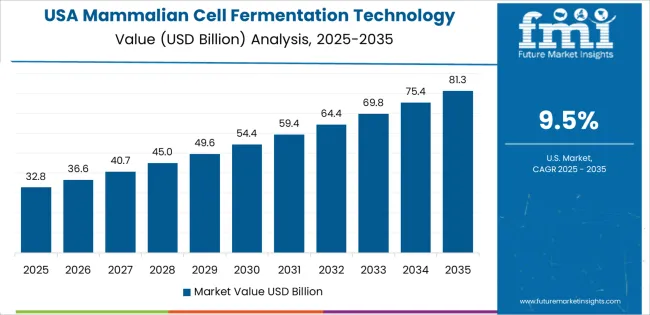
The mammalian cell fermentation technology market in the United States is expected to expand with a CAGR of 4.2% from 2025 to 2035. The United States has a high demand for biologic drugs to treat various diseases, including cancer, autoimmune disorders, and infectious diseases. Mammalian cell fermentation technology is essential for producing these biopharmaceuticals, driving market growth.
The United States biopharmaceutical industry invests heavily in research and development to develop innovative therapies and improve manufacturing processes. Investments in cell line engineering, process optimization, and bioprocessing technologies contribute to the growth of the mammalian cell fermentation technology market.
The mammalian cell fermentation technology market in China is expected to expand with a CAGR of 4.8% from 2025 to 2035. China's biopharmaceutical industry has experienced rapid growth in recent years, fueled by government initiatives, investments in research and development, and a growing demand for innovative therapies.
The Chinese government has implemented policies to support the development of the biopharmaceutical sector, including incentives for research, investment, and innovation. Government funding and support for biotechnology infrastructure and talent development contribute to the growth of the mammalian cell fermentation technology market.
Leading global companies in the mammalian cell fermentation technology market, such as Thermo Fisher Scientific, Merck KGaA, and Lonza, are expanding their presence in China. Partnerships, collaborations, and investments by these companies contribute to market growth and technology transfer in the country.
The mammalian cell fermentation technology market in United Kingdom is expected to expand with a CAGR of 5.0% from 2025 to 2035. The United Kingdom has a strong biopharmaceutical sector, with a well-established ecosystem of pharmaceutical companies, research institutions, and academic centers.
The demand for biologic drugs in the UK, driven by an aging population and increasing prevalence of chronic diseases, fuels growth in mammalian cell fermentation technology.
The United Kingdom government has been actively promoting investment in life sciences and biotechnology through funding initiatives, tax incentives, and research grants. This support encourages innovation and stimulates growth in the mammalian cell fermentation technology market.
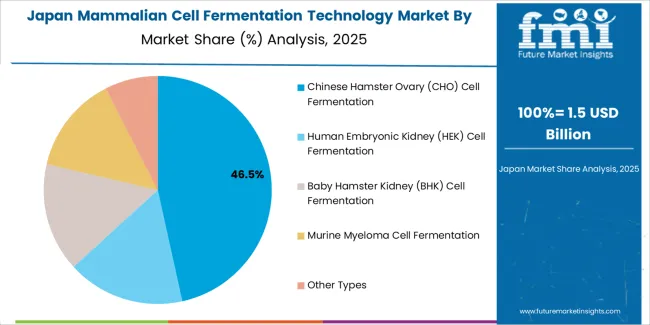
The mammalian cell fermentation technology market in Japan is expected to expand with a CAGR of 5.5% from 2025 to 2035.
Japan is known for its expertise in biotechnology and has made significant advancements in cell line engineering, process optimization, and bioprocessing technologies. These advancements have led to improvements in productivity, scalability, and cost-effectiveness in mammalian cell fermentation, driving market growth.
The Japanese government has implemented initiatives to promote biotechnology and innovation in healthcare, including funding for research and development in the biopharmaceutical sector. Investments in infrastructure, technology transfer, and talent development have contributed to the growth of the mammalian cell fermentation technology market.
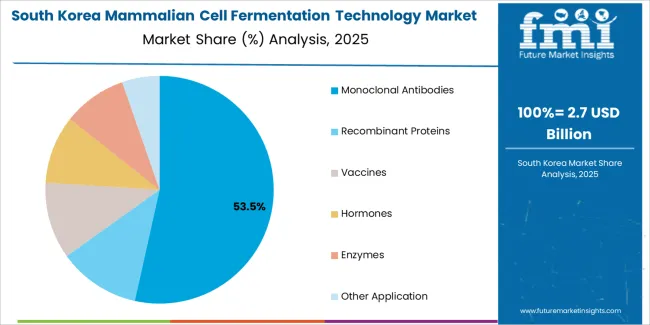
South Korea is home to world-class research institutions and universities with expertise in biotechnology and cell culture technologies. Collaborations between academia and industry facilitate technology transfer, innovation, and skill development in mammalian cell fermentation. The mammalian cell fermentation technology market in South Korea is expected to expand with a CAGR of 6.0% from 2025 to 2035.
The increasing prevalence of chronic diseases, aging population, and changing healthcare landscape in South Korea have driven the demand for biologic drugs. Mammalian cell fermentation technology enables the production of high-quality biologics such as monoclonal antibodies and recombinant proteins to address these healthcare needs.
The below section shows the leading segment. The Chinese Hamster Ovary (CHO) Cell Fermentation segment is to rise at a CAGR of 3.8% from 2025 to 2035. Based on application, the monoclonal antibodies segment is anticipated to hold a dominant share through 2035. It is set to exhibit a CAGR of 3.6% from 2025 to 2035.
| Category | CAGR from 2025 to 2035 |
|---|---|
| Chinese Hamster Ovary (CHO) Cell Fermentation | 3.8% |
| Monoclonal Antibodies | 3.6% |
Based on the type, the Chinese Hamster Ovary (CHO) Cell Fermentation segment is anticipated to thrive at a CAGR of 3.8% from 2025 to 2035. CHO cells are widely used for biopharmaceutical production because they have the machinery to properly fold and post-translationally modify complex proteins, making them suitable for producing human therapeutic proteins like monoclonal antibodies and recombinant proteins.
CHO cells have a long history of use in biopharmaceutical manufacturing and are well-characterized in terms of safety, stability, and regulatory acceptance. Their established safety profile reduces regulatory hurdles and accelerates the development and approval of biologic drugs produced using CHO cell fermentation.
CHO cells can be adapted to grow in serum-free or chemically defined media, which eliminates the risk of introducing contaminants from animal-derived components and simplifies downstream purification processes. Serum-free media also enhance product consistency and facilitate regulatory compliance.
Based on application, the monoclonal antibodies segment is anticipated to thrive at a CAGR of % from 2025 to 2035. Monoclonal antibodies are highly effective in treating a wide range of diseases, including cancer, autoimmune disorders, and infectious diseases. Their specificity for target antigens allows for precise targeting of disease pathways, resulting in potent therapeutic effects with minimal off-target effects.
Monoclonal antibodies have a broad spectrum of therapeutic applications, including cancer immunotherapy, autoimmune disease management, and infectious disease treatment. Their versatility makes them valuable tools in addressing various unmet medical needs, driving demand for their production through mammalian cell fermentation.
Ongoing advancements in mammalian cell culture techniques, cell line engineering, and bioprocessing technologies have further enhanced the productivity, yield, and cost-effectiveness of monoclonal antibody production through mammalian cell fermentation. These technological innovations drive continued growth and innovation in the field.
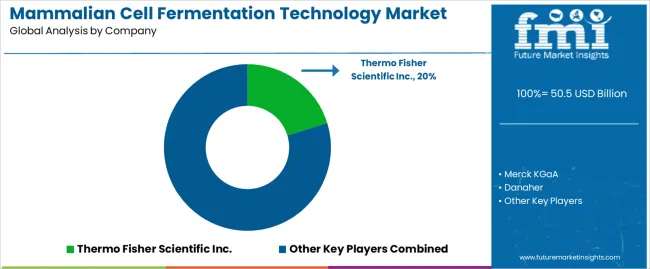
Leading companies allocate significant resources to research and development efforts aimed at enhancing fermentation processes, improving cell line productivity, and developing novel technologies. Investing in R&D enables companies to stay ahead of technological advancements and address evolving market demands.
| Attributes | Details |
|---|---|
| Estimated Market Size in 2025 | USD 50.5 Billion |
| Projected Market Valuation in 2035 | USD 131.0 Billion |
| Value-based CAGR 2025 to 2035 | 10% |
| Forecast Period | 2025 to 2035 |
| Historical Data Available for | 2020 to 2025 |
| Market Analysis | Value in USD billion |
| Key Regions Covered | North America; Latin America; Western Europe; Eastern Europe; South Asia and Pacific; East Asia; Middle East and Africa |
| Key Market Segments Covered | Type, Application, End-user, Region |
| Key Countries Profiled | The United States, Canada, Brazil, Mexico, Germany, The United Kingdom, France, Spain, Italy, Russia, Poland, Czech Republic, Romania, India, Bangladesh, Australia, New Zealand, China, Japan, South Korea, GCC countries, South Africa, Israel |
| Key Companies Profiled | Thermo Fisher Scientific Inc.; Merck KGaA; Danaher; Lonza |
The global mammalian cell fermentation technology market is estimated to be valued at USD 50.5 billion in 2025.
The market size for the mammalian cell fermentation technology market is projected to reach USD 131.0 billion by 2035.
The mammalian cell fermentation technology market is expected to grow at a 10.0% CAGR between 2025 and 2035.
The key product types in mammalian cell fermentation technology market are chinese hamster ovary (cho) cell fermentation, human embryonic kidney (hek) cell fermentation, baby hamster kidney (bhk) cell fermentation, murine myeloma cell fermentation and other types.
In terms of application, monoclonal antibodies segment to command 52.4% share in the mammalian cell fermentation technology market in 2025.


Full Research Suite comprises of:
Market outlook & trends analysis
Interviews & case studies
Strategic recommendations
Vendor profiles & capabilities analysis
5-year forecasts
8 regions and 60+ country-level data splits
Market segment data splits
12 months of continuous data updates
DELIVERED AS:
PDF EXCEL ONLINE
Mammalian Transient Protein Expression Market Forecast and Outlook 2025 to 2035
Mammalian Derived Proteins Market Size and Share Forecast Outlook 2025 to 2035
Cellulose Fiber Market Forecast and Outlook 2025 to 2035
Cellulite Treatment Market Size and Share Forecast Outlook 2025 to 2035
Cellulose Derivative Market Size and Share Forecast Outlook 2025 to 2035
Cellulose Film Packaging Market Size and Share Forecast Outlook 2025 to 2035
Cell Therapy Systems Market Size and Share Forecast Outlook 2025 to 2035
Cellular IoT Market Size and Share Forecast Outlook 2025 to 2035
Cell Isolation Market Size and Share Forecast Outlook 2025 to 2035
Cellulose Ether and Derivatives Market Size and Share Forecast Outlook 2025 to 2035
Cellular Push-to-talk Market Size and Share Forecast Outlook 2025 to 2035
Cell Culture Waste Aspirator Market Size and Share Forecast Outlook 2025 to 2035
Cell Culture Media Market Size and Share Forecast Outlook 2025 to 2035
Cellulosic Polymers Market Size and Share Forecast Outlook 2025 to 2035
Cellbag Bioreactor Chambers Market Size and Share Forecast Outlook 2025 to 2035
Cell Surface Markers Detection Market Size and Share Forecast Outlook 2025 to 2035
Cellular Modem Market Size and Share Forecast Outlook 2025 to 2035
Cellulite Reduction Treatments Market Size and Share Forecast Outlook 2025 to 2035
Cell Culture Supplements Market Size and Share Forecast Outlook 2025 to 2035
Cell Culture Media & Cell Lines Market Size and Share Forecast Outlook 2025 to 2035

Thank you!
You will receive an email from our Business Development Manager. Please be sure to check your SPAM/JUNK folder too.
Chat With
MaRIA