The Cell Culture Media Market is estimated to be valued at USD 3747.8 million in 2025 and is projected to reach USD 7141.6 million by 2035, registering a compound annual growth rate (CAGR) of 6.6% over the forecast period.
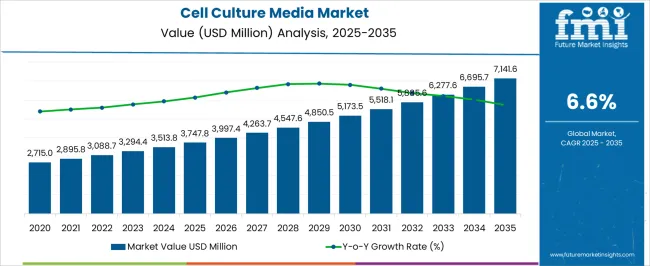
| Metric | Value |
|---|---|
| Cell Culture Media Market Estimated Value in (2025 E) | USD 3747.8 million |
| Cell Culture Media Market Forecast Value in (2035 F) | USD 7141.6 million |
| Forecast CAGR (2025 to 2035) | 6.6% |
The cell culture media market is experiencing strong growth momentum, driven by rising demand for advanced research models, increased investment in biopharmaceutical R&D, and the expanding role of cell-based therapies. Media formulations are evolving rapidly to provide precise nutrient delivery, ensuring optimal growth and productivity in cell cultures used for drug discovery, vaccine development, and regenerative medicine.
The market is currently benefiting from an industry-wide shift toward serum-free and chemically defined media, addressing both consistency and regulatory compliance requirements. Expansion of the biopharmaceutical pipeline, combined with increasing academic and research initiatives, has reinforced demand across multiple applications.
Future market expansion is expected to be supported by growth in personalized medicine, stem cell research, and large-scale biologics manufacturing. With a strong alignment to innovation in healthcare, the market outlook remains robust, underpinned by continuous advances in formulation technology and heightened focus on scalable, cost-efficient production systems.
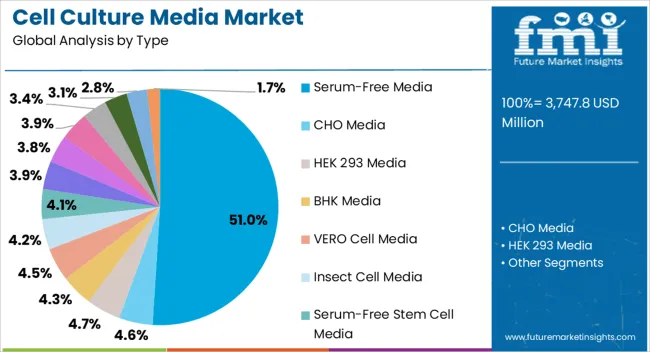
The serum-free media segment dominates the type category, accounting for approximately 51.0% share in the cell culture media market. This leadership is driven by its ability to provide consistent performance, eliminating the variability and contamination risks associated with serum-containing formulations. Adoption has been accelerated by regulatory bodies encouraging serum-free systems for biologics production and clinical research.
The segment’s strength lies in its compatibility with large-scale manufacturing of monoclonal antibodies, recombinant proteins, and advanced cell-based therapies. Serum-free media also reduce ethical concerns and supply limitations linked to animal-derived components.
With continuous innovation aimed at tailoring nutrient formulations for specific cell lines, this segment is expected to maintain its leading position. Its alignment with the growing emphasis on reproducibility and regulatory compliance reinforces its importance in shaping market growth.
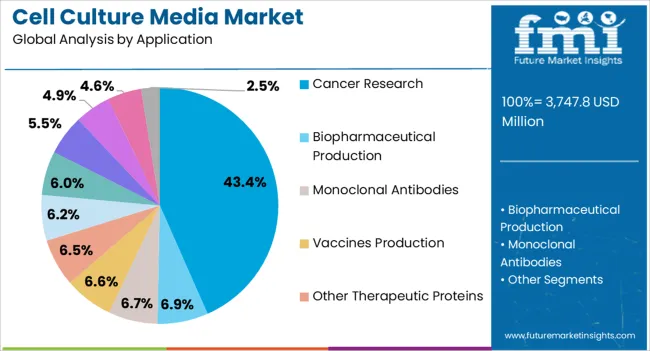
The cancer research segment holds approximately 43.4% share of the application category, underscoring its central role in driving cell culture media demand. Cell-based models are integral to oncology research, enabling accurate studies on tumor behavior, drug resistance, and treatment response.
The segment benefits from escalating investment in cancer therapeutics, where precision and reproducibility in research outcomes are paramount. The availability of advanced formulations has enhanced the reliability of cancer research experiments, supporting both academic and industrial pipelines.
Rising prevalence of cancer worldwide has further expanded demand for effective in vitro systems to accelerate therapeutic development. With ongoing clinical trials and the growth of immuno-oncology research, the cancer research segment is projected to retain its leadership, ensuring stable demand for cell culture media.
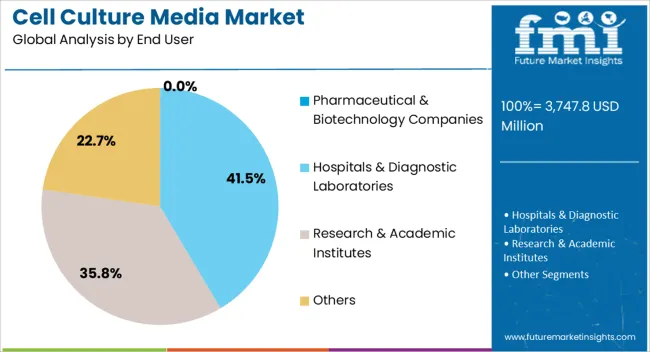
The pharmaceutical and biotechnology companies segment represents approximately 41.6% share in the end-user category, driven by its reliance on cell culture media for biologics manufacturing, vaccine production, and therapeutic development. The segment benefits from large-scale production capabilities and substantial R&D investments that demand reliable and high-performance media formulations.
These companies also act as key innovators in adopting serum-free and chemically defined media to meet stringent regulatory standards and ensure scalability. The expansion of biosimilars and biopharmaceutical pipelines has further fueled demand.
With growing collaborations between pharmaceutical firms and academic institutions, coupled with rising emphasis on efficiency and cost optimization, this segment is expected to sustain its leadership in the market.
| Attributes | Details |
|---|---|
| Top Type | Serum-free Media |
| Market Share in 2025 | 51.00% |
Depending on the type, the cell culture media market is bifurcated into serum-free media, CHO media, HEK 293 media, BHK media, VERO cell media, etc. The serum-free media segment dominates the market and is anticipated to hold a market share of 51.00%.
| Attributes | Details |
|---|---|
| Top Application | Cancer Research |
| Market Share in 2025 | 43.40% |
Based on the application, the cell culture media market is categorized into biopharmaceutical production, monoclonal antibodies, vaccine production, cancer research, etc. The cancer research segment dominates the market and is anticipated to hold 43.40% of the market share in 2025.
The cell culture media market is anticipated to surpass a valuation of USD 6,699.93 million by 2035. While the market is expected to experience growth, several factors could adversely affect its development:
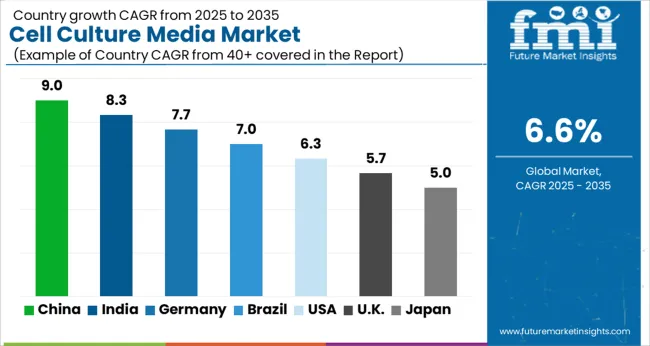
The section provides an analysis of the cell culture media market by country, including Japan, China, the United States, Germany, and the United Kingdom. The table presents the CAGRs of major markets through 2035.
| Countries | CAGR (2025 to 2035) |
|---|---|
| China | 8.50% |
| Japan | 7.70% |
| Germany | 7.40% |
| United States | 7.10% |
| United Kingdom | 7.00% |
China is one of the leading countries in the market. The Chinese cell culture media market is anticipated to retain its dominance by progressing at a CAGR of 8.50% through 2035.
Japan is another Asian country leading the cell culture media market. The Japanese cell culture media market is anticipated to retain its dominance by progressing at an annual growth rate of 7.70% till 2035.
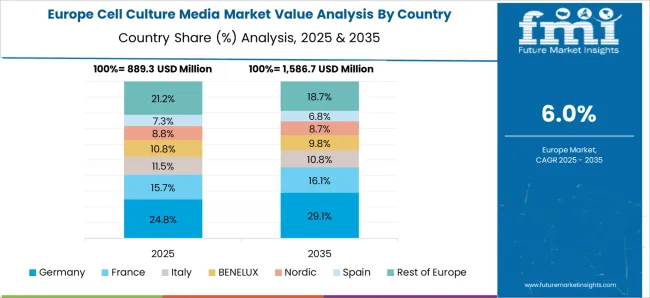
In the European region, Germany dominates the cell culture media market. The German cell culture media market is anticipated to exhibit a CAGR of 7.40% till 2035.
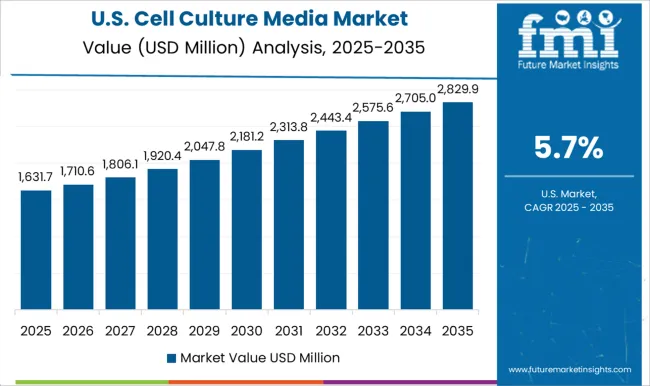
The United States is another country leading the cell culture media market in the North American region. The United States cell culture media market is anticipated to register a CAGR of 7.00% through 2035.
In the European region, the United Kingdom leads the cell culture media market. The demand for cell culture media is projected to rise at a 7.00% CAGR over the next ten years.
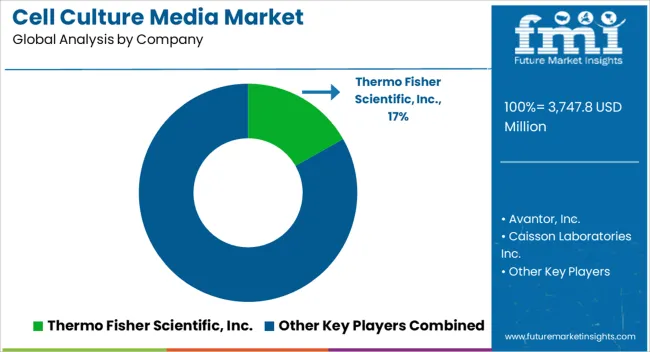
The global cell culture media market is characterized by the presence of key players like Avantor, Inc., Thermo Fisher Scientific, Inc., Caisson Laboratories Inc., Becton Dickinson and Company, Lonza Group AG, Bio-Rad Laboratories, Inc., General Electric Company, etc.
Many companies are investing heavily in research and development to create innovative and specialized cell culture media formulations. This includes developing serum-free and defined media, optimizing existing formulations, and incorporating advanced technologies to meet the evolving needs of biopharmaceutical and life sciences research.
Recent Developments
| Report Attributes | Details |
|---|---|
| Current Total Market Size (2025) | USD 3,513.8 million |
| Projected Market Size (2035) | USD 6,699.93 million |
| CAGR (2025 to 2035) | 6.66% |
| Base Year for Estimation | 2025 |
| Historical Period | 2020 to 2025 |
| Projections Period | 2025 to 2035 |
| Quantitative Units | USD million for value and kiloliters for volume |
| Types Analyzed (Segment 1) | Serum-free Media, CHO Media, HEK 293 Media, BHK Media, VERO Cell Media, Insect Cell Media, Serum-free Stem Cell Media, CAR T-cell Media, Other Serum-free Media, Classical Media & Salts, Stem Cell Culture Media, Specialty Media, Chemically Defined Media, Other Cell Culture Media |
| Applications Analyzed (Segment 2) | Biopharmaceutical Production, Monoclonal Antibodies, Cancer Research, Vaccine Production, Other Therapeutic Proteins, Diagnostics, Drug Screening & Development, Tissue Engineering & Regenerative Medicine, Cell and Gene Therapy, Other Applications |
| End Users Analyzed (Segment 3) | Pharmaceutical & Biotechnology Companies, Hospitals & Diagnostic Laboratories, Research & Academic Institutes, Others |
| Regions Covered | North America; Latin America; Western Europe; Eastern Europe; South Asia and Pacific; East Asia; Middle East & Africa |
| Countries Covered | United States, Canada, Mexico, Brazil, Argentina, Germany, France, United Kingdom, Italy, Spain, Netherlands, China, India, Japan, South Korea, ANZ, GCC Countries, South Africa |
| Key Players influencing the Cell Culture Media Market | Avantor, Inc., Thermo Fisher Scientific, Inc., Caisson Laboratories Inc., Becton Dickinson and Company, Lonza Group AG, Bio-Rad Laboratories, Inc., General Electric Company, Cell Culture Technologies LLC, Corning Incorporated, Fujifilm Holdings Corporation, Hi Media Laboratories Pvt. Ltd., Merck & Co., Inc. |
| Additional Attributes | Dollar sales by media type (serum-free, CHO, stem cell), Dollar sales by application (cancer research, biopharma, diagnostics), End-user adoption in R&D and clinical workflows, Impact of regenerative medicine and personalized therapies, Market trends in chemically defined and specialty media formulations |
| Customization and Pricing | Customization and Pricing Available on Request |
The global cell culture media market is estimated to be valued at USD 3,747.8 million in 2025.
The market size for the cell culture media market is projected to reach USD 7,141.6 million by 2035.
The cell culture media market is expected to grow at a 6.6% CAGR between 2025 and 2035.
The key product types in cell culture media market are serum-free media, cho media, hek 293 media, bhk media, vero cell media, insect cell media, serum-free stem cell media, car t-cell media, other serum-free media, classical media & salts, stem cell culture media, specialty media, chemically defined media and other cell culture media.
In terms of application, cancer research segment to command 43.4% share in the cell culture media market in 2025.


Full Research Suite comprises of:
Market outlook & trends analysis
Interviews & case studies
Strategic recommendations
Vendor profiles & capabilities analysis
5-year forecasts
8 regions and 60+ country-level data splits
Market segment data splits
12 months of continuous data updates
DELIVERED AS:
PDF EXCEL ONLINE
Cell Culture Media & Cell Lines Market Size and Share Forecast Outlook 2025 to 2035
Cell Culture Media Bags Market Analysis - Size, Share, and Forecast 2025 to 2035
China Cell Culture Media Bags Market Insights – Size, Trends & Growth 2025-2035
India Cell Culture Media Bags Market Growth – Demand, Trends & Forecast 2025-2035
France Cell Culture Media Bags Market Trends – Size, Share & Growth 2025-2035
Germany Cell Culture Media Bags Market Growth – Demand, Trends & Forecast 2025-2035
United States Cell Culture Media Bags Market Outlook – Trends, Demand & Forecast 2025-2035
Cellulose Fiber Market Forecast and Outlook 2025 to 2035
Cellulite Treatment Market Size and Share Forecast Outlook 2025 to 2035
Cellulose Derivative Market Size and Share Forecast Outlook 2025 to 2035
Cellulose Film Packaging Market Size and Share Forecast Outlook 2025 to 2035
Cell Therapy Systems Market Size and Share Forecast Outlook 2025 to 2035
Cellular IoT Market Size and Share Forecast Outlook 2025 to 2035
Cell Isolation Market Size and Share Forecast Outlook 2025 to 2035
Cellulose Ether and Derivatives Market Size and Share Forecast Outlook 2025 to 2035
Cellular Push-to-talk Market Size and Share Forecast Outlook 2025 to 2035
Cellulosic Polymers Market Size and Share Forecast Outlook 2025 to 2035
Cellbag Bioreactor Chambers Market Size and Share Forecast Outlook 2025 to 2035
Cell Surface Markers Detection Market Size and Share Forecast Outlook 2025 to 2035
Cellular Modem Market Size and Share Forecast Outlook 2025 to 2035

Thank you!
You will receive an email from our Business Development Manager. Please be sure to check your SPAM/JUNK folder too.
Chat With
MaRIA