Cellophane Tape Market Size and Share Forecast Outlook 2025 to 2035

In 2025, the global cellophane tape market is estimated at USD 2.2 billion and is projected to reach USD 3.3 billion by 2035, growing at a CAGR of 4.1%. This reflects a steady rise in annual demand, with year-on-year gains increasing from around USD 90 million to nearly USD 140 million by the end of the forecast period.
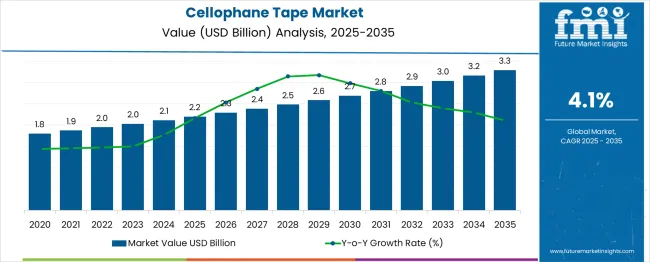
Quick stats ofCellophane Tape Market

  • Cellophane Tape Market Size (2025): USD 2.2 billion
  • Projected Cellophane Tape Market Size (2035): USD 3.3 billion
  • Forecast CAGR of Cellophane Tape Market (2025 to 2035): 4.1%
  • Leading Segment of Cellophane Tape Market (2025): Transparent Tape (46%)
  • Key Growth Regions of Cellophane Tape Market: Asia-Pacific, North America, Europe
  • Top Key Players of Cellophane Tape Market: Henkel (Sellotape), Panfix, Bagla Group, Twin Tech India, Shree Shubh Industries, Globe Industries Corporation, Louis Tape

Cellophane Tape Market Market Value Analysis

Metric Value
Industry Size (2025E) USD 2.2 billion
Industry Value (2035F) USD 3.3 billion
CAGR (2025 to 2035) 4.1%

Growth is primarily driven by the packaging needs of the e-commerce sector, expansion in retail, and widespread use in office and consumer applications. Rising demand for biodegradable and green cellophane tapes made from regenerated cellulose is shaping product development. Innovations in specialty tapes with tamper-evident and weather-resistant properties are also contributing to the market’s upward trajectory.

The market operates within a network of broader industries, each contributing to its market share. Current estimates indicate that the packaging industry accounts for approximately 40% of the market, due to its extensive use of adhesive tapes in sealing and product protection. The stationery and office supplies segment contributes around 25%, driven by widespread application in schools, offices, and households.

The retail and consumer goods market follows with a 15% share, reflecting demand from end-users for everyday utility. The adhesives and sealants sector, representing 10%, supports the market through raw materials and innovation in adhesive formulations. The logistics and transportation make up 10%, as tapes play a key role in packaging, labeling, and securing goods in transit

Len Gould, president and CEO of Q.E.P. Co., Inc., stated, “Our investments in advanced adhesive manufacturing technology ensure we deliver best-in-class American-made products. In a market dominated by private equity and foreign players, ROBERTS® stands as the alternative - combining innovation, quality, and 100% service reliability for global customers.”

This statement, issued in the company’s July 2025 press release, reinforces Q.E.P.’s commitment to domestic manufacturing and long-term value creation. By prioritizing technological advancement and supply chain dependability, the company positions ROBERTS® as a performance-driven, trusted choice in an increasingly competitive and consolidated adhesives market.

Analyzing Cellophane Tape Market by Top Investment Segments

The global cellophane tape market remains strong due to high-volume consumption across stationery, e-commerce, education, and office supply chains. Transparent and acrylic tapes dominate usage due to their clarity, durability, and compatibility with automated dispensers.
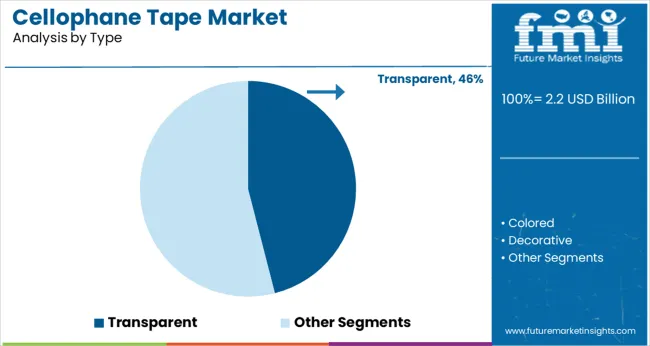
Transparent Tape Dominates with 46% Market Volume in 2025

Cellophane Tape Market Analysis By Type

Transparent cellophane tapes lead the global market with a 46% share due to their versatility and visual clarity across home, office, and commercial uses. They're heavily used in document sealing, gift wrapping, packaging, and repairs.

Major players like 3M (Scotch), Tesa SE, and Nichiban manufacture UV-stable, anti-yellowing transparent tapes that maintain adhesion over time. In education and office supply chains, these tapes account for over 60% of demand. Transparency also helps in barcode and label visibility, making them popular for retail labeling.
  • Over 64% of all SKUs in global stationery categories contain transparent tape
  • Anti-yellowing stability allows up to 3-year shelf life under ambient storage
  • Transparent tapes account for 71% of consumer tape purchases under $5

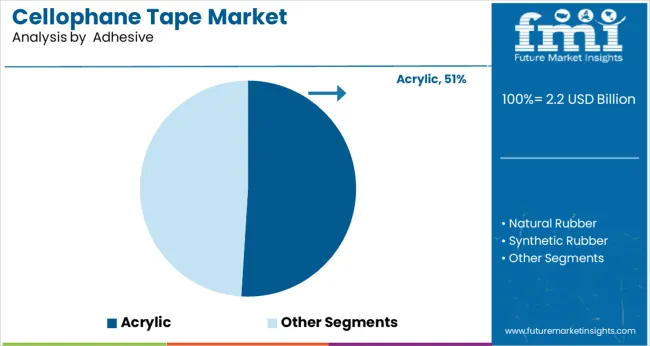
Acrylic Adhesives Hold the Largest Market Share at 51%

Cellophane Tape Market Analysis By Adhesive

Acrylic adhesives dominate the cellophane tape market with 51% global share due to superior bonding performance, weather resistance, and non-toxic composition. Acrylic-based tapes are especially useful in climates with temperature variability, often used in e-commerce and retail packaging.

Compared to natural rubber adhesives, acrylic types offer longer shelf life and less odor. Companies like Intertape Polymer Group, Sekisui, and Tartan Tape manufacture acrylic-backed cellophane products compatible with both manual and automated application systems.
  • Acrylic tapes retain >85% bond strength over a 12-month aging period
  • 3 of 5 top online retail brands globally use acrylic tape for packaging
  • Offers temperature tolerance between -10°C to +75°C across transport cycles

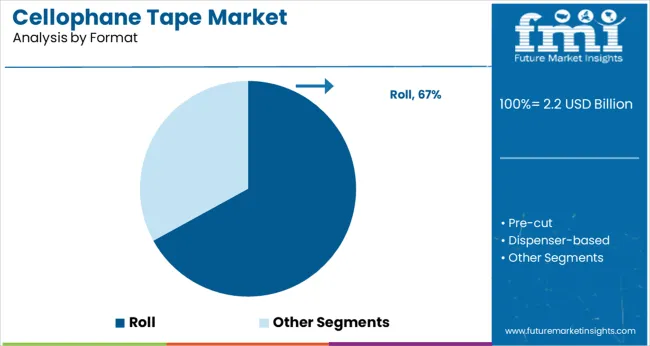
Roll Format Continues to Dominate with 67% Usage Rate

Cellophane Tape Market Analysis By Format

Roll-format tapes lead by 67% in the market due to ease of application, storage, and availability across size variants. Most consumer and professional-grade tapes come in standard rolls of 10-66 meters and widths of 12-25 mm.

Major brands like Scotch, Fevistik, and Tesa offer coreless and core-based roll tapes suited for bulk and single-use applications. In B2B settings, jumbo rolls are used in high-speed automatic dispensers. E-commerce and logistics companies prefer roll format due to reduced wastage and manual effort.
  • Over 61% of global office supply chains stock only roll-based tapes
  • Jumbo rolls (>1000m) for packaging machines grew 18% YoY in 2024
  • 72% of school kits globally include transparent roll tapes

Stationery and Label Protection Drive Over 42% of Applications

Cellophane Tape Market Analysis By Application

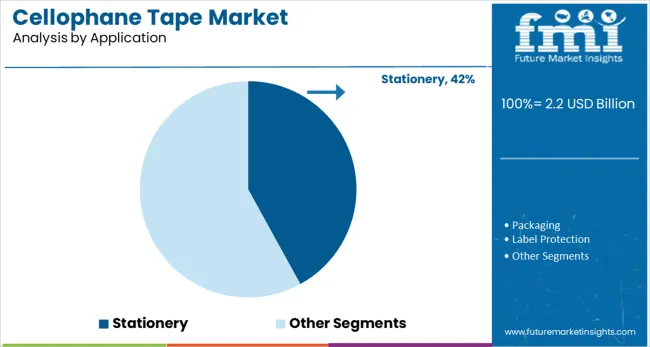
Stationery and label protection use cases account for 42% of total tape applications in 2025, spanning both home and commercial demand. Students, offices, and retailers rely on clear tape for securing documents, reinforcing torn pages, and protecting printed labels.

Printable transparent tape is gaining traction in retail display labeling and temporary signage. Pre-cut and decorative variants are growing in education markets. School boards, educational NGOs, and institutional suppliers represent recurring bulk buyers in this segment.
  • Used in 80%+ of primary and secondary school kits across APAC
  • Transparent tape with label protection coating sees 22% YoY growth
  • Applied in over 63% of bookbinding repair and archiving kits

Office Supplies Remain the Top End-Use with 39% Market Share

Cellophane Tape Market Analysis By End Use Industry

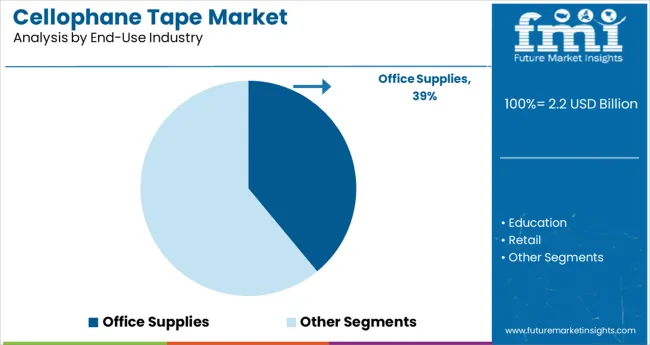
Office supplies represent the highest end-use demand in the market at 39%. Government departments, BPOs, banks, and corporate campuses use large volumes of cellophane tape for administrative tasks. In B2B distribution, combo packs of 6, 12, or 24 rolls are most popular.

Brands like Scotch, Office Depot, and Staples Private Label dominate this space. Desktop dispensers, double-roll systems, and refill packs are frequently ordered through institutional procurement platforms, reflecting high-frequency usage.

  • 77% of tape purchases from office supply catalogues are transparent rolls
  • Dispenser-based tape usage in corporate offices grew by 24% in 2024
  • Office bundles (12+ rolls) contribute 62% of tape revenues in this segment

Top Cellophane Tape Market Dynamics

The market continues to serve retail, office, and industrial packaging needs. Global sales reached 17.4 billion square meters in 2024, with 61% used in carton sealing and labeling. Demand remains tied to logistics throughput, small parcel volumes, and consumer movement toward eco-friendly paper-based adhesives in select regions.

Logistics and Packaging Sectors Remain the Primary Usage DriversCarton sealing applications accounted for 61% of cellophane tape consumption by area in 2024, driven by high turnover in e-commerce packaging and retail fulfillment hubs.

Multi-roll pack formats saw 8.6% volume growth YoY in wholesale distribution. Thermal resistance and secure adhesion under variable humidity supported continued use in transit packaging despite growing interest in polymer-free options.

Paper-Based and Biodegradable Variants Gaining Regional TractionDemand for non-synthetic alternatives rose by 5.1% in 2024, with starch-based adhesives and cellulose backings expanding presence in Western Europe and parts of East Asia.

Japan led adoption of compostable tapes in municipal office supply tenders, while Germany and the Netherlands introduced procurement preferences for plastic-free adhesives in institutional packaging. Biodegradable cellophane rolls averaged £1.68 per unit, 34% higher than synthetic options.

Office Supply Segment Holding Share Amid Digital TransitionStationery applications accounted for 22% of total tape usage volume, down slightly from 24% in 2023 as digital workflows expanded. Despite this shift, branded retail packs remained stable in school and craft channels. Transparent rolls with serrated edges and no-dispenser designs saw modest growth due to increased preference for minimal plastic packaging.

Production Shifts Linked to Raw Material Inputs and Trade RoutesImport substitution trends in Southeast Asia led to a 9.3% increase in local cellophane film extrusion capacity. Feedstock volatility in cotton linters and wood pulp affected pricing in Q1 2025, with roll costs fluctuating by up to 11% in key markets. Shipping delays from East Asian hubs prompted North American suppliers to increase safety stock levels by an average of 7-10 days.
Top Countries Contributing to Growth in the Cellophane Tape Market

Cellophane Tape Market Cagr Analysis By Country

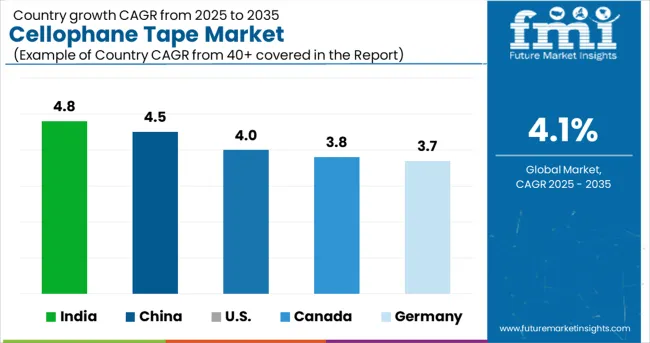
Countries CAGR (2025 to 2035)
India 4.8%
China 4.5%
USA 4.0%
Canada 3.8%
Germany 3.7%

The global market is forecasted to grow at a CAGR of 4.1% from 2025 to 2035. Among the profiled countries, India (BRICS) records the highest growth at 4.8%, exceeding the global rate by 0.7 percentage points. China (BRICS) also outperforms the global average at 4.5% (+0.4%).

The United States (OECD) posts a near-average 4.0%, just 0.1% below the global benchmark. Meanwhile, Canada and Germany (both OECD) trail at 3.8% and 3.7%, respectively. This divergence reflects higher consumption trends and industrial packaging activity in BRICS economies, supported by increasing e-commerce and domestic manufacturing, while growth in OECD markets remains steadier and more mature.

The report covers detailed analysis of 40+ countries, with the top five countries shared as a reference.

Market Dynamics of Cellophane Tape in the United States

The United States market for cellophane tape is forecast to grow at 4.0% CAGR, slightly under the global average. From 2020 to 2024, growth averaged 3.4%, supported by consistent demand in retail packaging, logistics, and commercial office supplies.

Online retail fulfillment continues to drive usage of transparent adhesive products for primary and secondary packaging. Additionally, niche applications such as anti-static cellophane tape are expanding across electronics and semiconductor logistics.

  • Packaging tape usage rose by 11.3% in e-commerce fulfillment centers in 2024
  • Over 28% of all general-purpose tapes sold in the USA were cellulose-based
  • Electronics exporters adopted specialty cellophane tape to reduce static discharge risks

Performance Outlook for Cellophane Tape Market in Canada

Canada is expected to grow at 3.8% CAGR, marginally below global levels. Growth stabilized from a 3.1% CAGR between 2020 and 2024, largely driven by food processing, pharma secondary packaging, and clean-label printing industries.

Environmental preferences are shaping procurement policies, pushing retailers and brand owners to switch from plastic-based to cellulose-based tapes. Demand is gaining from boutique brands focused on green wrapping and biodegradable solutions in urban centers.

  • 19% of independent Canadian retailers adopted biodegradable cellophane tapes by 2024
  • Retail-ready packaging using cellophane tape rose 14% year-over-year
  • Paperboard and compostable tape packaging co-deployments up 9.2% since 2022

Trends in Cellophane Tape Usage in Germany

The marketin Germany is projected to grow at 3.7% CAGR, a modest pace relative to the global average. From 2020 to 2024, the market increased by 2.9%, with demand driven by eco-focused consumer goods and regulatory pressure on plastic packaging.

Cellulose-based tapes are gaining traction in export-ready applications due to compliance with EU Green Deal guidelines. Several paper converting facilities in Bavaria and North Rhine-Westphalia have begun co-locating tape converting lines for integrated production.

  • Over 36% of industrial packaging lines now use cellulose or paper-based tapes
  • Consumer goods brands reduced plastic packaging tape use by 17% over three years
  • Five major tape converters added water-based adhesive lines since 2021

Growth Forecast for Cellophane Tape in China

China is anticipated to grow at 4.5% CAGR, above the global benchmark. Between 2020 and 2024, CAGR stood at 3.6%, with growth fueled by FMCG manufacturing, stationery exports, and packaging standardization.

Expanding logistics networks and e-commerce warehousing continue to boost consumption. Regional manufacturers are diversifying offerings to include custom-printed cellophane tape for retail branding and tamper-evidence in the pharmaceutical supply chain.

  • China exported 23,000 metric tons of cellophane tape in 2024, a 15.8% increase over 2022
  • 31% of adhesive tape sales in Tier 1 cities involved eco-grade variants
  • Over 60 new converting lines were installed across Guangdong and Zhejiang in 2023-24

Future Trends in Cellophane Tape Market in India

India is projected to lead the group with a 4.8% CAGR, outpacing global growth. From 2020 to 2024, CAGR was 3.9%, reflecting expanding consumption in FMCG distribution, organized retail, and textbook packaging in the education sector.

Local converters are scaling capacity to meet demand for tamper-proof and printable tape for value-driven packaging. Rising procurement from Tier 2 and Tier 3 urban centers is diversifying demand across both premium and commodity tape segments.
  • India consumed over 2.6 billion meters of cellophane tape in 2024
  • School and office supply tape volumes rose by 12.7% year-over-year
  • Domestic converting capacity increased by 18% in FY 2023-24

Leading Cellophane Tape Manufacturers, Suppliers, Distributors

Cellophane Tape Market Analysis By Company

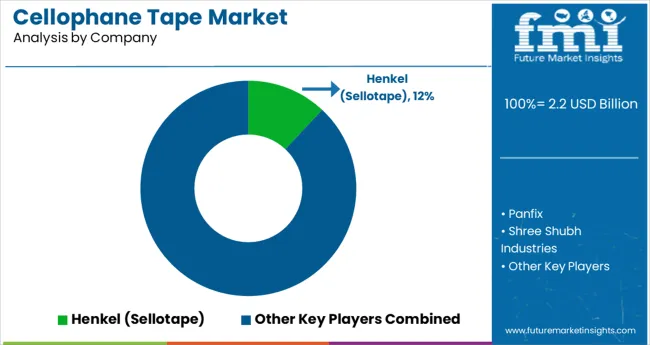
Leading Players - Henkel holding 21% The industry is led by Henkel (Sellotape), which dominates with its strong brand recognition and diversified product range for consumer and industrial use.

Panfix and Bagla Group compete through aggressive pricing and regional distribution networks in Asia. Emerging players like Twin Tech India and Shree Shubh Industries focus on niche segments, such as customized printing and specialty adhesives.

Louis Tape and Globe Industries Corporation target export markets with competitively priced bulk offerings.Entry barriers include high production costs for quality adhesives, established brand loyalty, and stringent performance standards. Large-scale manufacturers benefit from economies of scale, while smaller firms compete through localized supply chains and tailored solutions.

Recent Cellophane Tape Industry News

  • In May 2025, Zeus Group acquired Empire Tapes (UK), a specialist in industrial adhesive technologies, including double-sided and barrier tapes. This merger expands Zeus’ technical capabilities in high-performance adhesives for packaging and industrial applications, strengthening its European market position 10.
  • In 2024, 3M launched the Scotch® Box Lock™ Packaging Tape featuring solvent-free adhesive and manufactured in a zero-waste facility. Designed for universal box compatibility (including 100% recycled cardboard), it enhances tamper-evidence and reduces application time by 25% for e-commerce logistics

Leading Players

  • Henkel (Sellotape)
  • Panfix
  • Shree Shubh Industries
  • Packaging Peddler
  • Ajilo International
  • Louis Tape
  • Twin Tech India
  • Bagla Group
  • Globe Industries Corporation

Report Scope

Report Attributes Details
Current Total Market Size (2025) USD 2.2 billion
Projected Market Size (2035) USD 3.3 billion
CAGR (2025 to 2035) 4.1%
Base Year for Estimation 2024
Historical Period 2020 to 2024
Projection Period 2025 to 2035
Quantitative Units USD billion for value
Product Types Analyzed Transparent, Colored, Decorative, Printed
Adhesive Types Analyzed Acrylic, Natural Rubber, Synthetic Rubber
Applications Analyzed Stationery, Packaging, Label Protection, Arts & Crafts
Format Types Analyzed Roll, Pre-cut, Dispenser- based
End Use Industries Analyzed Office Supplies, Education, Retail, E-commerce
Regions Covered North America, Europe, Asia-Pacific, Latin America, Middle East & Africa
Countries Covered United States, Canada, Germany, United Kingdom, France, Italy, Spain, China, Japan, South Korea, India, Indonesia, Brazil, Mexico, Argentina, South Africa, Egypt, GCC Countries
Key Players Influencing the Market Henkel (Sellotape), Panfix, Shree Shubh Industries, Packaging Peddler, Ajilo International, Louis Tape, Twin Tech India, Bagla Group, Globe Industries Corporation
Additional Attributes Dollar sales by format and adhesive type, demand shift toward dispenser-based tapes in office and retail, eco-friendly acrylic adhesives gain traction, colored and printed tape popular in branding and promotions

Cellophane Tape Market Analyzed by Key Investment Segments 

By Type:

  • Transparent
  • Colored
  • Decorative
  • Printed

By Adhesive:

  • Acrylic
  • Natural Rubber
  • Synthetic Rubber

By Application:

  • Stationery
  • Packaging
  • Label Protection
  • Arts & Crafts

By Format:

  • Roll
  • Pre-cut
  • Dispenser-based

By End-Use Industry:

  • Office Supplies
  • Education
  • Retail
  • E-commerce

By Region:

  • North America
  • Europe
  • Asia-Pacific
  • Latin America
  • Middle East & Africa

Table of Content

  1. Executive Summary
    • Global Market Outlook
    • Demand-side Trends
    • Supply-side Trends
    • Technology Roadmap Analysis
    • Analysis and Recommendations
  2. Market Overview
    • Market Coverage / Taxonomy
    • Market Definition / Scope / Limitations
  3. Market Background
    • Market Dynamics
      • Drivers
      • Restraints
      • Opportunity
      • Trends
    • Scenario Forecast
      • Demand in Optimistic Scenario
      • Demand in Likely Scenario
      • Demand in Conservative Scenario
    • Opportunity Map Analysis
    • Product Life Cycle Analysis
    • Supply Chain Analysis
      • Supply Side Participants and their Roles
        • Producers
        • Mid-Level Participants (Traders/ Agents/ Brokers)
        • Wholesalers and Distributors
      • Value Added and Value Created at Node in the Supply Chain
      • List of Raw Material Suppliers
      • List of Existing and Potential Buyer’s
    • Investment Feasibility Matrix
    • Value Chain Analysis
      • Profit Margin Analysis
      • Wholesalers and Distributors
      • Retailers
    • PESTLE and Porter’s Analysis
    • Regulatory Landscape
      • By Key Regions
      • By Key Countries
    • Regional Parent Market Outlook
    • Production and Consumption Statistics
    • Import and Export Statistics
  4. Global Market Analysis 2020 to 2024 and Forecast, 2025 to 2035
    • Historical Market Size Value (USD Billion) & Volume (Thousand Units) Analysis, 2020 to 2024
    • Current and Future Market Size Value (USD Billion) & Volume (Thousand Units) Projections, 2025 to 2035
      • Y-o-Y Growth Trend Analysis
      • Absolute $ Opportunity Analysis
  5. Global Market Pricing Analysis 2020 to 2024 and Forecast 2025 to 2035
  6. Global Market Analysis 2020 to 2024 and Forecast 2025 to 2035, By Type
    • Introduction / Key Findings
    • Historical Market Size Value (USD Billion) & Volume (Thousand Units) Analysis By Type, 2020 to 2024
    • Current and Future Market Size Value (USD Billion) & Volume (Thousand Units) Analysis and Forecast By Type, 2025 to 2035
      • Transparent
      • Colored
      • Decorative
      • Printed
    • Y-o-Y Growth Trend Analysis By Type, 2020 to 2024
    • Absolute $ Opportunity Analysis By Type, 2025 to 2035
  7. Global Market Analysis 2020 to 2024 and Forecast 2025 to 2035, By Adhesive
    • Introduction / Key Findings
    • Historical Market Size Value (USD Billion) & Volume (Thousand Units) Analysis By Adhesive, 2020 to 2024
    • Current and Future Market Size Value (USD Billion) & Volume (Thousand Units) Analysis and Forecast By Adhesive, 2025 to 2035
      • Acrylic
      • Natural Rubber
      • Synthetic Rubber
    • Y-o-Y Growth Trend Analysis By Adhesive, 2020 to 2024
    • Absolute $ Opportunity Analysis By Adhesive, 2025 to 2035
  8. Global Market Analysis 2020 to 2024 and Forecast 2025 to 2035, By Application
    • Introduction / Key Findings
    • Historical Market Size Value (USD Billion) & Volume (Thousand Units) Analysis By Application, 2020 to 2024
    • Current and Future Market Size Value (USD Billion) & Volume (Thousand Units) Analysis and Forecast By Application, 2025 to 2035
      • Stationery
      • Packaging
      • Label Protection
      • Arts & Crafts
    • Y-o-Y Growth Trend Analysis By Application, 2020 to 2024
    • Absolute $ Opportunity Analysis By Application, 2025 to 2035
  9. Global Market Analysis 2020 to 2024 and Forecast 2025 to 2035, By Format
    • Introduction / Key Findings
    • Historical Market Size Value (USD Billion) & Volume (Thousand Units) Analysis By Format, 2020 to 2024
    • Current and Future Market Size Value (USD Billion) & Volume (Thousand Units) Analysis and Forecast By Format, 2025 to 2035
      • Roll
      • Pre-cut
      • Dispenser-based
    • Y-o-Y Growth Trend Analysis By Format, 2020 to 2024
    • Absolute $ Opportunity Analysis By Format, 2025 to 2035
  10. Global Market Analysis 2020 to 2024 and Forecast 2025 to 2035, By End-Use Industry
    • Introduction / Key Findings
    • Historical Market Size Value (USD Billion) & Volume (Thousand Units) Analysis By End-Use Industry, 2020 to 2024
    • Current and Future Market Size Value (USD Billion) & Volume (Thousand Units) Analysis and Forecast By End-Use Industry, 2025 to 2035
      • Office Supplies
      • Education
      • Retail
      • E-commerce
    • Y-o-Y Growth Trend Analysis By End-Use Industry, 2020 to 2024
    • Absolute $ Opportunity Analysis By End-Use Industry, 2025 to 2035
  11. Global Market Analysis 2020 to 2024 and Forecast 2025 to 2035, By Region
    • Introduction
    • Historical Market Size Value (USD Billion) & Volume (Thousand Units) Analysis By Region, 2020 to 2024
    • Current Market Size Value (USD Billion) & Volume (Thousand Units) Analysis and Forecast By Region, 2025 to 2035
      • North America
      • Latin America
      • Western Europe
      • Eastern Europe
      • East Asia
      • South Asia & Pacific
      • Middle East and Africa
    • Market Attractiveness Analysis By Region
  12. North America Market Analysis 2020 to 2024 and Forecast 2025 to 2035, By Country
    • Historical Market Size Value (USD Billion) & Volume (Thousand Units) Trend Analysis By Market Taxonomy, 2020 to 2024
    • Market Size Value (USD Billion) & Volume (Thousand Units) Forecast By Market Taxonomy, 2025 to 2035
      • By Country
        • USA
        • Canada
        • Mexico
      • By Type
      • By Adhesive
      • By Application
      • By Format
      • By End-Use Industry
    • Market Attractiveness Analysis
      • By Country
      • By Type
      • By Adhesive
      • By Application
      • By Format
      • By End-Use Industry
    • Key Takeaways
  13. Latin America Market Analysis 2020 to 2024 and Forecast 2025 to 2035, By Country
    • Historical Market Size Value (USD Billion) & Volume (Thousand Units) Trend Analysis By Market Taxonomy, 2020 to 2024
    • Market Size Value (USD Billion) & Volume (Thousand Units) Forecast By Market Taxonomy, 2025 to 2035
      • By Country
        • Brazil
        • Argentina
        • Rest of LATAM
      • By Type
      • By Adhesive
      • By Application
      • By Format
      • By End-Use Industry
    • Market Attractiveness Analysis
      • By Country
      • By Type
      • By Adhesive
      • By Application
      • By Format
      • By End-Use Industry
    • Key Takeaways
  14. Western Europe Market Analysis 2020 to 2024 and Forecast 2025 to 2035, By Country
    • Historical Market Size Value (USD Billion) & Volume (Thousand Units) Trend Analysis By Market Taxonomy, 2020 to 2024
    • Market Size Value (USD Billion) & Volume (Thousand Units) Forecast By Market Taxonomy, 2025 to 2035
      • By Country
        • Germany
        • Italy
        • France
        • UK
        • Spain
        • BENELUX
        • Nordic
        • Rest of W.Europe
      • By Type
      • By Adhesive
      • By Application
      • By Format
      • By End-Use Industry
    • Market Attractiveness Analysis
      • By Country
      • By Type
      • By Adhesive
      • By Application
      • By Format
      • By End-Use Industry
    • Key Takeaways
  15. Eastern Europe Market Analysis 2020 to 2024 and Forecast 2025 to 2035, By Country
    • Historical Market Size Value (USD Billion) & Volume (Thousand Units) Trend Analysis By Market Taxonomy, 2020 to 2024
    • Market Size Value (USD Billion) & Volume (Thousand Units) Forecast By Market Taxonomy, 2025 to 2035
      • By Country
        • Russia
        • Hungary
        • Poland
        • Balkan & Baltics
        • Rest of E. Europe
      • By Type
      • By Adhesive
      • By Application
      • By Format
      • By End-Use Industry
    • Market Attractiveness Analysis
      • By Country
      • By Type
      • By Adhesive
      • By Application
      • By Format
      • By End-Use Industry
    • Key Takeaways
  16. East Asia Market Analysis 2020 to 2024 and Forecast 2025 to 2035, By Country
    • Historical Market Size Value (USD Billion) & Volume (Thousand Units) Trend Analysis By Market Taxonomy, 2020 to 2024
    • Market Size Value (USD Billion) & Volume (Thousand Units) Forecast By Market Taxonomy, 2025 to 2035
      • By Country
        • China
        • Japan
        • South Korea
      • By Type
      • By Adhesive
      • By Application
      • By Format
      • By End-Use Industry
    • Market Attractiveness Analysis
      • By Country
      • By Type
      • By Adhesive
      • By Application
      • By Format
      • By End-Use Industry
    • Key Takeaways
  17. South Asia & Pacific Market Analysis 2020 to 2024 and Forecast 2025 to 2035, By Country
    • Historical Market Size Value (USD Billion) & Volume (Thousand Units) Trend Analysis By Market Taxonomy, 2020 to 2024
    • Market Size Value (USD Billion) & Volume (Thousand Units) Forecast By Market Taxonomy, 2025 to 2035
      • By Country
        • India
        • Australia & New Zealand
        • ASEAN
        • Rest of SAP
      • By Type
      • By Adhesive
      • By Application
      • By Format
      • By End-Use Industry
    • Market Attractiveness Analysis
      • By Country
      • By Type
      • By Adhesive
      • By Application
      • By Format
      • By End-Use Industry
    • Key Takeaways
  18. Middle East and Africa Market Analysis 2020 to 2024 and Forecast 2025 to 2035, By Country
    • Historical Market Size Value (USD Billion) & Volume (Thousand Units) Trend Analysis By Market Taxonomy, 2020 to 2024
    • Market Size Value (USD Billion) & Volume (Thousand Units) Forecast By Market Taxonomy, 2025 to 2035
      • By Country
        • GCC Countries
        • Northern Africa
        • South Africa
        • Turkiye
        • Rest of MEA
      • By Type
      • By Adhesive
      • By Application
      • By Format
      • By End-Use Industry
    • Market Attractiveness Analysis
      • By Country
      • By Type
      • By Adhesive
      • By Application
      • By Format
      • By End-Use Industry
    • Key Takeaways
  19. Key Countries Market Analysis
    • USA
      • Pricing Analysis
      • Market Share Analysis, 2024
        • By Type
        • By Adhesive
        • By Application
        • By Format
        • By End-Use Industry
    • Canada
      • Pricing Analysis
      • Market Share Analysis, 2024
        • By Type
        • By Adhesive
        • By Application
        • By Format
        • By End-Use Industry
    • Brazil
      • Pricing Analysis
      • Market Share Analysis, 2024
        • By Type
        • By Adhesive
        • By Application
        • By Format
        • By End-Use Industry
    • Mexico
      • Pricing Analysis
      • Market Share Analysis, 2024
        • By Type
        • By Adhesive
        • By Application
        • By Format
        • By End-Use Industry
    • Argentina
      • Pricing Analysis
      • Market Share Analysis, 2024
        • By Type
        • By Adhesive
        • By Application
        • By Format
        • By End-Use Industry
  20. Market Structure Analysis
    • Competition Dashboard
    • Competition Benchmarking
    • Market Share Analysis of Top Players
      • By Regional
      • By Type
      • By Adhesive
      • By Application
      • By Format
      • By End-Use Industry
  21. Competition Analysis
    • Competition Deep Dive
      • Henkel (Sellotape)
        • Overview
        • Product Portfolio
        • Profitability by Market Segments (Product/Age /Sales Channel/Region)
        • Sales Footprint
        • Strategy Overview
          • Marketing Strategy
          • Product Strategy
          • Channel Strategy
      • Panfix
        • Overview
        • Product Portfolio
        • Profitability by Market Segments (Product/Age /Sales Channel/Region)
        • Sales Footprint
        • Strategy Overview
          • Marketing Strategy
          • Product Strategy
          • Channel Strategy
      • Shree Shubh Industries
        • Overview
        • Product Portfolio
        • Profitability by Market Segments (Product/Age /Sales Channel/Region)
        • Sales Footprint
        • Strategy Overview
          • Marketing Strategy
          • Product Strategy
          • Channel Strategy
      • Packaging Peddler
        • Overview
        • Product Portfolio
        • Profitability by Market Segments (Product/Age /Sales Channel/Region)
        • Sales Footprint
        • Strategy Overview
          • Marketing Strategy
          • Product Strategy
          • Channel Strategy
      • Ajilo International
        • Overview
        • Product Portfolio
        • Profitability by Market Segments (Product/Age /Sales Channel/Region)
        • Sales Footprint
        • Strategy Overview
          • Marketing Strategy
          • Product Strategy
          • Channel Strategy
      • Louis Tape
        • Overview
        • Product Portfolio
        • Profitability by Market Segments (Product/Age /Sales Channel/Region)
        • Sales Footprint
        • Strategy Overview
          • Marketing Strategy
          • Product Strategy
          • Channel Strategy
      • Twin Tech India
        • Overview
        • Product Portfolio
        • Profitability by Market Segments (Product/Age /Sales Channel/Region)
        • Sales Footprint
        • Strategy Overview
          • Marketing Strategy
          • Product Strategy
          • Channel Strategy
      • Bagla Group
        • Overview
        • Product Portfolio
        • Profitability by Market Segments (Product/Age /Sales Channel/Region)
        • Sales Footprint
        • Strategy Overview
          • Marketing Strategy
          • Product Strategy
          • Channel Strategy
      • Globe Industries Corporation
        • Overview
        • Product Portfolio
        • Profitability by Market Segments (Product/Age /Sales Channel/Region)
        • Sales Footprint
        • Strategy Overview
          • Marketing Strategy
          • Product Strategy
          • Channel Strategy
  22. Assumptions & Acronyms Used
  23. Research Methodology

List of Tables

  • Table 1: Global Market Value (USD Billion) Forecast by Region, 2020-2035
  • Table 2: Global Market Volume (Thousand Units) Forecast by Region, 2020-2035
  • Table 3: Global Market Value (USD Billion) Forecast by Type, 2020-2035
  • Table 4: Global Market Volume (Thousand Units) Forecast by Type, 2020-2035
  • Table 5: Global Market Value (USD Billion) Forecast by Adhesive, 2020-2035
  • Table 6: Global Market Volume (Thousand Units) Forecast by Adhesive, 2020-2035
  • Table 7: Global Market Value (USD Billion) Forecast by Application, 2020-2035
  • Table 8: Global Market Volume (Thousand Units) Forecast by Application, 2020-2035
  • Table 9: Global Market Value (USD Billion) Forecast by Format, 2020-2035
  • Table 10: Global Market Volume (Thousand Units) Forecast by Format, 2020-2035
  • Table 11: Global Market Value (USD Billion) Forecast by End-Use Industry, 2020-2035
  • Table 12: Global Market Volume (Thousand Units) Forecast by End-Use Industry, 2020-2035
  • Table 13: North America Market Value (USD Billion) Forecast by Country, 2020-2035
  • Table 14: North America Market Volume (Thousand Units) Forecast by Country, 2020-2035
  • Table 15: North America Market Value (USD Billion) Forecast by Type, 2020-2035
  • Table 16: North America Market Volume (Thousand Units) Forecast by Type, 2020-2035
  • Table 17: North America Market Value (USD Billion) Forecast by Adhesive, 2020-2035
  • Table 18: North America Market Volume (Thousand Units) Forecast by Adhesive, 2020-2035
  • Table 19: North America Market Value (USD Billion) Forecast by Application, 2020-2035
  • Table 20: North America Market Volume (Thousand Units) Forecast by Application, 2020-2035
  • Table 21: North America Market Value (USD Billion) Forecast by Format, 2020-2035
  • Table 22: North America Market Volume (Thousand Units) Forecast by Format, 2020-2035
  • Table 23: North America Market Value (USD Billion) Forecast by End-Use Industry, 2020-2035
  • Table 24: North America Market Volume (Thousand Units) Forecast by End-Use Industry, 2020-2035
  • Table 25: Latin America Market Value (USD Billion) Forecast by Country, 2020-2035
  • Table 26: Latin America Market Volume (Thousand Units) Forecast by Country, 2020-2035
  • Table 27: Latin America Market Value (USD Billion) Forecast by Type, 2020-2035
  • Table 28: Latin America Market Volume (Thousand Units) Forecast by Type, 2020-2035
  • Table 29: Latin America Market Value (USD Billion) Forecast by Adhesive, 2020-2035
  • Table 30: Latin America Market Volume (Thousand Units) Forecast by Adhesive, 2020-2035
  • Table 31: Latin America Market Value (USD Billion) Forecast by Application, 2020-2035
  • Table 32: Latin America Market Volume (Thousand Units) Forecast by Application, 2020-2035
  • Table 33: Latin America Market Value (USD Billion) Forecast by Format, 2020-2035
  • Table 34: Latin America Market Volume (Thousand Units) Forecast by Format, 2020-2035
  • Table 35: Latin America Market Value (USD Billion) Forecast by End-Use Industry, 2020-2035
  • Table 36: Latin America Market Volume (Thousand Units) Forecast by End-Use Industry, 2020-2035
  • Table 37: Western Europe Market Value (USD Billion) Forecast by Country, 2020-2035
  • Table 38: Western Europe Market Volume (Thousand Units) Forecast by Country, 2020-2035
  • Table 39: Western Europe Market Value (USD Billion) Forecast by Type, 2020-2035
  • Table 40: Western Europe Market Volume (Thousand Units) Forecast by Type, 2020-2035
  • Table 41: Western Europe Market Value (USD Billion) Forecast by Adhesive, 2020-2035
  • Table 42: Western Europe Market Volume (Thousand Units) Forecast by Adhesive, 2020-2035
  • Table 43: Western Europe Market Value (USD Billion) Forecast by Application, 2020-2035
  • Table 44: Western Europe Market Volume (Thousand Units) Forecast by Application, 2020-2035
  • Table 45: Western Europe Market Value (USD Billion) Forecast by Format, 2020-2035
  • Table 46: Western Europe Market Volume (Thousand Units) Forecast by Format, 2020-2035
  • Table 47: Western Europe Market Value (USD Billion) Forecast by End-Use Industry, 2020-2035
  • Table 48: Western Europe Market Volume (Thousand Units) Forecast by End-Use Industry, 2020-2035
  • Table 49: Eastern Europe Market Value (USD Billion) Forecast by Country, 2020-2035
  • Table 50: Eastern Europe Market Volume (Thousand Units) Forecast by Country, 2020-2035
  • Table 51: Eastern Europe Market Value (USD Billion) Forecast by Type, 2020-2035
  • Table 52: Eastern Europe Market Volume (Thousand Units) Forecast by Type, 2020-2035
  • Table 53: Eastern Europe Market Value (USD Billion) Forecast by Adhesive, 2020-2035
  • Table 54: Eastern Europe Market Volume (Thousand Units) Forecast by Adhesive, 2020-2035
  • Table 55: Eastern Europe Market Value (USD Billion) Forecast by Application, 2020-2035
  • Table 56: Eastern Europe Market Volume (Thousand Units) Forecast by Application, 2020-2035
  • Table 57: Eastern Europe Market Value (USD Billion) Forecast by Format, 2020-2035
  • Table 58: Eastern Europe Market Volume (Thousand Units) Forecast by Format, 2020-2035
  • Table 59: Eastern Europe Market Value (USD Billion) Forecast by End-Use Industry, 2020-2035
  • Table 60: Eastern Europe Market Volume (Thousand Units) Forecast by End-Use Industry, 2020-2035
  • Table 61: East Asia Market Value (USD Billion) Forecast by Country, 2020-2035
  • Table 62: East Asia Market Volume (Thousand Units) Forecast by Country, 2020-2035
  • Table 63: East Asia Market Value (USD Billion) Forecast by Type, 2020-2035
  • Table 64: East Asia Market Volume (Thousand Units) Forecast by Type, 2020-2035
  • Table 65: East Asia Market Value (USD Billion) Forecast by Adhesive, 2020-2035
  • Table 66: East Asia Market Volume (Thousand Units) Forecast by Adhesive, 2020-2035
  • Table 67: East Asia Market Value (USD Billion) Forecast by Application, 2020-2035
  • Table 68: East Asia Market Volume (Thousand Units) Forecast by Application, 2020-2035
  • Table 69: East Asia Market Value (USD Billion) Forecast by Format, 2020-2035
  • Table 70: East Asia Market Volume (Thousand Units) Forecast by Format, 2020-2035
  • Table 71: East Asia Market Value (USD Billion) Forecast by End-Use Industry, 2020-2035
  • Table 72: East Asia Market Volume (Thousand Units) Forecast by End-Use Industry, 2020-2035
  • Table 73: South Asia & Pacific Market Value (USD Billion) Forecast by Country, 2020-2035
  • Table 74: South Asia & Pacific Market Volume (Thousand Units) Forecast by Country, 2020-2035
  • Table 75: South Asia & Pacific Market Value (USD Billion) Forecast by Type, 2020-2035
  • Table 76: South Asia & Pacific Market Volume (Thousand Units) Forecast by Type, 2020-2035
  • Table 77: South Asia & Pacific Market Value (USD Billion) Forecast by Adhesive, 2020-2035
  • Table 78: South Asia & Pacific Market Volume (Thousand Units) Forecast by Adhesive, 2020-2035
  • Table 79: South Asia & Pacific Market Value (USD Billion) Forecast by Application, 2020-2035
  • Table 80: South Asia & Pacific Market Volume (Thousand Units) Forecast by Application, 2020-2035
  • Table 81: South Asia & Pacific Market Value (USD Billion) Forecast by Format, 2020-2035
  • Table 82: South Asia & Pacific Market Volume (Thousand Units) Forecast by Format, 2020-2035
  • Table 83: South Asia & Pacific Market Value (USD Billion) Forecast by End-Use Industry, 2020-2035
  • Table 84: South Asia & Pacific Market Volume (Thousand Units) Forecast by End-Use Industry, 2020-2035
  • Table 85: Middle East and Africa Market Value (USD Billion) Forecast by Country, 2020-2035
  • Table 86: Middle East and Africa Market Volume (Thousand Units) Forecast by Country, 2020-2035
  • Table 87: Middle East and Africa Market Value (USD Billion) Forecast by Type, 2020-2035
  • Table 88: Middle East and Africa Market Volume (Thousand Units) Forecast by Type, 2020-2035
  • Table 89: Middle East and Africa Market Value (USD Billion) Forecast by Adhesive, 2020-2035
  • Table 90: Middle East and Africa Market Volume (Thousand Units) Forecast by Adhesive, 2020-2035
  • Table 91: Middle East and Africa Market Value (USD Billion) Forecast by Application, 2020-2035
  • Table 92: Middle East and Africa Market Volume (Thousand Units) Forecast by Application, 2020-2035
  • Table 93: Middle East and Africa Market Value (USD Billion) Forecast by Format, 2020-2035
  • Table 94: Middle East and Africa Market Volume (Thousand Units) Forecast by Format, 2020-2035
  • Table 95: Middle East and Africa Market Value (USD Billion) Forecast by End-Use Industry, 2020-2035
  • Table 96: Middle East and Africa Market Volume (Thousand Units) Forecast by End-Use Industry, 2020-2035

List of Figures

  • Figure 1: Global Market Volume (Thousand Units) Forecast 2020-2035
  • Figure 2: Global Market Pricing Analysis
  • Figure 3: Global Market Value (USD Billion) Forecast 2020-2035
  • Figure 4: Global Market Value Share and BPS Analysis by Type, 2025 and 2035
  • Figure 5: Global Market Y-o-Y Growth Comparison by Type, 2025-2035
  • Figure 6: Global Market Attractiveness Analysis by Type
  • Figure 7: Global Market Value Share and BPS Analysis by Adhesive, 2025 and 2035
  • Figure 8: Global Market Y-o-Y Growth Comparison by Adhesive, 2025-2035
  • Figure 9: Global Market Attractiveness Analysis by Adhesive
  • Figure 10: Global Market Value Share and BPS Analysis by Application, 2025 and 2035
  • Figure 11: Global Market Y-o-Y Growth Comparison by Application, 2025-2035
  • Figure 12: Global Market Attractiveness Analysis by Application
  • Figure 13: Global Market Value Share and BPS Analysis by Format, 2025 and 2035
  • Figure 14: Global Market Y-o-Y Growth Comparison by Format, 2025-2035
  • Figure 15: Global Market Attractiveness Analysis by Format
  • Figure 16: Global Market Value Share and BPS Analysis by End-Use Industry, 2025 and 2035
  • Figure 17: Global Market Y-o-Y Growth Comparison by End-Use Industry, 2025-2035
  • Figure 18: Global Market Attractiveness Analysis by End-Use Industry
  • Figure 19: Global Market Value (USD Billion) Share and BPS Analysis by Region, 2025 and 2035
  • Figure 20: Global Market Y-o-Y Growth Comparison by Region, 2025-2035
  • Figure 21: Global Market Attractiveness Analysis by Region
  • Figure 22: North America Market Incremental $ Opportunity, 2025-2035
  • Figure 23: Latin America Market Incremental $ Opportunity, 2025-2035
  • Figure 24: Western Europe Market Incremental $ Opportunity, 2025-2035
  • Figure 25: Eastern Europe Market Incremental $ Opportunity, 2025-2035
  • Figure 26: East Asia Market Incremental $ Opportunity, 2025-2035
  • Figure 27: South Asia & Pacific Market Incremental $ Opportunity, 2025-2035
  • Figure 28: Middle East and Africa Market Incremental $ Opportunity, 2025-2035
  • Figure 29: North America Market Value Share and BPS Analysis by Country, 2025 and 2035
  • Figure 30: North America Market Value Share and BPS Analysis by Type, 2025 and 2035
  • Figure 31: North America Market Y-o-Y Growth Comparison by Type, 2025-2035
  • Figure 32: North America Market Attractiveness Analysis by Type
  • Figure 33: North America Market Value Share and BPS Analysis by Adhesive, 2025 and 2035
  • Figure 34: North America Market Y-o-Y Growth Comparison by Adhesive, 2025-2035
  • Figure 35: North America Market Attractiveness Analysis by Adhesive
  • Figure 36: North America Market Value Share and BPS Analysis by Application, 2025 and 2035
  • Figure 37: North America Market Y-o-Y Growth Comparison by Application, 2025-2035
  • Figure 38: North America Market Attractiveness Analysis by Application
  • Figure 39: North America Market Value Share and BPS Analysis by Format, 2025 and 2035
  • Figure 40: North America Market Y-o-Y Growth Comparison by Format, 2025-2035
  • Figure 41: North America Market Attractiveness Analysis by Format
  • Figure 42: North America Market Value Share and BPS Analysis by End-Use Industry, 2025 and 2035
  • Figure 43: North America Market Y-o-Y Growth Comparison by End-Use Industry, 2025-2035
  • Figure 44: North America Market Attractiveness Analysis by End-Use Industry
  • Figure 45: Latin America Market Value Share and BPS Analysis by Country, 2025 and 2035
  • Figure 46: Latin America Market Value Share and BPS Analysis by Type, 2025 and 2035
  • Figure 47: Latin America Market Y-o-Y Growth Comparison by Type, 2025-2035
  • Figure 48: Latin America Market Attractiveness Analysis by Type
  • Figure 49: Latin America Market Value Share and BPS Analysis by Adhesive, 2025 and 2035
  • Figure 50: Latin America Market Y-o-Y Growth Comparison by Adhesive, 2025-2035
  • Figure 51: Latin America Market Attractiveness Analysis by Adhesive
  • Figure 52: Latin America Market Value Share and BPS Analysis by Application, 2025 and 2035
  • Figure 53: Latin America Market Y-o-Y Growth Comparison by Application, 2025-2035
  • Figure 54: Latin America Market Attractiveness Analysis by Application
  • Figure 55: Latin America Market Value Share and BPS Analysis by Format, 2025 and 2035
  • Figure 56: Latin America Market Y-o-Y Growth Comparison by Format, 2025-2035
  • Figure 57: Latin America Market Attractiveness Analysis by Format
  • Figure 58: Latin America Market Value Share and BPS Analysis by End-Use Industry, 2025 and 2035
  • Figure 59: Latin America Market Y-o-Y Growth Comparison by End-Use Industry, 2025-2035
  • Figure 60: Latin America Market Attractiveness Analysis by End-Use Industry
  • Figure 61: Western Europe Market Value Share and BPS Analysis by Country, 2025 and 2035
  • Figure 62: Western Europe Market Value Share and BPS Analysis by Type, 2025 and 2035
  • Figure 63: Western Europe Market Y-o-Y Growth Comparison by Type, 2025-2035
  • Figure 64: Western Europe Market Attractiveness Analysis by Type
  • Figure 65: Western Europe Market Value Share and BPS Analysis by Adhesive, 2025 and 2035
  • Figure 66: Western Europe Market Y-o-Y Growth Comparison by Adhesive, 2025-2035
  • Figure 67: Western Europe Market Attractiveness Analysis by Adhesive
  • Figure 68: Western Europe Market Value Share and BPS Analysis by Application, 2025 and 2035
  • Figure 69: Western Europe Market Y-o-Y Growth Comparison by Application, 2025-2035
  • Figure 70: Western Europe Market Attractiveness Analysis by Application
  • Figure 71: Western Europe Market Value Share and BPS Analysis by Format, 2025 and 2035
  • Figure 72: Western Europe Market Y-o-Y Growth Comparison by Format, 2025-2035
  • Figure 73: Western Europe Market Attractiveness Analysis by Format
  • Figure 74: Western Europe Market Value Share and BPS Analysis by End-Use Industry, 2025 and 2035
  • Figure 75: Western Europe Market Y-o-Y Growth Comparison by End-Use Industry, 2025-2035
  • Figure 76: Western Europe Market Attractiveness Analysis by End-Use Industry
  • Figure 77: Eastern Europe Market Value Share and BPS Analysis by Country, 2025 and 2035
  • Figure 78: Eastern Europe Market Value Share and BPS Analysis by Type, 2025 and 2035
  • Figure 79: Eastern Europe Market Y-o-Y Growth Comparison by Type, 2025-2035
  • Figure 80: Eastern Europe Market Attractiveness Analysis by Type
  • Figure 81: Eastern Europe Market Value Share and BPS Analysis by Adhesive, 2025 and 2035
  • Figure 82: Eastern Europe Market Y-o-Y Growth Comparison by Adhesive, 2025-2035
  • Figure 83: Eastern Europe Market Attractiveness Analysis by Adhesive
  • Figure 84: Eastern Europe Market Value Share and BPS Analysis by Application, 2025 and 2035
  • Figure 85: Eastern Europe Market Y-o-Y Growth Comparison by Application, 2025-2035
  • Figure 86: Eastern Europe Market Attractiveness Analysis by Application
  • Figure 87: Eastern Europe Market Value Share and BPS Analysis by Format, 2025 and 2035
  • Figure 88: Eastern Europe Market Y-o-Y Growth Comparison by Format, 2025-2035
  • Figure 89: Eastern Europe Market Attractiveness Analysis by Format
  • Figure 90: Eastern Europe Market Value Share and BPS Analysis by End-Use Industry, 2025 and 2035
  • Figure 91: Eastern Europe Market Y-o-Y Growth Comparison by End-Use Industry, 2025-2035
  • Figure 92: Eastern Europe Market Attractiveness Analysis by End-Use Industry
  • Figure 93: East Asia Market Value Share and BPS Analysis by Country, 2025 and 2035
  • Figure 94: East Asia Market Value Share and BPS Analysis by Type, 2025 and 2035
  • Figure 95: East Asia Market Y-o-Y Growth Comparison by Type, 2025-2035
  • Figure 96: East Asia Market Attractiveness Analysis by Type
  • Figure 97: East Asia Market Value Share and BPS Analysis by Adhesive, 2025 and 2035
  • Figure 98: East Asia Market Y-o-Y Growth Comparison by Adhesive, 2025-2035
  • Figure 99: East Asia Market Attractiveness Analysis by Adhesive
  • Figure 100: East Asia Market Value Share and BPS Analysis by Application, 2025 and 2035
  • Figure 101: East Asia Market Y-o-Y Growth Comparison by Application, 2025-2035
  • Figure 102: East Asia Market Attractiveness Analysis by Application
  • Figure 103: East Asia Market Value Share and BPS Analysis by Format, 2025 and 2035
  • Figure 104: East Asia Market Y-o-Y Growth Comparison by Format, 2025-2035
  • Figure 105: East Asia Market Attractiveness Analysis by Format
  • Figure 106: East Asia Market Value Share and BPS Analysis by End-Use Industry, 2025 and 2035
  • Figure 107: East Asia Market Y-o-Y Growth Comparison by End-Use Industry, 2025-2035
  • Figure 108: East Asia Market Attractiveness Analysis by End-Use Industry
  • Figure 109: South Asia & Pacific Market Value Share and BPS Analysis by Country, 2025 and 2035
  • Figure 110: South Asia & Pacific Market Value Share and BPS Analysis by Type, 2025 and 2035
  • Figure 111: South Asia & Pacific Market Y-o-Y Growth Comparison by Type, 2025-2035
  • Figure 112: South Asia & Pacific Market Attractiveness Analysis by Type
  • Figure 113: South Asia & Pacific Market Value Share and BPS Analysis by Adhesive, 2025 and 2035
  • Figure 114: South Asia & Pacific Market Y-o-Y Growth Comparison by Adhesive, 2025-2035
  • Figure 115: South Asia & Pacific Market Attractiveness Analysis by Adhesive
  • Figure 116: South Asia & Pacific Market Value Share and BPS Analysis by Application, 2025 and 2035
  • Figure 117: South Asia & Pacific Market Y-o-Y Growth Comparison by Application, 2025-2035
  • Figure 118: South Asia & Pacific Market Attractiveness Analysis by Application
  • Figure 119: South Asia & Pacific Market Value Share and BPS Analysis by Format, 2025 and 2035
  • Figure 120: South Asia & Pacific Market Y-o-Y Growth Comparison by Format, 2025-2035
  • Figure 121: South Asia & Pacific Market Attractiveness Analysis by Format
  • Figure 122: South Asia & Pacific Market Value Share and BPS Analysis by End-Use Industry, 2025 and 2035
  • Figure 123: South Asia & Pacific Market Y-o-Y Growth Comparison by End-Use Industry, 2025-2035
  • Figure 124: South Asia & Pacific Market Attractiveness Analysis by End-Use Industry
  • Figure 125: Middle East and Africa Market Value Share and BPS Analysis by Country, 2025 and 2035
  • Figure 126: Middle East and Africa Market Value Share and BPS Analysis by Type, 2025 and 2035
  • Figure 127: Middle East and Africa Market Y-o-Y Growth Comparison by Type, 2025-2035
  • Figure 128: Middle East and Africa Market Attractiveness Analysis by Type
  • Figure 129: Middle East and Africa Market Value Share and BPS Analysis by Adhesive, 2025 and 2035
  • Figure 130: Middle East and Africa Market Y-o-Y Growth Comparison by Adhesive, 2025-2035
  • Figure 131: Middle East and Africa Market Attractiveness Analysis by Adhesive
  • Figure 132: Middle East and Africa Market Value Share and BPS Analysis by Application, 2025 and 2035
  • Figure 133: Middle East and Africa Market Y-o-Y Growth Comparison by Application, 2025-2035
  • Figure 134: Middle East and Africa Market Attractiveness Analysis by Application
  • Figure 135: Middle East and Africa Market Value Share and BPS Analysis by Format, 2025 and 2035
  • Figure 136: Middle East and Africa Market Y-o-Y Growth Comparison by Format, 2025-2035
  • Figure 137: Middle East and Africa Market Attractiveness Analysis by Format
  • Figure 138: Middle East and Africa Market Value Share and BPS Analysis by End-Use Industry, 2025 and 2035
  • Figure 139: Middle East and Africa Market Y-o-Y Growth Comparison by End-Use Industry, 2025-2035
  • Figure 140: Middle East and Africa Market Attractiveness Analysis by End-Use Industry
  • Figure 141: Global Market - Tier Structure Analysis
  • Figure 142: Global Market - Company Share Analysis

Frequently Asked Questions

What is the projected market size of the cellophane tape industry by 2035?

The industry is expected to reach USD 3.3 billion by 2035.

What is the CAGR of the global cellophane tape market from 2025 to 2035?

The industry will grow at a CAGR of 4.1% over the forecast period.

Which type of tape holds the largest market share in 2025?

Transparent cellophane tapes lead with a 46% market share.

Which adhesive type dominates the cellophane tape market?

Acrylic adhesives hold the largest share at 51% in 2025.

Who is the leading manufacturer in the global cellophane tape market?

Henkel (Sellotape) leads with an estimated 21% global market share.

Explore Similar Insights

Future Market Insights

Cellophane Tape Market