Duct Tape Market Outlook from 2024 to 2034

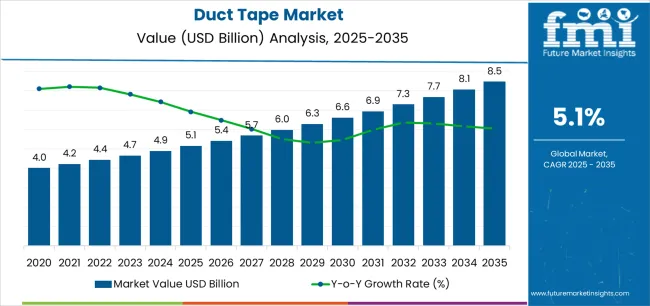
The duct tape market is poised for an evolutionary journey, extending its influence well into 2034 and beyond. The adoption of duct tape is estimated to stand at US$ 4.9 billion in 2024. The market is forecasted to exceed a valuation of US$ 8.0 billion by 2034.

The market is projected to experience moderate growth through 2034, registering a CAGR of 5.1%. Duct tape's demand is primarily driven by its varied functioning in many repair and temporary fix applications, which makes it a go-to choice for short-term fixes and rapid fixes in everyday scenarios.

Attributes Details
Estimated Duct Tape Market Size (2024) US$ 4.9 billion
Forecasted Market Size (2034) US$ 8.0 billion
Projected Value CAGR (2024 to 2034) 5.1%

Don't pay for what you don't need

Customize your report by selecting specific countries or regions and save 30%!

Duct Tape Market Overview

  • The burgeoning eCommerce landscape and heightened logistics operations are poised to unlock fresh opportunities for market expansion. Consequently, there is likely to be around a 1.6X surge in the sales of duct tape by 2034.
  • China and the United States are engaged in intense competition to dominate the market for duct tape due to their robust manufacturing capabilities, extensive distribution networks, and strategic market positioning.
  • Duct tape manufacturers need to think outside the box, leveraging sustainable materials and design advancements while also fostering customer-centric strategies to maintain their edge in the fiercely contested market.

Key Factors Influencing the Global Duct Tape Market Growth

Construction Boom Boosts Duct Tape Demand! The construction industry's constant demand for reliable adhesives and fasteners is a significant factor driving the building & construction tapes market growth.

  • Duct tape's versatility and strength make it indispensable for temporary fixes, sealing, and bonding during construction projects.
  • More than US$ 10 trillion is spent annually on associated goods and services, making the global construction business one of the largest in the world economy. As infrastructure development continues globally, the demand for duct tape as a reliable construction tool remains high.

Duct Tape is the Pit Stop Essential for Automotive Repairs! In the automotive sector, good-grade duct tape serves as a quick-fix solution for several repair and maintenance tasks.

  • In 2022, the global automotive industry, boasting over US$ 2 trillion in revenue, solidified its position as one of the world's largest industries by revenue. From sealing leaks in hoses to temporarily securing loose parts, duct tape provides an immediate solution to common automotive issues.
  • The accessibility and affordability of duct tape make it a preferred choice for professional mechanics, driving its usage within the automotive industry and contributing to market growth.

Duct Tape Adds Flair to Electronics Packaging! Duct tape's availability in various colors and patterns makes it a creative choice for proactive packaging and branding in the consumer electronics industry.

  • Throughout the forecast period, the consumer electronics market is anticipated to develop at a CAGR of 5.80%. Whether it's securing loose cables, providing a quick patch for electronic devices, or temporarily fixing casings, good-grade duct tape is often employed by consumers to address minor issues before seeking professional repairs.
  • The consumer electronics packaging market is projected to grow to US$ 30.4 billion by 2034. Companies often use customized duct tape for packaging, adding a unique and branded touch to their electronics products.

Duct Tape's Versatility Revolutionizes Industrial Settings! Duct tape finds extensive use in manufacturing and industrial settings for multiple applications, including bundling, packaging, and labeling.

  • Its strong adhesive properties and durability make it suitable for securing items during transportation, organizing inventory, and marking machinery.
  • As manufacturing processes continue to evolve and expand, the demand for reliable and versatile tapes like duct tape remains robust, driving growth within the industrial sector.
Ismail Sutaria
Ismail Sutaria

Principal Consultant

Talk to Analyst

Find your sweet spots for generating winning opportunities in this market.

Obstacles Compressing the Duct Tape Market Revenue Trends

Intense competition from alternative products like adhesive tapes and fasteners hampers market expansion. Moreover, fluctuations in raw material prices, such as petroleum-based adhesives, impact the cost-effectiveness of duct tape production. Concerns are also raised by inefficiency in harsh environments and leakage through duct tape, which make it difficult to conserve energy at home.

Historical Market Study on Duct Tape alongside Future Projections

From 2019 to 2023, the duct tape market showed sluggish growth, boasting a 3.0% CAGR. During this period, the market faced various challenges, including fluctuations in raw material prices and increased competition from alternative adhesive solutions. Despite these obstacles, innovative product developments helped sustain moderate growth in the industry. This trend has contributed to the positive outlook of the duct tape industry.

Attributes Quantitative Outlook
Duct Tape Market Size (2023) US$ 4.6 billion
Historical CAGR (2019 to 2023) 3.0%

Short-term Duct Tape Market Analysis

The duct tape market global forecast suggests considerable growth in the market owing to the availability of duct tape in multiple colors, patterns, and widths. This appeals to consumers looking to personalize their belongings or projects. This aspect of customization enhances the aesthetic appeal of duct tape and expands its usage beyond purely functional purposes. Whether it's crafting colorful accessories, decorating household items, or adding flair to DIY projects, the ability to customize duct tape drives consumer interest is likely to contribute to industrial tape market expansion.

Long-term Duct Tape Market Analysis

Global trends in the duct tape industry spotlight the growing demand for environmentally friendly duct tape. Increasing awareness of environmental issues prompts consumers to seek eco-friendly alternatives. Duct tape manufacturers are responding by developing more sustainable options. For instance, Lohmann unveiled their new line of high-tech adhesive tapes in June 2023. These tapes are energy-efficient and come in low-emission and low-odor varieties, which are ideal for bonding car interiors.

In addition to satisfying customer preferences, this focus on sustainability supports corporate social responsibility programs and positions eco-friendly duct tape for market expansion. This is expected to have a highly positive impact on the global demand for duct tape in the long run.

Get the data you need at a Fraction of the cost

Personalize your report by choosing insights you need
and save 40%!

Top Opportunity Awaiting for Duct Tape Market Players

The eCommerce market is on the rise, experiencing robust growth with a CAGR of 19%. The booming eCommerce industry and growing online shopping scene have resulted in increased shipping activities. This presents new opportunities for duct tape sellers.

With more people buying online, there's a greater need for packaging materials like duct tape. This means duct tape manufacturers have a chance to expand and reach more customers. As eCommerce continues to grow, so does the demand for reliable shipping solutions, and duct tape is crucial in securing packages.

Duct Tape Market Trends

  • The integration of smart technologies into duct tape is an emerging trend.
  • Another evolving trend in the duct tape market is the use of decorative duct tape in interior design and home décor.
  • Customization options are also becoming more prevalent in the market, specifically in the repair tapes market
  • The rise of social media platforms has facilitated the sharing of duct tape crafts and DIY projects.

Comparative Analysis of the Adjacent Duct Tape Global Market

The duct tape market, the masking tape market, and the flatback tape market represent distinct segments within the broader adhesive tape industry.

Upon reviewing the provided table, it becomes evident that from 2024 to 2034, all three markets are forecasted to experience comparable growth rates. This is because they cater to different but complementary needs within various industries, such as construction, automotive, and manufacturing.

Despite their specific applications, they share common underlying factors driving their growth, including advancements in adhesive technology and expanding usage in both commercial and consumer sectors.

Duct Tape Market:

Differentiating Aspects Duct Tape Market
CAGR (2024 to 2034) 5.1%
Projected Market Value by 2034 US$ 8.0 billion
Growth Factor Surge in online retail channels providing easy access
Key Trend Rising popularity of duct tape for crafting and artistic purposes

Masking Tape Market:

Differentiating Aspects Masking Tape Market
CAGR (2024 to 2034) 4.5%
Projected Market Value by 2034 US$ 8.8 billion
Growth Factor Growing use of masking tape in automotive painting and detailing
Key Trend Rising preference for eco-friendly and low-VOC masking tape

Flatback Tape Market:

Differentiating Aspects Flatback Tape Market
CAGR (2024 to 2034) 5.5%
Projected Market Value by 2034 US$ 2.0 billion
Growth Factor Demand for flatback tape in the furniture manufacturing industry
Key Trend Rising preference for flatback tape in the aerospace sector

Demand Analysis of Duct Tape by Region

The North America duct tape market stands out as a dominant force. The market here benefits from a well-established infrastructure for manufacturing and distribution, ensuring ample supply and accessibility to consumers. Europe is witnessing continuous and steady growth in demand for duct tape. One significant driver of this trend is the expansion of construction and infrastructure projects across Europe.

The Asia Pacific duct tape industry is likely to progress significantly. The region's robust manufacturing sector, particularly in countries like China and Japan, provides a strong foundation for the production and distribution of duct tape.

Countries Forecasted CAGR (2024 to 2034)
United States 4.5%
United Kingdom 5.6%
Germany 4.0%
China 6.9%
Japan 5.6%

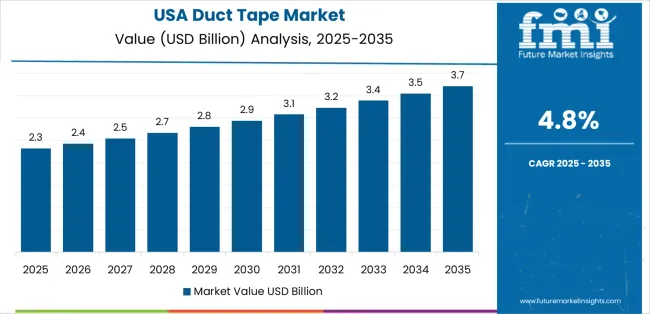
Duct Tape Demand Skyrockets in the United States with the Growing Construction Industry

Demand for duct tape in the United States is set to rise with an anticipated CAGR of 4.5% through 2034. Key factors influencing the duct tape market include:

  • A significant portion of the United States economy is the construction sector. The amount spent on commercial buildings in 2022 was close to US$ 100 billion. The paper tape is heavily influenced by the continuous growth of the building sector. Duct tape is becoming increasingly necessary for on-site or temporary repairs for buildings.
  • The demand for duct tape has increased dramatically as a result of customers' rising inclination toward DIY projects. This trend is supported by growing interest in home décor projects.

Environmental Consciousness Fuels Shift toward Eco-friendly Duct Tape in the United Kingdom

The United Kingdom duct tape market is expected to surge at a CAGR of 5.6% through 2034. The topmost dynamic forces supporting the duct tape adoption in the country include:
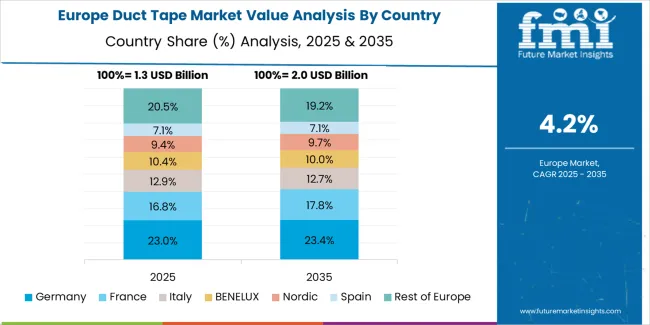
  • The popularity of outdoor activities like camping, hiking, and gardening in the United Kingdom significantly contributes to the demand for duct tape. When exploring outdoors, enthusiasts frequently face equipment damage or urgent repairs. Duct tape emerges as a go-to solution for these scenarios due to its versatility and durability.
  • As awareness of environmental issues continues to grow in the country, manufacturers are introducing biodegradable and recyclable duct tape options that offer comparable performance while minimizing environmental impact.

Duct Tape Demand Surges in Germany's Industrial and Manufacturing Landscape

The market in Germany is likely to exhibit a CAGR of 4.0% through 2034. Reasons supporting the growth of the duct tape market in the country include:

  • Germany's status as a manufacturing and industrial powerhouse drives consistent demand for duct tape. The country's extensive manufacturing sector relies heavily on duct tape for various applications.
  • Germany experiences diverse weather conditions throughout the year, including rain, snow, and fluctuations in temperature. This prompts consumers to use duct tape for weatherproofing and insulation purposes, driving the tough tape market growth.

China's Automotive and eCommerce Giants Propel Duct Tape Industry Expansion

The China Duct Tape market is forecasted to inflate at a CAGR of 6.9% through 2034. Prominent factors backing up the duct waterproof tape market growth are:
  • With almost 30% of all car sales occurring there, China is the largest automotive market in the world. The booming automobile sector is driving up demand for duct tape for auto repair and maintenance as well as aftermarket customization.
  • Exactly half of all online sales worldwide come from China, making it the largest eCommerce market globally. China's eCommerce sales reached a valuation of over US$ 2.68 trillion in 2022. The increasing trend of customers shopping online has led to a boom in demand for duct tape, mainly because of its important function in packing and shipping.

Duct Tape Market Rides the Wave of Technological Advancements in Japan

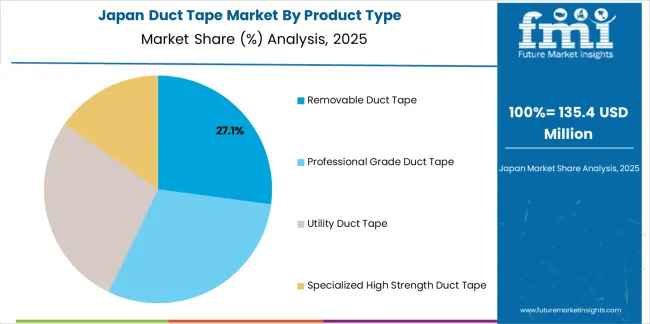
Sales of duct tape in Japan are estimated to record a CAGR of 5.6% through 2034. The primary factors bolstering the industrial tape market size are:

  • Japan's reputation for technological advancements has had a profound impact on various industries, including the duct tape industry. Manufacturers are creating specialty formulas for niche markets like electronics or vehicle maintenance.
  • Producing a broad spectrum of consumer electronics is a significant center for the manufacture of electronics in Japan. In the electronics sector, where accuracy and dependability are critical, duct tape is an indispensable component of assembly and maintenance procedures.

Duct Tape Market Analysis by Segment

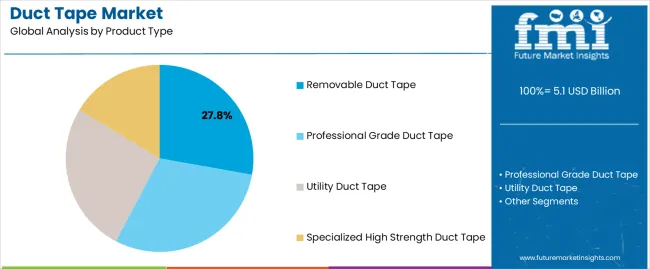
As far as the product type of duct tape is concerned, the professional grade duct tape segment is likely to dominate in 2024, holding 40.1% duct tape market share. Similarly, the sealing segment is expected to lead in terms of application, possessing a 31.6% revenue share of duct tape industry in 2024.

Segment Estimated Market Share in 2024
Professional Grade Duct Tape 40.1%
Sealing 31.6%

Professional Grade Duct Tape Claims the Top Spot in the Market

The professional grade duct tape segment is anticipated to lead the way in the market. Here are a few key factors that contribute to professional grade duct tape’s acceptance in the market:

  • Professional grade duct tape is renowned for its outstanding durability. This makes it highly sought-after for use in demanding applications across multiple industries.
  • Its ability to withstand diverse weather elements, including extreme temperatures, moisture, and UV rays, reinforces its appeal.
  • Over time, it has earned a reputation for reliability and effectiveness, further fueling its popularity among both professionals and consumers.

Duct Tape Emerged as the Preferred Choice for Sealing across Industries

The sealing segment takes the top spot in the duct tape market, an adhesive tape trend validated by factors such as:
  • Duct tape's remarkable adaptability makes it the top choice for sealing tasks across diverse environments, from household fixes to industrial maintenance projects.
  • Duct tape's exceptional ability to repel water reinforces its popularity for sealing tasks. This makes it an indispensable choice for outdoor repairs.
  • The versatility of duct tape with a wide range of materials, such as plastic, metal, wood, and cloth, highlights its superiority even more for sealing.

Competitive Landscape

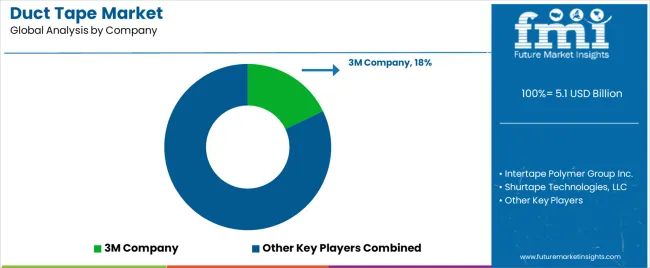
Duct tape market players employ diverse strategies to gain a competitive edge. Key brands such as 3M Company, Intertape Polymer Group Inc., Berry Global Group Inc., and Shurtape Technologies, LLC dominate the industry, offering a wide range of products catering to various needs.

Additionally, private label manufacturers contribute to the competitive landscape, providing alternatives to brand-name offerings. With a focus on durability, adhesion strength, and versatility, these companies vie for consumer preference through innovation and marketing strategies.

Recent Developments

  • Flex Seal unveiled Flex™ Super Wide Duct Tape, the newest product to join the Flex Seal Family of Products, in July 2023. This high-quality duct tape can be ripped by hand and has a strong, reinforced backing that resists water.
  • Following its partnership with Taiwan's INVINCIBLE, the experimental Vans sub-label, Vault by Vans, confirmed the release of its newest in-line product in July 2023. Vans' Vault brand has grown to be known for unusual releases that deviate from the norm; this distressed look is applied to their latest "Lux Duct" pack.

Key Duct Tape Market Players

  • 3M Company
  • Intertape Polymer Group Inc.
  • Shurtape Technologies, LLC
  • Berry Global Group Inc.
  • Pro Tapes & Specialties, Inc.
  • Nadco Tapes & Labels, Inc.
  • MBK Tape Solutions
  • International Plastics Inc.
  • CS Hyde Company
  • Blue Dolphin Tapes
  • PPM Industries S.P.A
  • tesa SE Group
  • Scapa Group plc
  • Advance Tapes International Ltd.
  • Vibac Group S.p.A.
  • Supertape BV
  • SICAD S.p.A.
  • Rotogal di Gallio Angelo & C. s.n.c
  • Nar SpA
  • BO.MA srl
  • Globe Industries Corporation
  • Bolex (Shenzhen) Adhesive Products Co. Ltd
  • Nippon Industries
  • Shree Shubh Industries
  • Lares International
  • Ajit Industries Private Limited (AIPL)
  • Tape India (SHA KUNDNMAL MISRIMAL)
  • Shanghai Yongguan Adhesive Productions Corp., Ltd
  • Ritu Raj Tapes Pvt. Ltd.

Key Coverage in the Duct Tape Market Research Report

  • Adjacent Study on the Heavy-duty Tapes Market, Multipurpose Tapes Market, and the Sealing Tapes Market
  • In-depth Assessment of the Utility Grade Duct Tape Market Trends
  • Opportunity Analysis of Duct Tape in the Cloth Tapes Market and the DIY Tapes Market
  • Examination of Duct Tape’s Positioning in the Flexible Tapes Market
  • Competitive Analysis in the Industrial Tapes Landscape

Key Segments

By Product Type:

  • Removable Duct Tape
  • Professional Grade Duct Tape
  • Utility Duct Tape
  • Specialized High Strength Duct Tape

By Adhesive Type:

  • Natural Rubber based Adhesives
  • Synthetic Rubber based Adhesives

By Backing Type:

  • Plastic
  • Polyethylene
  • Polyvinyl Chloride
  • Polyester
  • Foil
  • Cloth

By Application:

  • Sealing
  • Repairing
  • Holding
  • Waterproofing
  • Coding
  • Strapping
  • Splicing
  • Others

By Thickness:

  • <10 Mil
  • 10 to 15 Mil
  • >15 Mil

By End Use Industry:

  • HVAC
  • Building & Construction
  • Shipping & Logistics
  • Automotive
  • Electrical & Electronics
  • DIY Activities

By Region:

  • North America
  • Latin America
  • Europe
  • East Asia
  • South Asia & Pacific
  • Middle East & Africa (MEA)

Frequently Asked Questions

How Big is the Duct Tape Market?

The market size for duct tape is forecasted to be worth US$ 4.9 billion in 2024.

What is the Demand Forecast for Duct Tape?

The duct tape market value is projected to surpass US$ 8.0 billion by 2034.

What is the Projected CAGR for the Duct Tape Market?

The CAGR of the duct tape industry is estimated to be around 5.1% through 2034.

What is the Key Market Trend in Duct Tape?

Increased demand for eco-friendly duct tape is a key market trend.

Which Countries Drive the Sales of Duct Tape?

The United States, China, and Japan are key consumers of duct tape as of 2024.

Which is the Leading Brand of Duct Tape?

3M Company, Intertape Polymer Group Inc., Shurtape Technologies, LLC, and Berry Global Group Inc. are Duct Tape industry leaders.

Table of Content
1. Executive Summary

    1.1. Global Market Outlook

    1.2. Demand-side Trends

    1.3. Supply-side Trends

    1.4. Technology Roadmap Analysis

    1.5. Analysis and Recommendations

2. Market Overview

    2.1. Market Coverage / Taxonomy

    2.2. Market Definition / Scope / Limitations

3. Market Background

    3.1. Market Dynamics

        3.1.1. Drivers

        3.1.2. Restraints

        3.1.3. Opportunity

        3.1.4. Trends

    3.2. Scenario Forecast

        3.2.1. Demand in Optimistic Scenario

        3.2.2. Demand in Likely Scenario

        3.2.3. Demand in Conservative Scenario

    3.3. Opportunity Map Analysis

    3.4. Product Life Cycle Analysis

    3.5. Supply Chain Analysis

        3.5.1. Supply Side Participants and their Roles

            3.5.1.1. Producers

            3.5.1.2. Mid-Level Participants (Traders/ Agents/ Brokers)

            3.5.1.3. Wholesalers and Distributors

        3.5.2. Value Added and Value Created at Node in the Supply Chain

        3.5.3. List of Raw Material Suppliers

        3.5.4. List of Existing and Potential Buyer’s

    3.6. Investment Feasibility Matrix

    3.7. Value Chain Analysis

        3.7.1. Profit Margin Analysis

        3.7.2. Wholesalers and Distributors

        3.7.3. Retailers

    3.8. PESTLE and Porter’s Analysis

    3.9. Regulatory Landscape

        3.9.1. By Key Regions

        3.9.2. By Key Countries

    3.10. Regional Parent Market Outlook

    3.11. Production and Consumption Statistics

    3.12. Import and Export Statistics

4. Global Market Analysis 2019 to 2023 and Forecast, 2024 to 2034

    4.1. Historical Market Size Value (US$ Million) & Volume (Units) Analysis, 2019 to 2023

    4.2. Current and Future Market Size Value (US$ Million) & Volume (Units) Projections, 2024 to 2034

        4.2.1. Y-o-Y Growth Trend Analysis

        4.2.2. Absolute $ Opportunity Analysis

5. Global Market Analysis 2019 to 2023 and Forecast 2024 to 2034, By Product Type

    5.1. Introduction / Key Findings

    5.2. Historical Market Size Value (US$ Million) & Volume (Units) Analysis By Product Type, 2019 to 2023

    5.3. Current and Future Market Size Value (US$ Million) & Volume (Units) Analysis and Forecast By Product Type, 2024 to 2034

        5.3.1. Removable Duct Tapes

        5.3.2. Professional Grade Duct Tape

        5.3.3. Utility Duct Tapes

        5.3.4. Specialized High Strength Duct Tapes

    5.4. Y-o-Y Growth Trend Analysis By Product Type, 2019 to 2023

    5.5. Absolute $ Opportunity Analysis By Product Type, 2024 to 2034

6. Global Market Analysis 2019 to 2023 and Forecast 2024 to 2034, By Adhesive Type

    6.1. Introduction / Key Findings

    6.2. Historical Market Size Value (US$ Million) & Volume (Units) Analysis By Adhesive Type, 2019 to 2023

    6.3. Current and Future Market Size Value (US$ Million) & Volume (Units) Analysis and Forecast By Adhesive Type, 2024 to 2034

        6.3.1. Natural Rubber Based Adhesives

        6.3.2. Synthetic Rubber Based Adhesives

    6.4. Y-o-Y Growth Trend Analysis By Adhesive Type, 2019 to 2023

    6.5. Absolute $ Opportunity Analysis By Adhesive Type, 2024 to 2034

7. Global Market Analysis 2019 to 2023 and Forecast 2024 to 2034, By Backing Type

    7.1. Introduction / Key Findings

    7.2. Historical Market Size Value (US$ Million) & Volume (Units) Analysis By Backing Type, 2019 to 2023

    7.3. Current and Future Market Size Value (US$ Million) & Volume (Units) Analysis and Forecast By Backing Type, 2024 to 2034

        7.3.1. Plastic

            7.3.1.1. Polyethylene

            7.3.1.2. Polyvinyl Chloride

            7.3.1.3. Polyester

        7.3.2. Foil

        7.3.3. Cloth

    7.4. Y-o-Y Growth Trend Analysis By Backing Type, 2019 to 2023

    7.5. Absolute $ Opportunity Analysis By Backing Type, 2024 to 2034

8. Global Market Analysis 2019 to 2023 and Forecast 2024 to 2034, By Application

    8.1. Introduction / Key Findings

    8.2. Historical Market Size Value (US$ Million) & Volume (Units) Analysis By Application, 2019 to 2023

    8.3. Current and Future Market Size Value (US$ Million) & Volume (Units) Analysis and Forecast By Application, 2024 to 2034

        8.3.1. Sealing

        8.3.2. Repairing

        8.3.3. Holding

        8.3.4. Waterproofing

        8.3.5. Strapping

        8.3.6. Others

    8.4. Y-o-Y Growth Trend Analysis By Application, 2019 to 2023

    8.5. Absolute $ Opportunity Analysis By Application, 2024 to 2034

9. Global Market Analysis 2019 to 2023 and Forecast 2024 to 2034, By Thickness

    9.1. Introduction / Key Findings

    9.2. Historical Market Size Value (US$ Million) & Volume (Units) Analysis By Thickness, 2019 to 2023

    9.3. Current and Future Market Size Value (US$ Million) & Volume (Units) Analysis and Forecast By Thickness, 2024 to 2034

        9.3.1. <10 Mil

        9.3.2. 10 to 15 Mil

        9.3.3. >15 Mil

    9.4. Y-o-Y Growth Trend Analysis By Thickness, 2019 to 2023

    9.5. Absolute $ Opportunity Analysis By Thickness, 2024 to 2034

10. Global Market Analysis 2019 to 2023 and Forecast 2024 to 2034, By End Use Industry

    10.1. Introduction / Key Findings

    10.2. Historical Market Size Value (US$ Million) & Volume (Units) Analysis By End Use Industry, 2019 to 2023

    10.3. Current and Future Market Size Value (US$ Million) & Volume (Units) Analysis and Forecast By End Use Industry, 2024 to 2034

        10.3.1. Building & Construction

        10.3.2. Shipping & Logistics

        10.3.3. Automotive

        10.3.4. Electrical & Electronics

        10.3.5. Others

    10.4. Y-o-Y Growth Trend Analysis By End Use Industry, 2019 to 2023

    10.5. Absolute $ Opportunity Analysis By End Use Industry, 2024 to 2034

11. Global Market Analysis 2019 to 2023 and Forecast 2024 to 2034, By Region

    11.1. Introduction

    11.2. Historical Market Size Value (US$ Million) & Volume (Units) Analysis By Region, 2019 to 2023

    11.3. Current Market Size Value (US$ Million) & Volume (Units) Analysis and Forecast By Region, 2024 to 2034

        11.3.1. North America

        11.3.2. Latin America

        11.3.3. Western Europe

        11.3.4. Eastern Europe

        11.3.5. South Asia and Pacific

        11.3.6. East Asia

        11.3.7. Middle East and Africa

    11.4. Market Attractiveness Analysis By Region

12. North America Market Analysis 2019 to 2023 and Forecast 2024 to 2034, By Country

    12.1. Historical Market Size Value (US$ Million) & Volume (Units) Trend Analysis By Market Taxonomy, 2019 to 2023

    12.2. Market Size Value (US$ Million) & Volume (Units) Forecast By Market Taxonomy, 2024 to 2034

        12.2.1. By Country

            12.2.1.1. USA

            12.2.1.2. Canada

        12.2.2. By Product Type

        12.2.3. By Adhesive Type

        12.2.4. By Backing Type

        12.2.5. By Application

        12.2.6. By Thickness

        12.2.7. By End Use Industry

    12.3. Market Attractiveness Analysis

        12.3.1. By Country

        12.3.2. By Product Type

        12.3.3. By Adhesive Type

        12.3.4. By Backing Type

        12.3.5. By Application

        12.3.6. By Thickness

        12.3.7. By End Use Industry

    12.4. Key Takeaways

13. Latin America Market Analysis 2019 to 2023 and Forecast 2024 to 2034, By Country

    13.1. Historical Market Size Value (US$ Million) & Volume (Units) Trend Analysis By Market Taxonomy, 2019 to 2023

    13.2. Market Size Value (US$ Million) & Volume (Units) Forecast By Market Taxonomy, 2024 to 2034

        13.2.1. By Country

            13.2.1.1. Brazil

            13.2.1.2. Mexico

            13.2.1.3. Rest of Latin America

        13.2.2. By Product Type

        13.2.3. By Adhesive Type

        13.2.4. By Backing Type

        13.2.5. By Application

        13.2.6. By Thickness

        13.2.7. By End Use Industry

    13.3. Market Attractiveness Analysis

        13.3.1. By Country

        13.3.2. By Product Type

        13.3.3. By Adhesive Type

        13.3.4. By Backing Type

        13.3.5. By Application

        13.3.6. By Thickness

        13.3.7. By End Use Industry

    13.4. Key Takeaways

14. Western Europe Market Analysis 2019 to 2023 and Forecast 2024 to 2034, By Country

    14.1. Historical Market Size Value (US$ Million) & Volume (Units) Trend Analysis By Market Taxonomy, 2019 to 2023

    14.2. Market Size Value (US$ Million) & Volume (Units) Forecast By Market Taxonomy, 2024 to 2034

        14.2.1. By Country

            14.2.1.1. Germany

            14.2.1.2. UK

            14.2.1.3. France

            14.2.1.4. Spain

            14.2.1.5. Italy

            14.2.1.6. Rest of Western Europe

        14.2.2. By Product Type

        14.2.3. By Adhesive Type

        14.2.4. By Backing Type

        14.2.5. By Application

        14.2.6. By Thickness

        14.2.7. By End Use Industry

    14.3. Market Attractiveness Analysis

        14.3.1. By Country

        14.3.2. By Product Type

        14.3.3. By Adhesive Type

        14.3.4. By Backing Type

        14.3.5. By Application

        14.3.6. By Thickness

        14.3.7. By End Use Industry

    14.4. Key Takeaways

15. Eastern Europe Market Analysis 2019 to 2023 and Forecast 2024 to 2034, By Country

    15.1. Historical Market Size Value (US$ Million) & Volume (Units) Trend Analysis By Market Taxonomy, 2019 to 2023

    15.2. Market Size Value (US$ Million) & Volume (Units) Forecast By Market Taxonomy, 2024 to 2034

        15.2.1. By Country

            15.2.1.1. Poland

            15.2.1.2. Russia

            15.2.1.3. Czech Republic

            15.2.1.4. Romania

            15.2.1.5. Rest of Eastern Europe

        15.2.2. By Product Type

        15.2.3. By Adhesive Type

        15.2.4. By Backing Type

        15.2.5. By Application

        15.2.6. By Thickness

        15.2.7. By End Use Industry

    15.3. Market Attractiveness Analysis

        15.3.1. By Country

        15.3.2. By Product Type

        15.3.3. By Adhesive Type

        15.3.4. By Backing Type

        15.3.5. By Application

        15.3.6. By Thickness

        15.3.7. By End Use Industry

    15.4. Key Takeaways

16. South Asia and Pacific Market Analysis 2019 to 2023 and Forecast 2024 to 2034, By Country

    16.1. Historical Market Size Value (US$ Million) & Volume (Units) Trend Analysis By Market Taxonomy, 2019 to 2023

    16.2. Market Size Value (US$ Million) & Volume (Units) Forecast By Market Taxonomy, 2024 to 2034

        16.2.1. By Country

            16.2.1.1. India

            16.2.1.2. Bangladesh

            16.2.1.3. Australia

            16.2.1.4. New Zealand

            16.2.1.5. Rest of South Asia and Pacific

        16.2.2. By Product Type

        16.2.3. By Adhesive Type

        16.2.4. By Backing Type

        16.2.5. By Application

        16.2.6. By Thickness

        16.2.7. By End Use Industry

    16.3. Market Attractiveness Analysis

        16.3.1. By Country

        16.3.2. By Product Type

        16.3.3. By Adhesive Type

        16.3.4. By Backing Type

        16.3.5. By Application

        16.3.6. By Thickness

        16.3.7. By End Use Industry

    16.4. Key Takeaways

17. East Asia Market Analysis 2019 to 2023 and Forecast 2024 to 2034, By Country

    17.1. Historical Market Size Value (US$ Million) & Volume (Units) Trend Analysis By Market Taxonomy, 2019 to 2023

    17.2. Market Size Value (US$ Million) & Volume (Units) Forecast By Market Taxonomy, 2024 to 2034

        17.2.1. By Country

            17.2.1.1. China

            17.2.1.2. Japan

            17.2.1.3. South Korea

        17.2.2. By Product Type

        17.2.3. By Adhesive Type

        17.2.4. By Backing Type

        17.2.5. By Application

        17.2.6. By Thickness

        17.2.7. By End Use Industry

    17.3. Market Attractiveness Analysis

        17.3.1. By Country

        17.3.2. By Product Type

        17.3.3. By Adhesive Type

        17.3.4. By Backing Type

        17.3.5. By Application

        17.3.6. By Thickness

        17.3.7. By End Use Industry

    17.4. Key Takeaways

18. Middle East and Africa Market Analysis 2019 to 2023 and Forecast 2024 to 2034, By Country

    18.1. Historical Market Size Value (US$ Million) & Volume (Units) Trend Analysis By Market Taxonomy, 2019 to 2023

    18.2. Market Size Value (US$ Million) & Volume (Units) Forecast By Market Taxonomy, 2024 to 2034

        18.2.1. By Country

            18.2.1.1. GCC Countries

            18.2.1.2. South Africa

            18.2.1.3. Israel

            18.2.1.4. Rest of MEA

        18.2.2. By Product Type

        18.2.3. By Adhesive Type

        18.2.4. By Backing Type

        18.2.5. By Application

        18.2.6. By Thickness

        18.2.7. By End Use Industry

    18.3. Market Attractiveness Analysis

        18.3.1. By Country

        18.3.2. By Product Type

        18.3.3. By Adhesive Type

        18.3.4. By Backing Type

        18.3.5. By Application

        18.3.6. By Thickness

        18.3.7. By End Use Industry

    18.4. Key Takeaways

19. Key Countries Market Analysis

    19.1. USA

        19.1.1. Pricing Analysis

        19.1.2. Market Share Analysis, 2023

            19.1.2.1. By Product Type

            19.1.2.2. By Adhesive Type

            19.1.2.3. By Backing Type

            19.1.2.4. By Application

            19.1.2.5. By Thickness

            19.1.2.6. By End Use Industry

    19.2. Canada

        19.2.1. Pricing Analysis

        19.2.2. Market Share Analysis, 2023

            19.2.2.1. By Product Type

            19.2.2.2. By Adhesive Type

            19.2.2.3. By Backing Type

            19.2.2.4. By Application

            19.2.2.5. By Thickness

            19.2.2.6. By End Use Industry

    19.3. Brazil

        19.3.1. Pricing Analysis

        19.3.2. Market Share Analysis, 2023

            19.3.2.1. By Product Type

            19.3.2.2. By Adhesive Type

            19.3.2.3. By Backing Type

            19.3.2.4. By Application

            19.3.2.5. By Thickness

            19.3.2.6. By End Use Industry

    19.4. Mexico

        19.4.1. Pricing Analysis

        19.4.2. Market Share Analysis, 2023

            19.4.2.1. By Product Type

            19.4.2.2. By Adhesive Type

            19.4.2.3. By Backing Type

            19.4.2.4. By Application

            19.4.2.5. By Thickness

            19.4.2.6. By End Use Industry

    19.5. Germany

        19.5.1. Pricing Analysis

        19.5.2. Market Share Analysis, 2023

            19.5.2.1. By Product Type

            19.5.2.2. By Adhesive Type

            19.5.2.3. By Backing Type

            19.5.2.4. By Application

            19.5.2.5. By Thickness

            19.5.2.6. By End Use Industry

    19.6. UK

        19.6.1. Pricing Analysis

        19.6.2. Market Share Analysis, 2023

            19.6.2.1. By Product Type

            19.6.2.2. By Adhesive Type

            19.6.2.3. By Backing Type

            19.6.2.4. By Application

            19.6.2.5. By Thickness

            19.6.2.6. By End Use Industry

    19.7. France

        19.7.1. Pricing Analysis

        19.7.2. Market Share Analysis, 2023

            19.7.2.1. By Product Type

            19.7.2.2. By Adhesive Type

            19.7.2.3. By Backing Type

            19.7.2.4. By Application

            19.7.2.5. By Thickness

            19.7.2.6. By End Use Industry

    19.8. Spain

        19.8.1. Pricing Analysis

        19.8.2. Market Share Analysis, 2023

            19.8.2.1. By Product Type

            19.8.2.2. By Adhesive Type

            19.8.2.3. By Backing Type

            19.8.2.4. By Application

            19.8.2.5. By Thickness

            19.8.2.6. By End Use Industry

    19.9. Italy

        19.9.1. Pricing Analysis

        19.9.2. Market Share Analysis, 2023

            19.9.2.1. By Product Type

            19.9.2.2. By Adhesive Type

            19.9.2.3. By Backing Type

            19.9.2.4. By Application

            19.9.2.5. By Thickness

            19.9.2.6. By End Use Industry

    19.10. Poland

        19.10.1. Pricing Analysis

        19.10.2. Market Share Analysis, 2023

            19.10.2.1. By Product Type

            19.10.2.2. By Adhesive Type

            19.10.2.3. By Backing Type

            19.10.2.4. By Application

            19.10.2.5. By Thickness

            19.10.2.6. By End Use Industry

    19.11. Russia

        19.11.1. Pricing Analysis

        19.11.2. Market Share Analysis, 2023

            19.11.2.1. By Product Type

            19.11.2.2. By Adhesive Type

            19.11.2.3. By Backing Type

            19.11.2.4. By Application

            19.11.2.5. By Thickness

            19.11.2.6. By End Use Industry

    19.12. Czech Republic

        19.12.1. Pricing Analysis

        19.12.2. Market Share Analysis, 2023

            19.12.2.1. By Product Type

            19.12.2.2. By Adhesive Type

            19.12.2.3. By Backing Type

            19.12.2.4. By Application

            19.12.2.5. By Thickness

            19.12.2.6. By End Use Industry

    19.13. Romania

        19.13.1. Pricing Analysis

        19.13.2. Market Share Analysis, 2023

            19.13.2.1. By Product Type

            19.13.2.2. By Adhesive Type

            19.13.2.3. By Backing Type

            19.13.2.4. By Application

            19.13.2.5. By Thickness

            19.13.2.6. By End Use Industry

    19.14. India

        19.14.1. Pricing Analysis

        19.14.2. Market Share Analysis, 2023

            19.14.2.1. By Product Type

            19.14.2.2. By Adhesive Type

            19.14.2.3. By Backing Type

            19.14.2.4. By Application

            19.14.2.5. By Thickness

            19.14.2.6. By End Use Industry

    19.15. Bangladesh

        19.15.1. Pricing Analysis

        19.15.2. Market Share Analysis, 2023

            19.15.2.1. By Product Type

            19.15.2.2. By Adhesive Type

            19.15.2.3. By Backing Type

            19.15.2.4. By Application

            19.15.2.5. By Thickness

            19.15.2.6. By End Use Industry

    19.16. Australia

        19.16.1. Pricing Analysis

        19.16.2. Market Share Analysis, 2023

            19.16.2.1. By Product Type

            19.16.2.2. By Adhesive Type

            19.16.2.3. By Backing Type

            19.16.2.4. By Application

            19.16.2.5. By Thickness

            19.16.2.6. By End Use Industry

    19.17. New Zealand

        19.17.1. Pricing Analysis

        19.17.2. Market Share Analysis, 2023

            19.17.2.1. By Product Type

            19.17.2.2. By Adhesive Type

            19.17.2.3. By Backing Type

            19.17.2.4. By Application

            19.17.2.5. By Thickness

            19.17.2.6. By End Use Industry

    19.18. China

        19.18.1. Pricing Analysis

        19.18.2. Market Share Analysis, 2023

            19.18.2.1. By Product Type

            19.18.2.2. By Adhesive Type

            19.18.2.3. By Backing Type

            19.18.2.4. By Application

            19.18.2.5. By Thickness

            19.18.2.6. By End Use Industry

    19.19. Japan

        19.19.1. Pricing Analysis

        19.19.2. Market Share Analysis, 2023

            19.19.2.1. By Product Type

            19.19.2.2. By Adhesive Type

            19.19.2.3. By Backing Type

            19.19.2.4. By Application

            19.19.2.5. By Thickness

            19.19.2.6. By End Use Industry

    19.20. South Korea

        19.20.1. Pricing Analysis

        19.20.2. Market Share Analysis, 2023

            19.20.2.1. By Product Type

            19.20.2.2. By Adhesive Type

            19.20.2.3. By Backing Type

            19.20.2.4. By Application

            19.20.2.5. By Thickness

            19.20.2.6. By End Use Industry

    19.21. GCC Countries

        19.21.1. Pricing Analysis

        19.21.2. Market Share Analysis, 2023

            19.21.2.1. By Product Type

            19.21.2.2. By Adhesive Type

            19.21.2.3. By Backing Type

            19.21.2.4. By Application

            19.21.2.5. By Thickness

            19.21.2.6. By End Use Industry

    19.22. South Africa

        19.22.1. Pricing Analysis

        19.22.2. Market Share Analysis, 2023

            19.22.2.1. By Product Type

            19.22.2.2. By Adhesive Type

            19.22.2.3. By Backing Type

            19.22.2.4. By Application

            19.22.2.5. By Thickness

            19.22.2.6. By End Use Industry

    19.23. Israel

        19.23.1. Pricing Analysis

        19.23.2. Market Share Analysis, 2023

            19.23.2.1. By Product Type

            19.23.2.2. By Adhesive Type

            19.23.2.3. By Backing Type

            19.23.2.4. By Application

            19.23.2.5. By Thickness

            19.23.2.6. By End Use Industry

20. Market Structure Analysis

    20.1. Competition Dashboard

    20.2. Competition Benchmarking

    20.3. Market Share Analysis of Top Players

        20.3.1. By Regional

        20.3.2. By Product Type

        20.3.3. By Adhesive Type

        20.3.4. By Backing Type

        20.3.5. By Application

        20.3.6. By Thickness

        20.3.7. By End Use Industry

21. Competition Analysis

    21.1. Competition Deep Dive

        21.1.1. 3M Company

            21.1.1.1. Overview

            21.1.1.2. Product Portfolio

            21.1.1.3. Profitability by Market Segments

            21.1.1.4. Sales Footprint

            21.1.1.5. Strategy Overview

                21.1.1.5.1. Marketing Strategy

                21.1.1.5.2. Product Strategy

                21.1.1.5.3. Channel Strategy

        21.1.2. Intertape Polymer Group Inc.

            21.1.2.1. Overview

            21.1.2.2. Product Portfolio

            21.1.2.3. Profitability by Market Segments

            21.1.2.4. Sales Footprint

            21.1.2.5. Strategy Overview

                21.1.2.5.1. Marketing Strategy

                21.1.2.5.2. Product Strategy

                21.1.2.5.3. Channel Strategy

        21.1.3. Shurtape Technologies, LLC

            21.1.3.1. Overview

            21.1.3.2. Product Portfolio

            21.1.3.3. Profitability by Market Segments

            21.1.3.4. Sales Footprint

            21.1.3.5. Strategy Overview

                21.1.3.5.1. Marketing Strategy

                21.1.3.5.2. Product Strategy

                21.1.3.5.3. Channel Strategy

        21.1.4. Berry Global Group Inc.

            21.1.4.1. Overview

            21.1.4.2. Product Portfolio

            21.1.4.3. Profitability by Market Segments

            21.1.4.4. Sales Footprint

            21.1.4.5. Strategy Overview

                21.1.4.5.1. Marketing Strategy

                21.1.4.5.2. Product Strategy

                21.1.4.5.3. Channel Strategy

        21.1.5. Pro Tapes & Specialties, Inc.

            21.1.5.1. Overview

            21.1.5.2. Product Portfolio

            21.1.5.3. Profitability by Market Segments

            21.1.5.4. Sales Footprint

            21.1.5.5. Strategy Overview

                21.1.5.5.1. Marketing Strategy

                21.1.5.5.2. Product Strategy

                21.1.5.5.3. Channel Strategy

        21.1.6. Nadco Tapes & Labels, Inc.

            21.1.6.1. Overview

            21.1.6.2. Product Portfolio

            21.1.6.3. Profitability by Market Segments

            21.1.6.4. Sales Footprint

            21.1.6.5. Strategy Overview

                21.1.6.5.1. Marketing Strategy

                21.1.6.5.2. Product Strategy

                21.1.6.5.3. Channel Strategy

        21.1.7. MBK Tape Solutions

            21.1.7.1. Overview

            21.1.7.2. Product Portfolio

            21.1.7.3. Profitability by Market Segments

            21.1.7.4. Sales Footprint

            21.1.7.5. Strategy Overview

                21.1.7.5.1. Marketing Strategy

                21.1.7.5.2. Product Strategy

                21.1.7.5.3. Channel Strategy

        21.1.8. International Plastics Inc.

            21.1.8.1. Overview

            21.1.8.2. Product Portfolio

            21.1.8.3. Profitability by Market Segments

            21.1.8.4. Sales Footprint

            21.1.8.5. Strategy Overview

                21.1.8.5.1. Marketing Strategy

                21.1.8.5.2. Product Strategy

                21.1.8.5.3. Channel Strategy

        21.1.9. Advance Tapes International Ltd.

            21.1.9.1. Overview

            21.1.9.2. Product Portfolio

            21.1.9.3. Profitability by Market Segments

            21.1.9.4. Sales Footprint

            21.1.9.5. Strategy Overview

                21.1.9.5.1. Marketing Strategy

                21.1.9.5.2. Product Strategy

                21.1.9.5.3. Channel Strategy

        21.1.10. Blue Dolphin Tapes

            21.1.10.1. Overview

            21.1.10.2. Product Portfolio

            21.1.10.3. Profitability by Market Segments

            21.1.10.4. Sales Footprint

            21.1.10.5. Strategy Overview

                21.1.10.5.1. Marketing Strategy

                21.1.10.5.2. Product Strategy

                21.1.10.5.3. Channel Strategy

        21.1.11. PPM Industries S.P.A

            21.1.11.1. Overview

            21.1.11.2. Product Portfolio

            21.1.11.3. Profitability by Market Segments

            21.1.11.4. Sales Footprint

            21.1.11.5. Strategy Overview

                21.1.11.5.1. Marketing Strategy

                21.1.11.5.2. Product Strategy

                21.1.11.5.3. Channel Strategy

22. Assumptions & Acronyms Used

23. Research Methodology
Recommendations

Packaging

Flatback Tape Market

January 2022

REP-GB-2789

February 2024

309 pages

Packaging

Masking Tape Market

January 2021

REP-GB-2642

January 2024

222 pages

Explore Packaging Insights

View Reports