Induction Hob Market Overview for 2023 to 2033

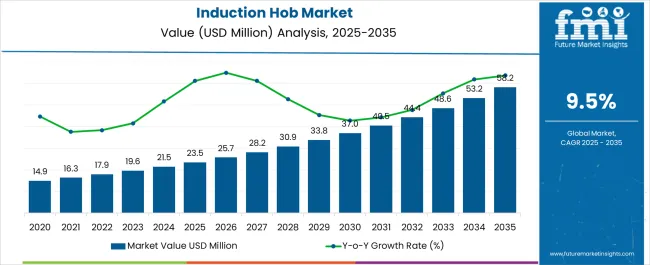
The induction hob market is expected to be worth US$ 19.6 million in 2023. The valuation in 2022 was US$ 18.9 million. The market is anticipated to progress at a promising rate over the period from 2023 to 2033, with a CAGR of 9.5%. By the end of the forecast period in 2033, the value of the market is expected to have shot up to US$ 48.7 million.

Induction Hob Market Analysis

  • Naturally, the sale of induction hobs is reliant on the adaption of the product in the kitchen. A rise in both residential buildings and commercial spaces, meaning more kitchens, is thus conducive to the growth of the induction hob market.
  • Induction hob has earned a reputation for fast heating, leading to efficiency in the kitchen. With the working population characterized by busyness, the efficiency of induction hobs is thus endearing the product to consumers.
  • Induction hob is recognized to be safer to use than traditional gas or electric hobs. Because the hob ring itself is not heated, the chances of injuries are lessened for customers. Thus, safety is another measure that is contributing to the popularity of the product.
  • Induction hobs are an eco-friendly way of heating. As consumers and industries become more aware of sustainability, induction hobs are being preferred instead of traditional cooking hobs.
  • Induction hob is an appliance that can be fitted neatly into modular kitchens. As the adoption of modular kitchens increases, so does the adoption of induction hobs.
Attributes Details
Induction Hob Market Value for 2023 US$ 19.6 million
Projected Market Value for 2033 US$ 48.7 million
Value-based CAGR of Market for 2023 to 2033 9.5%

Don't pay for what you don't need

Customize your report by selecting specific countries or regions and save 30%!

Historical Performance of the Induction Hob Market

The induction hob market is tipped to have been valued at US$ 13.5 million in 2018. The market is likely to have had a healthy CAGR of 8.8% for the historical period from 2018 to 2022.

There was a gradual increase in the adoption of induction hobs into kitchens. The pandemic resulted in a number of people taking to cooking at home. Thus, there was an increased demand for kitchen appliances, including induction hobs. Conversely, the commercial sector, including restaurants, bars, and cafes, faced closure, proving to be a stumbling block for the market. However, with the reopening of public spaces, the market flourished again. By the end of the historical period in 2022, the value of the induction hob market had reached US$ 18.9 million.

Market Valuation (2018) US$ 13.5 million
Historical CAGR (2018 to 2022) 8.8%
Historical Market Valuation (2022) US$ 18.9 million

Long Term Analysis of the Induction Hob Market

For 2023, the value of the induction hob market is estimated at US$ 19.6 million. During the forecast period from 2023 to 2033, the market is expected to progress at an encouraging pace, with a CAGR of 9.5%.

Growth in the number of kitchens facilitates the sale of induction hob. The number of kitchens is rising as a result of growth in the number of eateries as well as the number of homes. In both commercial spaces and residences, the induction hob is proving to be a reliable product. Thus, the progress of the kitchen appliance is forecasted to be encouraging over the forecast period.

With sustainability trends predicted to continue growing over the forecast period, eco-friendly kitchen appliances are in for good growth. Induction hobs fall under the eco-friendly kitchen appliances umbrella and thus are seeing rapid growth. In addition, the safety and the efficiency provided by the product is predicted to help the market in the forecast period. By 2033, the market is projected to have grown to US$ 48.7 million.

Sudip Saha
Sudip Saha

Principal Consultant

Talk to Analyst

Find your sweet spots for generating winning opportunities in this market.

Market Trends in Induction Hob

  • There has been a growing trend of moving away from traditional kitchen appliances to more technologically-evolved ones. Especially in commercial kitchens, where efficiency is key, there is demand for high-tech appliances. Thus, the popularity of induction hob is growing.
  • Sale of induction hobs online is growing. As induction hobs are getting more compact, customers are not averse to buying the product online.
  • Smart kitchens are emerging to be a significant trend. Energy-efficient and time-saving appliances like induction hobs are a significant requirement of smart kitchens. Thus, the emergence of smart kitchens is aiding the market.
  • Induction hobs can prove to be too pricey for some customers. Thus, cheaper alternatives to induction hobs are preferred by a section of the population. The price of the product is a significant hurdle in the path of the market.
  • Manufacturers of induction hobs are making the appliance even more convenient to use. For example, the replacement of mechanical controls with touch use. Constant improvements in the product are predicted to act as a boon for the market.
  • Increases in fuel prices have had an adverse effect on the sale of traditional kitchen appliances that use fuel. Because of high fuel prices, consumers are turning towards products like induction hobs that do not use fuel.
  • There has been a growing trend of home cooking. As home cooking increases in frequency, the demand for kitchen appliances is predicted to rise. Thus, the induction hob market benefits due to the rise in home cooking.

Comparative View of Adjacent Markets

Apart from the induction hob market, Future Market Insights has gathered reports on two other markets related to hobs. The markets by name are the residential hobs market and the built-in hobs market.

The promising progress of hob products can be seen by looking at the three markets in conjunction. As the number of kitchens and people interested in cooking is growing, hobs are infiltrating the market.

Induction Hob Market:

Attributes Induction Hob Market
Value-based CAGR (2023 to 2033) 9.5%
Projected Market Value (2033) US$ 48.7 million
Market Trends
  • Online sales boosting market
  • Convenience in operating induction hobs growing
Restraints
  • Price of an induction hob prohibitive to many
Growth Factors
  • Efficiency of induction hob admired by consumers
  • Eco-friendly nature of induction hob endearing product to consumers

Residential Hob Market:

Attributes Residential Hob Market
Value-based CAGR (2023 to 2033) 6.5%
Projected Market Value (2033) US$ 37,531.6 million
Market Trends
  • Small kitchen appliances preferred by many consumers
  • Residential hobs adding to the décor of kitchens
Restraints
  • Presence of strong alternatives
Growth Factors
  • Compact appliances like residential hobs are in vogue
  • Rise in home cooking aiding demand for residential hobs

Built-in Hob Market:

Attributes Built-in Hob Market
Value-based CAGR (2023 to 2033) 7.6%
Projected Market Value (2033) US$ 8.7 billion
Market Trends
  • Luxury residences incorporating built-in hobs into the design
  • Rise in demand for safe and hassle-free kitchen equipment
Restraints
  • Emergence of portable hobs
Growth Factors
  • Wide variety of products at consumers’ disposal
  • Increase in disposable incomes making customers more inclined towards built-in hobs

Get the data you need at a Fraction of the cost

Personalize your report by choosing insights you need
and save 40%!

Category-wise Outlook

The induction hob market can be separated into two segments: type and application. By looking at the segments, the type of induction hobs preferred by consumers becomes known. Further, the space where induction hob finds most application also becomes clear.

Built-in Cooktops Continue to Dominate the Market

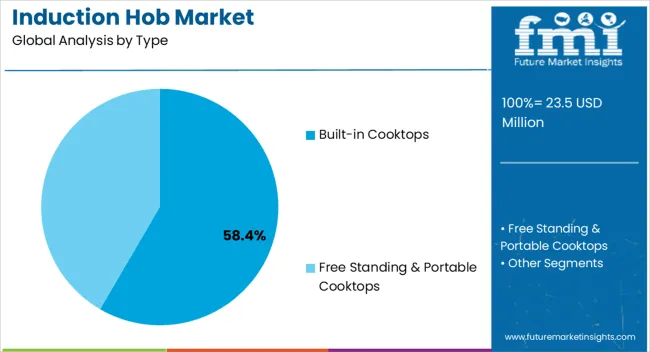
Built-in cooktops continue to reign as the most popular type of induction hob. For 2023, built-in cooktops are expected to account for 61.2% of the market share by type.

Built-in cooktops are the traditional type of hobs. For many consumers, built-in cooktops are the norm and there is little reason to switch. However, portable and freestanding hobs are also becoming popular, as more convenience is sought in the kitchen.

Attributes Details
Top Type Built-in Cooktops
Market Share in 2023 61.2%

Commercial Spaces are Adopting Inductions Hobs at a Rapid Pace

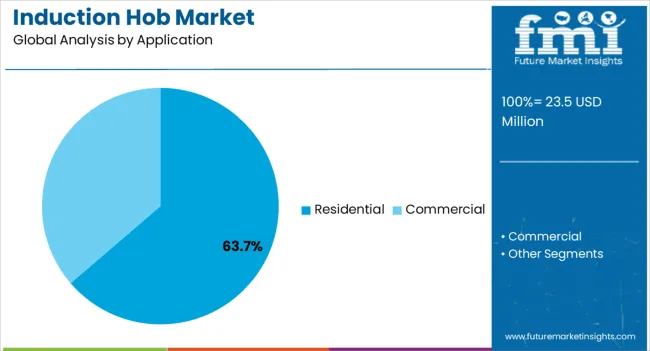
Induction hobs are finding the most application in commercial spaces. In 2023, commercial application is anticipated to hold 32.7% of the market share.

Rise in the number of commercial buildings as well as hotels and eateries is leading to more kitchens being built. As businesses aim to grow efficiently, time and energy-saving solutions are sought in the kitchen too. Thus, induction hobs are finding greater application in commercial spaces.

Attributes Details
Top Application Commercial
Market Share in 2023 32.7%

Country-Wise Analysis

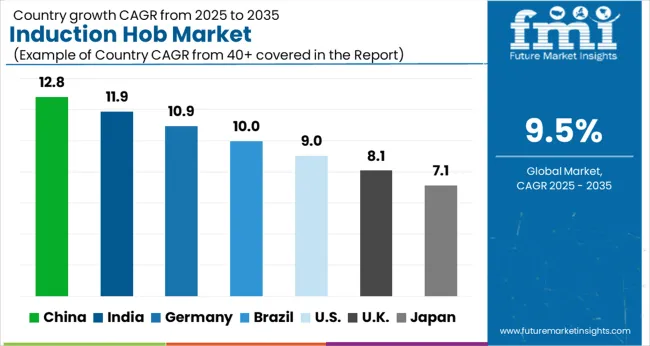
North America contributes heavily to the market, with the United States a lucrative country. However, the growth in Canada is set to outpace the growth in the United States.

In Europe, Italy and Spain are tipped to have fast growth in regards to the induction hob market. The population of India and China ensures the market has high potential in the countries. However, the technologically advanced nations of Japan and Singapore are marked for even faster growth rates than India and China in the Asia Pacific. Australia is another country with promise.

Countries CAGR (2023 to 2033)
Canada 12.2%
Japan 13.8%
Australia 14.0%
Italy 11.2%
Singapore 11.9%

Fluctuating Gas Prices in Canada Lead to Adoption of Non-traditional Kitchen Appliances

Canada is marked as one of the leading countries in terms of growth for the market in North America. For the forecast period of 2023 to 2033, the CAGR for the market in Canada is estimated to be a robust 12.2%.

Canada is one of the northernmost countries in the world and thus often in the throes of bitter cold. As a result, in recent years natural gas prices have escalated rapidly in the country. Consumers in Canada are thus turning away from gas-powered kitchen appliances and preferring products like induction hobs.
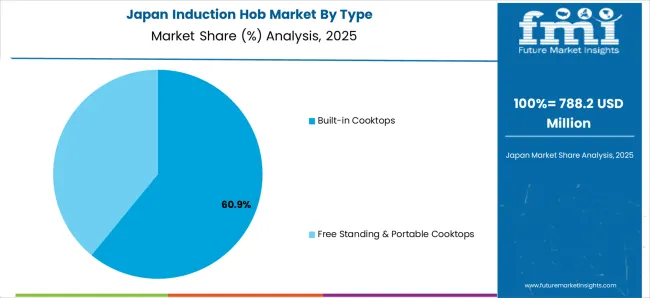
Rapid Economic Development Leading to Fast Growth of the Market in Japan

Japan is one of the leading countries in Asia for the market. For the 2023 to 2033 period, the market is forecasted to grow at a monumental 13.8% CAGR in Japan.

The expanding economy of Japan is leading to a constant increase in urbanization. As a result, not only are the disposable incomes of people growing, but so are service spaces. Thus, there is a rise in the number of people able to afford induction hobs as well as the number of commercial kitchens.

Adoption of Technologically Advanced Kitchen Appliances in Singapore is Aiding the Market

Singapore is another Asian country with high potential for the market. For the forecast period, the CAGR in Singapore is estimated to be an impressive 11.9%.

Singaporean kitchens are becoming advanced at a rapid rate. The introduction of advanced kitchen appliances is aiding the induction hob market too. For example, in September 2023, Samsung Singapore added to its Bespoke range of products by introducing the Bespoke Induction Hob. The hob has both energy-saving and aesthetic value and can also be synced with the Bespoke Wall-mount Hood for turning on and off.

Market Players’ Focus on Making Induction Equipment Affordable Leading to Rapid Progress in Australia

Australia is penciled in to be one of the most lucrative regions for the market in the forecast period. The CAGR during the period from 2023 to 2033 for the market in Australia is predicted at an astonishing 14.0%.

One of the criticisms of induction hobs is the high cost associated. However, companies in Australia are working to rid the product of the price stigma. For example, in March 2023, Australian player Esatto launched the 60cm Induction Cooktop with Power Phase ECI604T, which was made available at an affordable price.

Strong Culinary Tradition Makes Italy a Country with Promise for the Market

Italy has one of the highest growth rates for Europe in the market. For the 2023 to 2033 period, the CAGR for Italy is a remarkable 11.2%.

Italy’s great culinary tradition has led to world-famous dishes like pizza and pasta. Italy has also been influential in the number of companies that supply kitchen equipment. Among the market players in Italy are FABER, Foster, and Baraldi. Thus, the presence of several companies as well as a strong culinary culture is aiding the market in Italy.
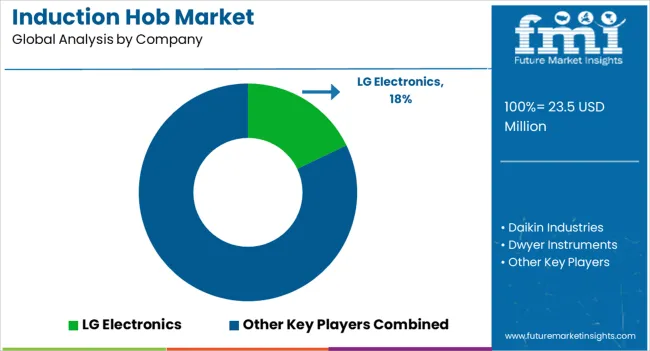
Competitive Landscape in the Induction Hob Market

The induction hob market is fairly fragmented. The presence of industrial giants is felt but smaller companies are not shut off from the market and have opportunities to thrive.

New product launches are key for many market players. To keep the product line flowing, companies, especially the higher-end ones, invest heavily in Research and development.

Recent Developments in the Induction Hob Market

  • In July 2023, Falmec announced the launch of the Zero induction hob. The hob is billed to be energy-efficient and easy to use.
  • In January 2023, the Prestige Iris 2.0 Induction Cooktop was launched. The product boasts features like auto-off and variable time settings.
  • In August 2022, the Kent Jewel induction cooktop was launched. Made by the Indian player Kent, the product boasts of pre-set settings like curry, roti, and rice.

Key Companies in the Induction Hob Market

  • Daikin Industries
  • Dwyer Instruments
  • Ingersoll-Rand
  • Carrier
  • Airwell Group
  • LG Electronics
  • Lennox International
  • SHARP
  • Johnson Controls
  • Siemens AG
  • Voltas
  • Samsung Electronics
  • Electrolux

Key Segments

By Type:

  • Free Standing & Portable Cooktops
  • Built-in Cooktops

By Application:

  • Commercial
  • Residential

By Region:

  • North America
  • Latin America
  • Europe
  • South Asia
  • East Asia
  • Oceania
  • Middle East and Africa (MEA)

Frequently Asked Questions

How Big is the Induction Hob Market?

The size of the induction hob market is estimated to be US$ 19.6 million in 2023.

What is the Preferred Type of Induction Hob?

Built-in cooktops are the most popular type of induction hobs, with an estimated market share of 61.2% in 2023.

What are the Prominent Companies in the Induction Hob Market?

Daikin Industries, Dwyer Instruments, Ingersoll-Rand, and Carrier are some of the prominent companies in the induction hob market.

What will be the Size of the Induction Hob Market in 2033?

The induction hob market size in 2033 is predicted to be US$ US$ 48.7 million.

How will the Induction Hob Market Progress in Australia?

The induction hob market is predicted to progress at an extraordinary CAGR of 14.0% for the period from 2023 to 2033 in Australia.

Table of Content
1. Executive Summary

    1.1. Global Market Outlook

    1.2. Demand-side Trends

    1.3. Supply-side Trends

    1.4. Technology Roadmap Analysis

    1.5. Analysis and Recommendations

2. Market Overview

    2.1. Market Coverage / Taxonomy

    2.2. Market Definition / Scope / Limitations

3. Market Background

    3.1. Market Dynamics

        3.1.1. Drivers

        3.1.2. Restraints

        3.1.3. Opportunity

        3.1.4. Trends

    3.2. Scenario Forecast

        3.2.1. Demand in Optimistic Scenario

        3.2.2. Demand in Likely Scenario

        3.2.3. Demand in Conservative Scenario

    3.3. Opportunity Map Analysis

    3.4. Product Life Cycle Analysis

    3.5. Supply Chain Analysis

        3.5.1. Supply Side Participants and their Roles

            3.5.1.1. Producers

            3.5.1.2. Mid-Level Participants (Traders/ Agents/ Brokers)

            3.5.1.3. Wholesalers and Distributors

        3.5.2. Value Added and Value Created at Node in the Supply Chain

        3.5.3. List of Raw Material Suppliers

        3.5.4. List of Existing and Potential Buyer’s

    3.6. Investment Feasibility Matrix

    3.7. Value Chain Analysis

        3.7.1. Profit Margin Analysis

        3.7.2. Wholesalers and Distributors

        3.7.3. Retailers

    3.8. PESTLE and Porter’s Analysis

    3.9. Regulatory Landscape

        3.9.1. By Key Regions

        3.9.2. By Key Countries

    3.10. Regional Parent Market Outlook

    3.11. Production and Consumption Statistics

    3.12. Import and Export Statistics

4. Global Market Analysis 2018 to 2022 and Forecast, 2023 to 2033

    4.1. Historical Market Size Value (US$ Million) & Volume (Units) Analysis, 2018 to 2022

    4.2. Current and Future Market Size Value (US$ Million) & Volume (Units) Projections, 2023 to 2033

        4.2.1. Y-o-Y Growth Trend Analysis

        4.2.2. Absolute $ Opportunity Analysis

5. Global Market Analysis 2018 to 2022 and Forecast 2023 to 2033, By Type

    5.1. Introduction / Key Findings

    5.2. Historical Market Size Value (US$ Million) & Volume (Units) Analysis By Type, 2018 to 2022

    5.3. Current and Future Market Size Value (US$ Million) & Volume (Units) Analysis and Forecast By Type, 2023 to 2033

        5.3.1. Free Standing & Portable Cooktops

        5.3.2. Built-in Cooktops

    5.4. Y-o-Y Growth Trend Analysis By Type, 2018 to 2022

    5.5. Absolute $ Opportunity Analysis By Type, 2023 to 2033

6. Global Market Analysis 2018 to 2022 and Forecast 2023 to 2033, By Application

    6.1. Introduction / Key Findings

    6.2. Historical Market Size Value (US$ Million) & Volume (Units) Analysis By Application, 2018 to 2022

    6.3. Current and Future Market Size Value (US$ Million) & Volume (Units) Analysis and Forecast By Application, 2023 to 2033

        6.3.1. Commercial Induction Hobs

        6.3.2. Household Induction Hobs

    6.4. Y-o-Y Growth Trend Analysis By Application, 2018 to 2022

    6.5. Absolute $ Opportunity Analysis By Application, 2023 to 2033

7. Global Market Analysis 2018 to 2022 and Forecast 2023 to 2033, By Distribution Channel

    7.1. Introduction / Key Findings

    7.2. Historical Market Size Value (US$ Million) & Volume (Units) Analysis By Distribution Channel, 2018 to 2022

    7.3. Current and Future Market Size Value (US$ Million) & Volume (Units) Analysis and Forecast By Distribution Channel, 2023 to 2033

        7.3.1. Direct Sales

        7.3.2. Indirect Sales

    7.4. Y-o-Y Growth Trend Analysis By Distribution Channel, 2018 to 2022

    7.5. Absolute $ Opportunity Analysis By Distribution Channel, 2023 to 2033

8. Global Market Analysis 2018 to 2022 and Forecast 2023 to 2033, By Region

    8.1. Introduction

    8.2. Historical Market Size Value (US$ Million) & Volume (Units) Analysis By Region, 2018 to 2022

    8.3. Current Market Size Value (US$ Million) & Volume (Units) Analysis and Forecast By Region, 2023 to 2033

        8.3.1. North America

        8.3.2. Latin America

        8.3.3. Western Europe

        8.3.4. Eastern Europe

        8.3.5. South Asia and Pacific

        8.3.6. East Asia

        8.3.7. Middle East and Africa

    8.4. Market Attractiveness Analysis By Region

9. North America Market Analysis 2018 to 2022 and Forecast 2023 to 2033, By Country

    9.1. Historical Market Size Value (US$ Million) & Volume (Units) Trend Analysis By Market Taxonomy, 2018 to 2022

    9.2. Market Size Value (US$ Million) & Volume (Units) Forecast By Market Taxonomy, 2023 to 2033

        9.2.1. By Country

            9.2.1.1. USA

            9.2.1.2. Canada

        9.2.2. By Type

        9.2.3. By Application

        9.2.4. By Distribution Channel

    9.3. Market Attractiveness Analysis

        9.3.1. By Country

        9.3.2. By Type

        9.3.3. By Application

        9.3.4. By Distribution Channel

    9.4. Key Takeaways

10. Latin America Market Analysis 2018 to 2022 and Forecast 2023 to 2033, By Country

    10.1. Historical Market Size Value (US$ Million) & Volume (Units) Trend Analysis By Market Taxonomy, 2018 to 2022

    10.2. Market Size Value (US$ Million) & Volume (Units) Forecast By Market Taxonomy, 2023 to 2033

        10.2.1. By Country

            10.2.1.1. Brazil

            10.2.1.2. Mexico

            10.2.1.3. Rest of Latin America

        10.2.2. By Type

        10.2.3. By Application

        10.2.4. By Distribution Channel

    10.3. Market Attractiveness Analysis

        10.3.1. By Country

        10.3.2. By Type

        10.3.3. By Application

        10.3.4. By Distribution Channel

    10.4. Key Takeaways

11. Western Europe Market Analysis 2018 to 2022 and Forecast 2023 to 2033, By Country

    11.1. Historical Market Size Value (US$ Million) & Volume (Units) Trend Analysis By Market Taxonomy, 2018 to 2022

    11.2. Market Size Value (US$ Million) & Volume (Units) Forecast By Market Taxonomy, 2023 to 2033

        11.2.1. By Country

            11.2.1.1. Germany

            11.2.1.2. UK

            11.2.1.3. France

            11.2.1.4. Spain

            11.2.1.5. Italy

            11.2.1.6. Rest of Western Europe

        11.2.2. By Type

        11.2.3. By Application

        11.2.4. By Distribution Channel

    11.3. Market Attractiveness Analysis

        11.3.1. By Country

        11.3.2. By Type

        11.3.3. By Application

        11.3.4. By Distribution Channel

    11.4. Key Takeaways

12. Eastern Europe Market Analysis 2018 to 2022 and Forecast 2023 to 2033, By Country

    12.1. Historical Market Size Value (US$ Million) & Volume (Units) Trend Analysis By Market Taxonomy, 2018 to 2022

    12.2. Market Size Value (US$ Million) & Volume (Units) Forecast By Market Taxonomy, 2023 to 2033

        12.2.1. By Country

            12.2.1.1. Poland

            12.2.1.2. Russia

            12.2.1.3. Czech Republic

            12.2.1.4. Romania

            12.2.1.5. Rest of Eastern Europe

        12.2.2. By Type

        12.2.3. By Application

        12.2.4. By Distribution Channel

    12.3. Market Attractiveness Analysis

        12.3.1. By Country

        12.3.2. By Type

        12.3.3. By Application

        12.3.4. By Distribution Channel

    12.4. Key Takeaways

13. South Asia and Pacific Market Analysis 2018 to 2022 and Forecast 2023 to 2033, By Country

    13.1. Historical Market Size Value (US$ Million) & Volume (Units) Trend Analysis By Market Taxonomy, 2018 to 2022

    13.2. Market Size Value (US$ Million) & Volume (Units) Forecast By Market Taxonomy, 2023 to 2033

        13.2.1. By Country

            13.2.1.1. India

            13.2.1.2. Bangladesh

            13.2.1.3. Australia

            13.2.1.4. New Zealand

            13.2.1.5. Rest of South Asia and Pacific

        13.2.2. By Type

        13.2.3. By Application

        13.2.4. By Distribution Channel

    13.3. Market Attractiveness Analysis

        13.3.1. By Country

        13.3.2. By Type

        13.3.3. By Application

        13.3.4. By Distribution Channel

    13.4. Key Takeaways

14. East Asia Market Analysis 2018 to 2022 and Forecast 2023 to 2033, By Country

    14.1. Historical Market Size Value (US$ Million) & Volume (Units) Trend Analysis By Market Taxonomy, 2018 to 2022

    14.2. Market Size Value (US$ Million) & Volume (Units) Forecast By Market Taxonomy, 2023 to 2033

        14.2.1. By Country

            14.2.1.1. China

            14.2.1.2. Japan

            14.2.1.3. South Korea

        14.2.2. By Type

        14.2.3. By Application

        14.2.4. By Distribution Channel

    14.3. Market Attractiveness Analysis

        14.3.1. By Country

        14.3.2. By Type

        14.3.3. By Application

        14.3.4. By Distribution Channel

    14.4. Key Takeaways

15. Middle East and Africa Market Analysis 2018 to 2022 and Forecast 2023 to 2033, By Country

    15.1. Historical Market Size Value (US$ Million) & Volume (Units) Trend Analysis By Market Taxonomy, 2018 to 2022

    15.2. Market Size Value (US$ Million) & Volume (Units) Forecast By Market Taxonomy, 2023 to 2033

        15.2.1. By Country

            15.2.1.1. GCC Countries

            15.2.1.2. South Africa

            15.2.1.3. Israel

            15.2.1.4. Rest of MEA

        15.2.2. By Type

        15.2.3. By Application

        15.2.4. By Distribution Channel

    15.3. Market Attractiveness Analysis

        15.3.1. By Country

        15.3.2. By Type

        15.3.3. By Application

        15.3.4. By Distribution Channel

    15.4. Key Takeaways

16. Key Countries Market Analysis

    16.1. USA

        16.1.1. Pricing Analysis

        16.1.2. Market Share Analysis, 2022

            16.1.2.1. By Type

            16.1.2.2. By Application

            16.1.2.3. By Distribution Channel

    16.2. Canada

        16.2.1. Pricing Analysis

        16.2.2. Market Share Analysis, 2022

            16.2.2.1. By Type

            16.2.2.2. By Application

            16.2.2.3. By Distribution Channel

    16.3. Brazil

        16.3.1. Pricing Analysis

        16.3.2. Market Share Analysis, 2022

            16.3.2.1. By Type

            16.3.2.2. By Application

            16.3.2.3. By Distribution Channel

    16.4. Mexico

        16.4.1. Pricing Analysis

        16.4.2. Market Share Analysis, 2022

            16.4.2.1. By Type

            16.4.2.2. By Application

            16.4.2.3. By Distribution Channel

    16.5. Germany

        16.5.1. Pricing Analysis

        16.5.2. Market Share Analysis, 2022

            16.5.2.1. By Type

            16.5.2.2. By Application

            16.5.2.3. By Distribution Channel

    16.6. UK

        16.6.1. Pricing Analysis

        16.6.2. Market Share Analysis, 2022

            16.6.2.1. By Type

            16.6.2.2. By Application

            16.6.2.3. By Distribution Channel

    16.7. France

        16.7.1. Pricing Analysis

        16.7.2. Market Share Analysis, 2022

            16.7.2.1. By Type

            16.7.2.2. By Application

            16.7.2.3. By Distribution Channel

    16.8. Spain

        16.8.1. Pricing Analysis

        16.8.2. Market Share Analysis, 2022

            16.8.2.1. By Type

            16.8.2.2. By Application

            16.8.2.3. By Distribution Channel

    16.9. Italy

        16.9.1. Pricing Analysis

        16.9.2. Market Share Analysis, 2022

            16.9.2.1. By Type

            16.9.2.2. By Application

            16.9.2.3. By Distribution Channel

    16.10. Poland

        16.10.1. Pricing Analysis

        16.10.2. Market Share Analysis, 2022

            16.10.2.1. By Type

            16.10.2.2. By Application

            16.10.2.3. By Distribution Channel

    16.11. Russia

        16.11.1. Pricing Analysis

        16.11.2. Market Share Analysis, 2022

            16.11.2.1. By Type

            16.11.2.2. By Application

            16.11.2.3. By Distribution Channel

    16.12. Czech Republic

        16.12.1. Pricing Analysis

        16.12.2. Market Share Analysis, 2022

            16.12.2.1. By Type

            16.12.2.2. By Application

            16.12.2.3. By Distribution Channel

    16.13. Romania

        16.13.1. Pricing Analysis

        16.13.2. Market Share Analysis, 2022

            16.13.2.1. By Type

            16.13.2.2. By Application

            16.13.2.3. By Distribution Channel

    16.14. India

        16.14.1. Pricing Analysis

        16.14.2. Market Share Analysis, 2022

            16.14.2.1. By Type

            16.14.2.2. By Application

            16.14.2.3. By Distribution Channel

    16.15. Bangladesh

        16.15.1. Pricing Analysis

        16.15.2. Market Share Analysis, 2022

            16.15.2.1. By Type

            16.15.2.2. By Application

            16.15.2.3. By Distribution Channel

    16.16. Australia

        16.16.1. Pricing Analysis

        16.16.2. Market Share Analysis, 2022

            16.16.2.1. By Type

            16.16.2.2. By Application

            16.16.2.3. By Distribution Channel

    16.17. New Zealand

        16.17.1. Pricing Analysis

        16.17.2. Market Share Analysis, 2022

            16.17.2.1. By Type

            16.17.2.2. By Application

            16.17.2.3. By Distribution Channel

    16.18. China

        16.18.1. Pricing Analysis

        16.18.2. Market Share Analysis, 2022

            16.18.2.1. By Type

            16.18.2.2. By Application

            16.18.2.3. By Distribution Channel

    16.19. Japan

        16.19.1. Pricing Analysis

        16.19.2. Market Share Analysis, 2022

            16.19.2.1. By Type

            16.19.2.2. By Application

            16.19.2.3. By Distribution Channel

    16.20. South Korea

        16.20.1. Pricing Analysis

        16.20.2. Market Share Analysis, 2022

            16.20.2.1. By Type

            16.20.2.2. By Application

            16.20.2.3. By Distribution Channel

    16.21. GCC Countries

        16.21.1. Pricing Analysis

        16.21.2. Market Share Analysis, 2022

            16.21.2.1. By Type

            16.21.2.2. By Application

            16.21.2.3. By Distribution Channel

    16.22. South Africa

        16.22.1. Pricing Analysis

        16.22.2. Market Share Analysis, 2022

            16.22.2.1. By Type

            16.22.2.2. By Application

            16.22.2.3. By Distribution Channel

    16.23. Israel

        16.23.1. Pricing Analysis

        16.23.2. Market Share Analysis, 2022

            16.23.2.1. By Type

            16.23.2.2. By Application

            16.23.2.3. By Distribution Channel

17. Market Structure Analysis

    17.1. Competition Dashboard

    17.2. Competition Benchmarking

    17.3. Market Share Analysis of Top Players

        17.3.1. By Regional

        17.3.2. By Type

        17.3.3. By Application

        17.3.4. By Distribution Channel

18. Competition Analysis

    18.1. Competition Deep Dive

        18.1.1. Daikin Industries

            18.1.1.1. Overview

            18.1.1.2. Product Portfolio

            18.1.1.3. Profitability by Market Segments

            18.1.1.4. Sales Footprint

            18.1.1.5. Strategy Overview

                18.1.1.5.1. Marketing Strategy

                18.1.1.5.2. Product Strategy

                18.1.1.5.3. Channel Strategy

        18.1.2. Dwyer Instruments

            18.1.2.1. Overview

            18.1.2.2. Product Portfolio

            18.1.2.3. Profitability by Market Segments

            18.1.2.4. Sales Footprint

            18.1.2.5. Strategy Overview

                18.1.2.5.1. Marketing Strategy

                18.1.2.5.2. Product Strategy

                18.1.2.5.3. Channel Strategy

        18.1.3. Ingersoll-Rand

            18.1.3.1. Overview

            18.1.3.2. Product Portfolio

            18.1.3.3. Profitability by Market Segments

            18.1.3.4. Sales Footprint

            18.1.3.5. Strategy Overview

                18.1.3.5.1. Marketing Strategy

                18.1.3.5.2. Product Strategy

                18.1.3.5.3. Channel Strategy

        18.1.4. Carrier

            18.1.4.1. Overview

            18.1.4.2. Product Portfolio

            18.1.4.3. Profitability by Market Segments

            18.1.4.4. Sales Footprint

            18.1.4.5. Strategy Overview

                18.1.4.5.1. Marketing Strategy

                18.1.4.5.2. Product Strategy

                18.1.4.5.3. Channel Strategy

        18.1.5. Airwell Group

            18.1.5.1. Overview

            18.1.5.2. Product Portfolio

            18.1.5.3. Profitability by Market Segments

            18.1.5.4. Sales Footprint

            18.1.5.5. Strategy Overview

                18.1.5.5.1. Marketing Strategy

                18.1.5.5.2. Product Strategy

                18.1.5.5.3. Channel Strategy

        18.1.6. LG Electronics

            18.1.6.1. Overview

            18.1.6.2. Product Portfolio

            18.1.6.3. Profitability by Market Segments

            18.1.6.4. Sales Footprint

            18.1.6.5. Strategy Overview

                18.1.6.5.1. Marketing Strategy

                18.1.6.5.2. Product Strategy

                18.1.6.5.3. Channel Strategy

        18.1.7. Lennox International

            18.1.7.1. Overview

            18.1.7.2. Product Portfolio

            18.1.7.3. Profitability by Market Segments

            18.1.7.4. Sales Footprint

            18.1.7.5. Strategy Overview

                18.1.7.5.1. Marketing Strategy

                18.1.7.5.2. Product Strategy

                18.1.7.5.3. Channel Strategy

        18.1.8. SHARP

            18.1.8.1. Overview

            18.1.8.2. Product Portfolio

            18.1.8.3. Profitability by Market Segments

            18.1.8.4. Sales Footprint

            18.1.8.5. Strategy Overview

                18.1.8.5.1. Marketing Strategy

                18.1.8.5.2. Product Strategy

                18.1.8.5.3. Channel Strategy

        18.1.9. Johnson Controls

            18.1.9.1. Overview

            18.1.9.2. Product Portfolio

            18.1.9.3. Profitability by Market Segments

            18.1.9.4. Sales Footprint

            18.1.9.5. Strategy Overview

                18.1.9.5.1. Marketing Strategy

                18.1.9.5.2. Product Strategy

                18.1.9.5.3. Channel Strategy

        18.1.10. Siemens AG

            18.1.10.1. Overview

            18.1.10.2. Product Portfolio

            18.1.10.3. Profitability by Market Segments

            18.1.10.4. Sales Footprint

            18.1.10.5. Strategy Overview

                18.1.10.5.1. Marketing Strategy

                18.1.10.5.2. Product Strategy

                18.1.10.5.3. Channel Strategy

        18.1.11. Voltas

            18.1.11.1. Overview

            18.1.11.2. Product Portfolio

            18.1.11.3. Profitability by Market Segments

            18.1.11.4. Sales Footprint

            18.1.11.5. Strategy Overview

                18.1.11.5.1. Marketing Strategy

                18.1.11.5.2. Product Strategy

                18.1.11.5.3. Channel Strategy

        18.1.12. Samsung Electronics

            18.1.12.1. Overview

            18.1.12.2. Product Portfolio

            18.1.12.3. Profitability by Market Segments

            18.1.12.4. Sales Footprint

            18.1.12.5. Strategy Overview

                18.1.12.5.1. Marketing Strategy

                18.1.12.5.2. Product Strategy

                18.1.12.5.3. Channel Strategy

        18.1.13. Electrolux

            18.1.13.1. Overview

            18.1.13.2. Product Portfolio

            18.1.13.3. Profitability by Market Segments

            18.1.13.4. Sales Footprint

            18.1.13.5. Strategy Overview

                18.1.13.5.1. Marketing Strategy

                18.1.13.5.2. Product Strategy

                18.1.13.5.3. Channel Strategy

19. Assumptions & Acronyms Used

20. Research Methodology
Recommendations

Consumer Product

Residential Hobs Market

February 2019

REP-GB-9008

October 2023

315 pages

Consumer Product

Built-In Hobs Market

May 2022

REP-GB-14859

March 2023

250 pages

Explore Consumer Product Insights

View Reports