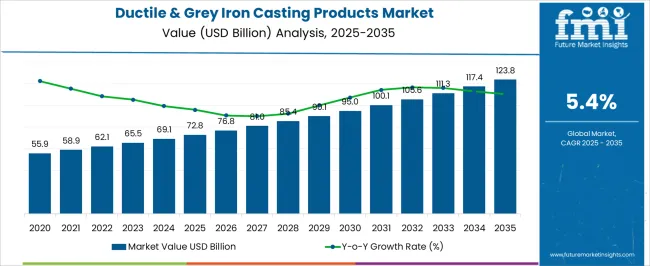
The Ductile and Grey Iron Casting Products Market is estimated to be valued at USD 72.8 billion in 2025 and is projected to reach USD 123.8 billion by 2035, registering a compound annual growth rate (CAGR) of 5.4% over the forecast period.
| Metric | Value |
|---|---|
| Ductile and Grey Iron Casting Products Market Estimated Value in (2025 E) | USD 72.8 billion |
| Ductile and Grey Iron Casting Products Market Forecast Value in (2035 F) | USD 123.8 billion |
| Forecast CAGR (2025 to 2035) | 5.4% |
The ductile and grey iron casting products market is experiencing steady growth due to the rising demand for durable and cost effective components across automotive, machinery, and construction industries. Increased emphasis on lightweight materials with high strength to weight ratios is driving adoption of ductile castings, while grey iron continues to hold importance in applications requiring vibration damping and machinability.
Technological advancements in casting processes, improved alloy compositions, and automation in foundries are enhancing production efficiency and product quality. Stringent environmental and safety standards are encouraging investments in energy efficient and low emission casting technologies.
Additionally, the growing expansion of infrastructure and automotive manufacturing in emerging economies is creating a strong pipeline of opportunities. The market outlook remains positive, supported by continuous innovation in material performance and the alignment of industry practices with sustainability and efficiency goals.
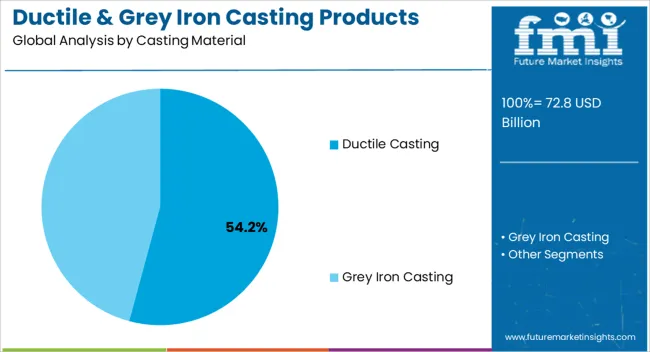
The ductile casting segment is projected to account for 54.20% of total revenue by 2025 within the casting material category, positioning it as the leading segment. The dominance of this material is attributed to its superior tensile strength, impact resistance, and flexibility, which make it highly suitable for critical components in demanding environments.
Its ability to withstand cyclic loading and its longer fatigue life compared to grey iron have reinforced its use in modern machinery and vehicle components.
Continuous developments in metallurgical techniques and improved process controls have further enhanced performance, making ductile casting the preferred choice for manufacturers seeking durability and reliability.
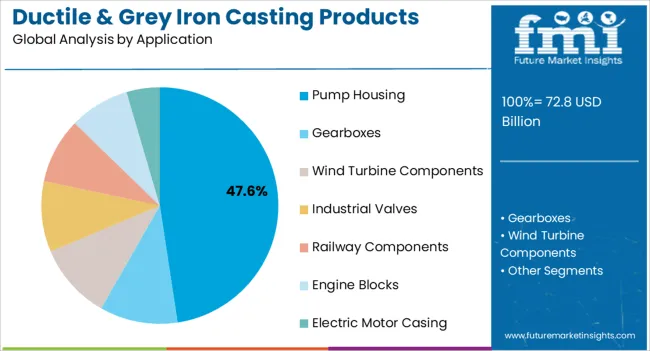
The pump housing segment is expected to represent 47.60% of overall market revenue by 2025 under the application category, emerging as the most prominent area of use. The leadership of this segment is supported by the increasing demand for efficient fluid handling systems in industries such as water treatment, oil and gas, and chemical processing.
Ductile and grey iron provide excellent corrosion resistance and mechanical stability, making them well suited for pump housings that operate in high pressure and abrasive conditions.
Additionally, the cost efficiency of casting methods combined with the adaptability of designs has strengthened adoption in large scale industrial applications, positioning pump housing as a major contributor to market expansion.
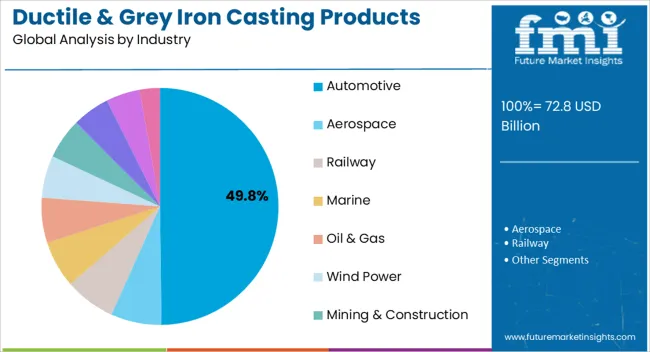
The automotive industry is projected to hold 49.80% of total market revenue by 2025 within the industry category, marking it as the dominant segment. This leadership is driven by the sector’s reliance on iron casting for engine blocks, suspension components, brake systems, and transmission parts.
The strength, machinability, and heat resistance of ductile and grey iron make them indispensable in delivering both performance and cost efficiency in vehicle manufacturing. Growing vehicle production in emerging economies, coupled with the rising demand for lightweight and durable materials in advanced automotive engineering, has further reinforced the role of iron castings.
As automakers continue to balance performance, safety, and cost competitiveness, the automotive industry remains the largest and most influential end use segment in the ductile and grey iron casting products market.
From 2020 to 2025, the ductile and grey iron casting products market was reported to expand at a CAGR of 4.8%. According to Future Market Insights (FMI), the market is expected to surge at a CAGR of 5.7% during the forecast period.
Expansion of companies and infrastructure projects, particularly during periods of rapid industrialization and urbanization, created a significant demand for ductile and gray iron castings.
These castings were crucial for various applications in sectors such as construction, transportation, mining, and machinery. Growth of these sectors drove the increased demand for iron castings in the past 5 years.
Ductile and gray iron castings have long been recognized for their cost-effectiveness and manufacturing efficiency. Casting processes allow for the mass production of complex shapes and intricate designs, reducing the need for additional machining or assembly operations.
This made ductile and gray iron castings a preferred choice for those companies seeking cost-effective and efficient manufacturing solutions, further augmenting their demand.
Iron castings, particularly ductile iron, offer good corrosion resistance properties. This made them suitable for applications in sectors exposed to harsh environments or corrosive substances such as marine, chemical, and oil & gas. Demand for ductile and gray iron castings grew as these sectors sought corrosion-resistant materials for their components.
Ductile and gray iron have been used for casting applications for several years, and there exists a well-established knowledge base and expertise in working with these materials. This historical preference and familiarity led to a continued demand for ductile and gray iron castings, even as new materials and manufacturing methods emerged.
There is a rising need for lightweight materials across several sectors as environmental standards and fuel efficiency become more and more of a priority.
Due to its superior strength-to-weight ratio over conventional cast iron, ductile iron is recommended as a lightweight substitute. This pattern is particularly noticeable in the automotive sector, where use of lightweight materials can increase fuel efficiency and lower emissions.
The market for casting goods made of ductile and grey iron has benefited from improvements in casting technology and processes.
Efficiency, accuracy, and productivity of casting manufacturing have all been enhanced by automation, robotics, computer-aided design, and simulation. These innovations have decreased manufacturing times, improved quality control, and cut costs for manufacturers.
The market for ductile and grey iron casting products is being impacted by the manufacturing sector’s adoption of industry 4.0 and internet of things (IoT) technologies.
Casting operations are being monitored and optimized using smart sensors and linked devices, providing real-time data analysis, predictive maintenance, and increased quality control. The casting sector benefits from this digital transition in terms of increased productivity, decreased downtime, and improved decision-making.
Growing Use by China-based Car Manufacturers to Propel Sales of Cast Iron Products
In the forecast period, China ductile and grey iron casting products industry is expected to elevate at a CAGR of 5.1%. The country holds around 85% of share in East Asia.
China is one of the largest producers and consumers of ductile and grey iron casting products in the world. The country has a well-established and mature casting sector, with a significant presence in both domestic and international markets.
The market for ductile and grey iron casting products in China is driven by several factors. Firstly, rapid growth of the automotive sector has resulted in increased demand for cast iron components such as engine blocks, cylinder heads, and brake components.
The construction sector is another leading consumer of cast iron products, utilizing them in applications such as pipe fittings, manhole covers, and structural components.
China's strong manufacturing capabilities, cost advantages, and skilled labor force have contributed to its dominance in the global market.
The country has numerous foundries equipped with advanced casting technologies and processes. It further allows for the production of high-quality cast iron products at competitive prices.
In recent years, there has been a focus on improving quality and efficiency of the casting process in China. Adoption of advanced technologies such as computer-aided design (CAD), computer-aided manufacturing (CAM), and simulation software has helped enhance the precision and reliability of cast iron production.
Demand for Sustainable Products in Germany to Drive Sales of Cast Iron Pipes
Germany ductile and grey iron casting products market is anticipated to expand at a sizable CAGR of 7% over the forecast period. Sales in the country are projected to increase steadily by the end of 2035.
Germany has a long-standing reputation for its precision engineering and high-quality manufacturing processes. The country is known for its advanced machinery and equipment, skilled workforce, and adherence to strict quality standards. These factors might contribute to Germany's competitiveness in the global market for ductile and grey iron casting products.
One of the key drivers for the market is strong demand from various sectors such as automotive, machinery & equipment, construction, and energy. The automotive sector, in particular, plays a significant role in accelerating the demand for cast iron components, including engine blocks, cylinder heads, and brake components.
Germany is home to renowned automotive manufacturers and suppliers, and the local demand for cast iron products remains robust.
Germany's commitment to sustainability and environmental protection also aligns with increasing global focus on eco-friendly manufacturing practices.
Ductile and grey iron casting manufacturers in Germany are investing in energy-efficient production processes, waste reduction, and recycling initiatives. These factors might help position them favorably in the market, as customers increasingly prioritize sustainable products and suppliers.
United States-based Firms to Focus on Strengthening Their Ductile Iron Casting Metal Portfolios
The United States has been investing in infrastructure development, including roads, bridges, and public utilities. Ductile and grey iron casting products such as pipe fittings, manhole covers, and structural components, are essential for these projects. Ongoing infrastructure initiatives such as the proposed infrastructure bill, are expected to drive demand for cast iron products further.
A key consumer of ductile and grey iron casting goods is the automotive sector. Cast iron parts, including engine blocks, cylinder heads, and brake components, are frequently employed in automobiles with the strength of the country’s automotive sector. The market is expanding as a result of rising vehicle demand and desire for components that are both lightweight & strong.
For United States-based companies, a reliable and effective supply chain is ensured by domestic manufacture of ductile and grey iron casting products.
Reduced lead times, transportation expenses, and potential supply chain interruptions are all benefits of localizing manufacturing, which are crucial factors for consumers. As a result, by the end of 2035, the United States market is set to surpass revenues of USD 7.4 billion.
Ductile Iron Grades to Showcase High Demand amid Rising Use in Machinery Worldwide
By casting material, the ductile casting segment is expected to account for more than 70% of the global ductile and grey iron casting products market share in the forecast period.
The segment is expected to create an absolute dollar opportunity of USD 72.8 billion during the assessment period from 2025 to 2035. This is followed by grey iron casting, which is expected to surge at a CAGR of 4.7% in the same duration.
Ductile castings exhibit excellent mechanical properties, including high tensile strength, impact resistance, and ductility. These properties might make them suitable for applications that require components to withstand heavy loads, shocks, and vibrations over extended periods.
Sectors such as automotive, aerospace, construction, and machinery would rely on ductile castings for their excellent strength and durability.
Ductile castings would also offer a cost-effective alternative to other manufacturing processes such as forging or fabrication. Casting allows for complex shapes and intricate designs to be produced in a single piece, reducing the need for joining or assembly of multiple parts.
This might help in simplifying the production process, lowering labor costs, and minimizing material waste.
Renowned Automakers to Demand Ductile Cast Iron for its Unique Impact Resistance Characteristic
By industry, the automotive segment is expected to hold more than 20% of the global ductile and grey iron casting products market share in the forecast period. It is expected to create an absolute $ opportunity of USD 1.2 billion during the forecast period from 2025 to 2035. This is followed by the others segment, which is expected to surge at a CAGR of 4%.
Ductile and gray iron castings offer high strength and durability, making them well-suited for automotive applications. These castings can withstand heavy loads, provide structural integrity, and resist wear & tear over extended periods.
The automotive sector seeks robust and reliable components as vehicles continue to evolve with advanced technologies & performance requirements. It is set to push demand for ductile and gray iron castings.
Cast iron, including ductile and gray iron, is a cost-effective material for producing automotive components. Casting processes allow for the mass production of complex shapes and intricate designs in a single piece, reducing the need for additional machining or assembly operations.
This lowers production costs and increases efficiency, making ductile and gray iron castings economically attractive to automotive manufacturers.
Ductile and gray iron castings also offer excellent impact resistance and high energy absorption capabilities. These properties make them desirable for safety-critical components such as engine mounts, brackets, and crash-related structures.
The automotive sector places great emphasis on occupant safety. Demand for ductile and gray iron castings is expected to be driven by their ability to withstand and dissipate impact forces in the event of collisions.
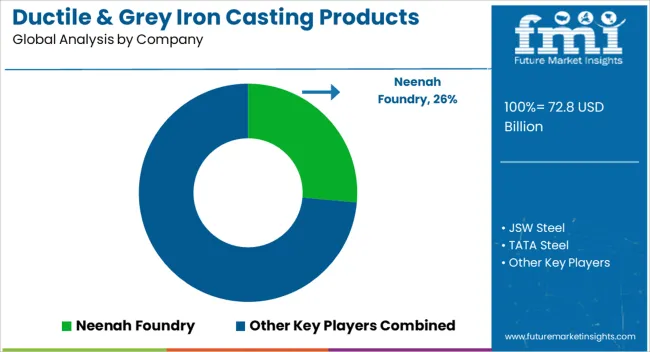
In recent years, manufacturers are highly focused on acquisitions to strengthen their ductile and grey iron casting products product portfolios. Companies are investing significantly in order to expand their production in the regional market and grab growth opportunities.
Manufacturers are also expanding their reach to enhance their sales and service for their customers through strong distribution networks. Key players in the market are focusing on adopting alternative distribution channels such as online platforms to strengthen their presence in regional and global markets.
Several key players are focusing on acquisition of small players. However, small-scale companies need to make significant investments in research & development activities to introduce new products and enhance their presence across the globe.
For instance,
| Attribute | Details |
|---|---|
| Estimated Market Size (2025) | USD 72.8 billion |
| Projected Market Valuation (2035) | USD 123.8 billion |
| Value-based CAGR (2025 to 2035) | 5.4% |
| Forecast Period | 2025 to 2035 |
| Historical Data Available for | 2020 to 2025 |
| Market Analysis | Value (USD billion) and Volume (kilotons) |
| Key Regions Covered | North America; Latin America; Western Europe; Eastern Europe; Central Asia; Russia and Belarus; Balkan and Baltic Countries; East Asia; South Asia and Pacific; and Middle East & Africa. |
| Key Countries Covered | United States of America, Canada, Mexico, Brazil, Argentina, Germany, Italy, France, United Kingdom, Spain, BENELUX, NORDICS, Poland, Hungary, Romania, Czech Republic, China, Japan, South Korea, India, Association of Southeast Asian Nations, Australia, New Zealand, Kingdom of Saudi Arabia, United Arab Emirates, Türkiye, and Israel. |
| Key Segments Covered | By Product Type, By Modality, By End Uses, and By Region |
| Key Companies Profiled | Neenah Foundry; JSW Steel; TATA Steel; S.A.I.L; Dotson Iron Castings; Ashland Foundry and Machine Works; Dandong Foundry; Willman Industries; Plymouth Foundry; Impro Precision; Grede Foundry |
| Report Coverage | Market Forecast, Company Share Analysis, Competition Intelligence, Market Dynamics and Challenges, and Strategic Growth Initiatives |
The global ductile and grey iron casting products market is estimated to be valued at USD 72.8 billion in 2025.
The market size for the ductile and grey iron casting products market is projected to reach USD 123.8 billion by 2035.
The ductile and grey iron casting products market is expected to grow at a 5.4% CAGR between 2025 and 2035.
The key product types in ductile and grey iron casting products market are ductile casting and grey iron casting.
In terms of application, pump housing segment to command 47.6% share in the ductile and grey iron casting products market in 2025.


Full Research Suite comprises of:
Market outlook & trends analysis
Interviews & case studies
Strategic recommendations
Vendor profiles & capabilities analysis
5-year forecasts
8 regions and 60+ country-level data splits
Market segment data splits
12 months of continuous data updates
DELIVERED AS:
PDF EXCEL ONLINE
Anderson Cascade Impactor Market Size and Share Forecast Outlook 2025 to 2035
Andersen-Tawil Syndrome Treatment Market Trends - Growth & Future Prospects 2025 to 2035
Andro Supplements Market
Handheld Tagging Gun Market Forecast and Outlook 2025 to 2035
Handheld Imaging Systems Market Size and Share Forecast Outlook 2025 to 2035
Sandwich Panel System Market Size and Share Forecast Outlook 2025 to 2035
Hand Tools Market Size and Share Forecast Outlook 2025 to 2035
Land Survey Equipment Market Size and Share Forecast Outlook 2025 to 2035
Handloom Product Market Size and Share Forecast Outlook 2025 to 2035
Band File Sander Belts Market Size and Share Forecast Outlook 2025 to 2035
Handheld XRF Analyzers Market Size and Share Forecast Outlook 2025 to 2035
Sand Abrasion Tester Market Size and Share Forecast Outlook 2025 to 2035
Sand Testing Equipments Market Size and Share Forecast Outlook 2025 to 2035
Landscape Lighting Market Size and Share Forecast Outlook 2025 to 2035
Handheld Police Radar Guns Market Size and Share Forecast Outlook 2025 to 2035
Handheld DNA Reader Market Size and Share Forecast Outlook 2025 to 2035
Handheld Robotic Navigation Market Analysis - Size, Share, and Forecast Outlook 2025 to 2035
Handheld Mesh Nebulizer Market Size and Share Forecast Outlook 2025 to 2035
Dandruff Control Shampoos Market Size and Share Forecast Outlook 2025 to 2035
Candidiasis Therapeutics Market Size and Share Forecast Outlook 2025 to 2035

Thank you!
You will receive an email from our Business Development Manager. Please be sure to check your SPAM/JUNK folder too.
Chat With
MaRIA