Inductor Market
Find Out How Growing Trends of Digitalization and Electrification Are Influencing Sales of Inductors Across the U.S., Belgium, France, Italy, Japan, Korea, the U.K., and 30+ Countries!
Inductor Market segmented by Inductance, Types, Core Type, Mounting Techniques, Applications, & Region – Forecast for 2022-32
Inductor Market Outlook (2022-2032)
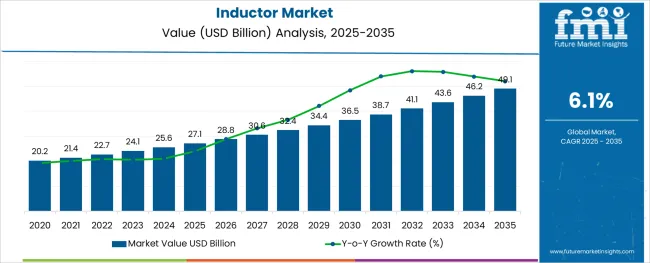
[145 Pages Report] Registering a year-on-year growth of 5.6% in 2022, the global inductor market is expected to surpass US$ 11,862.1 Mn by 2022. With rising adoption across automotive, industrial, and consumer electronics, the overall demand for inductors is anticipated to grow at a 6.1% CAGR between 2022 and 2032, totalling a market valuation of US$ 21,417.5 Mn by 2032.
An inductor is a passive two-terminal electrical component that stores energy in a magnetic field when electric current flows through it. Inductors are widely used as energy storage devices in many switched-mode power suppliers to produce DC (direct current).
Most of the inductors are used as filters to reduce the amount of ripple in electronic circuits. They are also used in electrical transmission systems, where they limit switching currents and fault currents.
Rising production and usage of electronic products across the globe due to rapid digitalization is expected to boost the growth of inductor market during the forecast period.
Modern technologies are increasingly in demand, and many systems are being electrified in various regions. The demand for various components used in creating electronic gadgets tends to rise as electrification technologies advance.
One of the main factors driving the demand for inductors used for power conversion is the growing popularity of power electronics. Additionally, a significant increase in the use of electronically operated equipment such as automated machinery with computer numerical control across various industries is expected to boost the global inductor market.
Similarly, the inductor market is expected to grow tremendously during the next ten years as a result of rising automation in several end-use industries, including the automotive, consumer electronics, and power industries.
Currently, the overall inductor market holds approximately 15% share of the global passive components market and this number is likely to further surge due to growing penetration of digitalization and increasing popularity of electrical vehicles.
Regionally, East Asia, spearheaded by China, is emerging as the most lucrative inductor market owing to the rapid growth of consumer electronics and automotive industries, favorable government support, and easy availability of raw materials.
In recent years, China's economy expanded steadily, fuelled mostly by an export boom. In the East Asia region, China is a prominent country in the export of electronic components. China's worldwide production share of electronic circuit components is around 32.9%, well ahead of other electronics manufacturing hubs.
Attribute |
Key Insights |
Global Inductor Market Base Value (2021A) |
US$ 11,229.9 Mn |
Estimated Market Value (2022E) |
US$ 11,862.1 Mn |
Projected Market Value (2032F) |
US$ 21,417.5 Mn |
Value-based CAGR (2022-2032) |
6.1% |
Collective Value Share: Top 3 Countries (2022E) |
36.1% |
Let us know your requirement to get
100% FREE customization
Global Inductor Market Sales Analysis Of 2017-2021 Compared To Demand Forecast For 2022-2032
The global inductor market increased at a CAGR of about 2.9% between 2017 and 2021. However, with rapid growth of consumer electronics and automotive industries, FMI predicts the overall inductor market to develop at 6.1% CAGR through 2032.
The trend toward electrification has grown across industries such as automotive at a rapid pace during the last few years and it is likely to further escalate during the projection period due to rising fuel prices. This is providing a major impetus to the growth of inductor market.
Inductors, which are used in electric vehicles, provide low resistance, enhanced saturation properties, and stability over a range of temperatures. They boost a vehicle's performance and economy by decreasing energy losses and preventing unwanted self-heating.
Thus, demand for electronics components, including inductors, is anticipated to grow as a result of increased advancements in the mobility sector and a shift in consumer preference toward electric vehicles.
Similarly, growing adoption of inductors in consumer electronics, medical devices, and military & defence equipment is expected to boost sales in the global inductor market during the forecast period.
Comparative Analysis Of Adjacent Inductor Market
Inductor Market:
Differentiating Aspects |
Inductor Market |
CAGR in 2022-2032 |
6.1% |
Current Valuation in 2022 |
US$ 11,862.1 Mn |
Projected Valuation in 2032 |
US$ 21,417.5 Mn |
Demand Drivers |
|
Induction Furnace Market:
Differentiating Aspects |
Induction Furnace Market |
CAGR in 2022-2032 |
5%-6% |
Current Valuation in 2022 |
US$ 900 Mn |
Projected Valuation in 2032 |
US$ 1,500 Mn |
Demand Drivers |
|
Military Vehicles and Aircraft Simulations Market:
Differentiating Aspects |
Military Vehicles and Aircraft Simulations Market |
CAGR in 2022-2032 |
7.1% |
Current Valuation in 2022 |
US$ 5.9 Bn |
Projected Valuation in 2032 |
US$ 8.4 Bn |
Demand Drivers |
|
Find your sweet spots for generating winning opportunities in this market.
Talk to AnalystWhat Are The Key Trends Driving The Global Inductor Market?
“Rapid Digitalization and Miniaturization of Electronics to Boost Market Through 2032”
Increasing demand for small-sized electronic devices such as mobile phones and tablets is boosting the sales of electronic components such as inductors. Factors such as reduced device size, reduced weight, and enhanced device performance are boosting the demand for thin film inductors across several applications.
Due to their tiny sizes, the inductors are more heat resistant and electrically stable, which helps in reducing electrical noise. Increasing disposable income and changing consumer preference towards lightweight and small-sized communication devices are leading to manufacturers focusing on developing semiconductor devices with miniature, efficient components.
The demand for small electronic components is on the rise as a result of rapid digitalization and rising penetration of automation. Thus, growth of the inductor market will be driven by rapid expansion of electronics industry, the shrinking of contemporary electronic gadgets, rising popularity of electric vehicles, and growing usage of advanced technology in automobiles.
Country-Wise Insights
What Makes the U.S. a Prominent Inductor Market?
“Booming Consumer Electronics Sector Driving the U.S. Inductor Market”
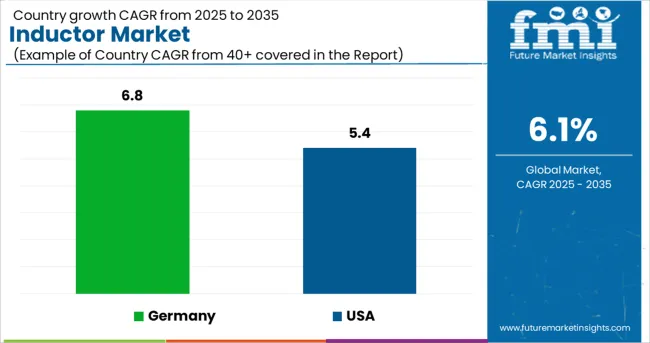
The U.S. holds around 79.7% market share of the North America inductor market and it is predicted to expand at 5.4% CAGR during the forecast period. Robust expansion of automotive and consumer electronics industries, increasing adoption of advanced technologies, and strong presence of leading manufacturers are some of the key factors driving the U.S. inductor market.
In the U.S., consumer electronics is a very dynamic industry with rapidly changing technological developments and innovations in consumer products. The use of inductors is increasing more and more to provide low DCR characteristics and large currents. Hence, rising demand for wearable electronic devices and a growing preference for automation technology in various industries are expected to boost the demand for the inductor market during the forecast period.
Similarly, the U.S. market is expected to increase steadily over the forecast period, thanks to the development of new and innovative products that involve the majority of the country's leading companies. According to FMI, the U.S. inductor market would reach US$ 3,929.9 Mn in sales by the end of 2032.
How Will Growth Unfold in the Germany Inductor Market?
“Growing Popularity of Electric Vehicles to Boost Inductor Market in Germany”
Germany’s inductor market is anticipated to expand at a robust CAGR of 6.8% over the forecast period. Sales in the country are projected to increase by 2x times by the end of 2032, generating revenues worth US$ 932.1 million.
Rising adoption of inductors across thriving automotive and industrial sectors is a key factor boosting the growth of the German inductor market.
German manufacturers are creating inductors to boost the electronics equipment industry. As it transitions to a new energy mix, Germany's electric transmission infrastructure faces huge hurdles. The existence of significant electric vehicle automotive businesses in the area is anticipated to drive faster market expansion during the projected period.
Why is the Demand for Inductors Rising Rapidly Across China?
“Rising Export of Electronic Products Igniting Sales in China”
With booming automotive and electrical & electronics industries China is emerging as one of the fastest growing inductor markets across the globe. FMI predicts the China inductors market to surpass revenues of US$ 795.5 Mn by 2032.
Urbanization, fast economic expansion, and population growth are boosting demand for infrastructure development in China. China has become the world's largest maker of many electronic appliances, such as colour TVs, DVDs, and cell phones. China also now has a leading-edge semiconductor industry.
International investors are showing interest in China’s electronic infrastructure sector. China still has the most households without power due to its enormous population. The Chinese government is focusing on improving state electricity boards, which has resulted in a significant increase in infrastructure for rural electrification. This will continue to propel sales of inductors during the forecast period.
Similarly, rise in the export of electronic products is playing a crucial role in expanding the inductor market. According to the World Population Review, China exported an estimated $2.72 trillion worth of goods and services, primarily electronic equipment and machinery such as computers, broadcast equipment, computers, integrated circuits, office machine parts, telephones, etc.

A unified Market Research Subscription Platform, built for today's disparate research needs.
Category-Wise Insights
Which Core Type will Generate Maximum Profits in Inductor Market?
“Demand to Remain High for Air Core Type Inductors in the Market”
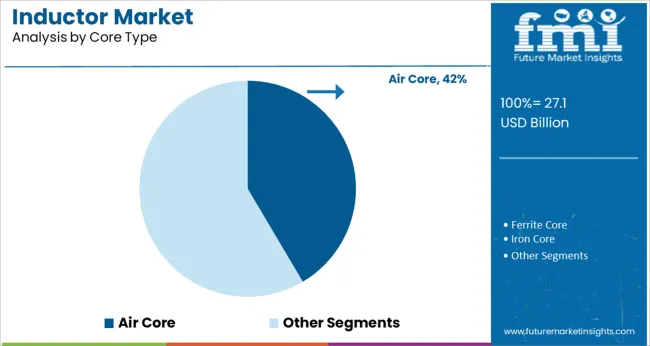
As per FMI, the air core type inductor segment will generate an absolute incremental opportunity of US$ 5,143.5 Mn between 2022 and 2032, making it the fastest growing core type segment. This can be attributed to the rising usage of air core type inductors across various end-use industries.
Air core inductors provide effective solutions for switch mode magnetic requirements, especially when focusing on high linearity, high frequency, and reduced core loss. In addition, these inductors are an ideal solution when space is not prohibitive.
Air core inductors offer numerous advantages, such as being saturation free. Inductors with ferromagnetic cores tend to become saturated as current increases. Air core models, however, have no core to saturate, and therefore are independent of electrical currents.
Without ferromagnetic cores, these inductors eliminate iron losses as frequency increases, the cores offer better Q factor and lower distortion. Air core can achieve peak performance of up to 1GHz. They are essential for a variety of high-tech applications such as electronic products, computer devices, communication equipment, TVs, DVDs, mobile chargers, etc.
Which Mounting Technique will Remain Highly Sought-After in the Inductor Market?
“Surface Mount Technology Remains the Most Preferred Mounting Technique”
According to Future Market Insights, more than 60% of the global inductor market is held by surface mount technology. Surface mount technique enables smaller PCB design by allowing more components to be placed closer together on the board.
The surface mount technique leads to designs that are more lightweight and compact. The process for production setup is faster when it comes to surface mount technique as compared to through hole technology. This is because drilled holes are not required for assembly which also enables lower cost.
Growing adoption of surface mount technology mostly in printed circuit boards and consumer electronics applications will further boost the growth of this segment during the forecast period.
Amid growing preference for surface mount technology over its counterpart, the segment is expected to generate an absolute dollar potential of more than US$ 5,317.2 Mn between 2022 and 2032.
Competitive Landscape
In recent years, there has been an increase in acquisition and growth operations to strengthen the inductor supply chain. Several major Inductor manufacturers are also studying, developing, and launching new products.
For instance,
- In April 2022, Murata announced the availability of the DFE32CAH_R0 series of metal power inductors for high-temperature applications of up to 150 °C. These new products support large currents by optimizing the internal coil structure design and utilizing original metal materials.
- In March 2022, TDK Corporation introduced a new series of shielded SMT power inductors, optimized for high saturation currents and low DC resistance.
Several producers have risen to prominence in this sector. International market leaders are concentrating on establishing partnerships and joint ventures with foreign local companies to guarantee proper local marketing of the products, acquire a competitive edge over rivals, and enjoy additional benefits including popularity in brand value over time.
This element will also present the potential for boosting production capacity, lowering production costs, and preserving market positions for both domestic and foreign firms.
Scope Of Report
Attribute |
Details |
Estimated Market Size (2022) |
US$ 11,862.1 Mn |
Projected Market Size (2032) |
US$ 21,417.5 Mn |
Anticipated Growth Rate (2022-2032) |
6.1% CAGR |
Forecast Period |
2022-2032 |
Historical Data Available for |
2017-2021 |
Market Analysis |
US$ Million for Value and Mn Units for Volume |
Key Regions Covered |
North America, Latin America, Europe, East Asia, South Asia Pacific, and The Middle East and Africa |
Key Countries Covered |
US, Canada, Mexico, Brazil, Germany, Italy, France, U.K., Spain, BENELUX, Russia, China, Japan, South Korea, India, ASEAN, Australia, and New Zealand, Turkey, South Africa, GCC Countries, Northern Africa. |
Key Segments Covered |
By Inductance, By Type, By Core Type, By Mounting Technique, By Application, and By Region |
Key Companies Profiled |
|
Report Coverage |
Market Forecast, Company Share Analysis, Competition Intelligence, DROT Analysis, Market Dynamics and Challenges, and Strategic Growth Initiatives |
Global Inductor Market By Category
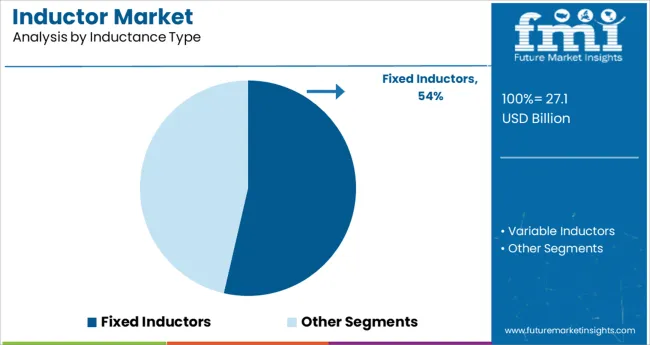
By Inductance Type:
- Fixed Inductors
- Variable Inductors
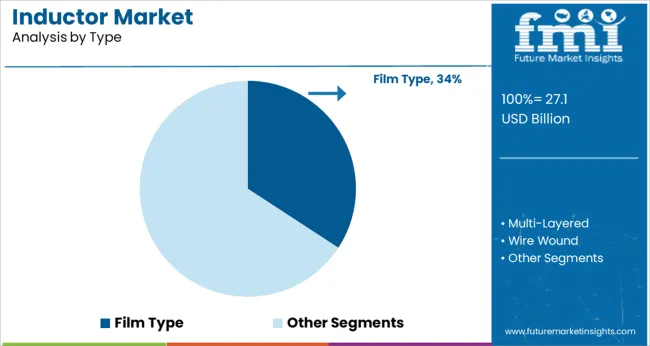
By Type:
- Film Type
- Multi-Layered
- Wire Wound
- Molded
By Core Type:
- Air Core
- Ferrite Core
- Iron Core
By Mounting Technique:
- Surface Mount
- Through Hole
By Application:
- Automotive
- Industrial
- RF, Telecommunications & High Frequency Applications
- Military and Defense
- Consumer Electronics
- Power Generation, Transmission and Distributions
- Healthcare
By Region:
- North America
- Latin America
- Europe
- East Asia
- South Asia Pacific
- Middle East and Africa
Frequently Asked Questions
The global inductor market is expected to total US$ 11,862.1 Mn in 2022.
Demand for inductors is anticipated to increase at 6.1% CAGR during the forecast period from 2022 to 2032.
The worldwide inductor market is likely to reach a valuation of US$ 21,417.5 Mn by 2032.
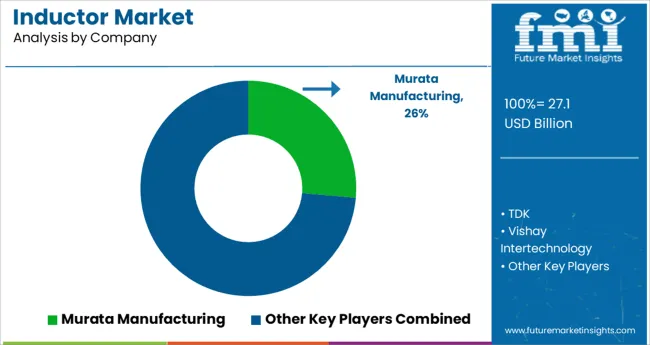
Murata Manufacturing, TDK Corporation, Vishay Intertechnology, TAIYO YUDEN, Samsung Electro Mechanics, KYOCERA AVX Components Corporation, and others are the leading market players, collectively accounting for 20% to 25% of the global market share.
Demand for inductors in Germany is expected to increase at 6.8 % CAGR between 2022 to 2032 on a value basis.
Consumer electronics segment leads the inductor market with over 36.5% of the total market share.
Table of Content
1. Executive Summary
1.1. Global Market Outlook
1.2. Demand Side Trends
1.3. Supply Side Trends
1.4. Technology Roadmap
1.5. Analysis and Recommendations
2. Market Overview
2.1. Market Coverage / Taxonomy
2.2. Market Definition / Scope / Limitations
3. Key Market Trends
3.1. Key Trends Impacting the Market
3.2. Product Innovation / Development Trends
4. Key Success Factors
4.1. Product Adoption / Usage Analysis
4.2. Product USPs / Features
4.3. Strategic Promotional Strategies
5. Global Inductor Market Demand Analysis 2017-2021 and Forecast, 2022-2032
5.1. Historical Market Volume (Mn Units) Analysis, 2017-2021
5.2. Current and Future Market Volume (Mn Units) Projections, 2022-2032
5.3. Y-o-Y Growth Trend Analysis
6. Global Inductor Market - Pricing Analysis
6.1. Regional Pricing Analysis by Inductance
6.2. Global Average Pricing Analysis Benchmark
7. Global Inductor Market Demand (in Value or Size in US$ Mn) Analysis 2017-2021 and Forecast, 2022-2032
7.1. Historical Market Value (US$ Mn) Analysis, 2017-2021
7.2. Current and Future Market Value (US$ Mn) Projections, 2022-2032
7.2.1. Y-o-Y Growth Trend Analysis
7.2.2. Absolute $ Opportunity Analysis
8. Market Background
8.1. Macro-Economic Factors
8.1.1. Global GDP Growth Outlook
8.1.2. Global Industrial Automation Overview
8.1.3. Manufacturing Value Addition
8.1.4. Other Key Macro Economic Factors
8.2. Forecast Factors - Relevance & Impact
8.2.1. Top Companies Historical Growth
8.2.2. GDP Growth forecast
8.2.3. Manufacturing Industry forecast
8.2.4. Global Urbanization Growth Outlook
8.2.5. Business Climate
8.2.6. Other Key Forecast Factors
8.3. Value Chain
8.3.1. Raw Material Suppliers
8.3.2. Product Manufacturers
8.3.3. End Users
8.4. COVID-19 Crisis – Impact Assessment
8.4.1. Current Statistics
8.4.2. Short-Mid-Long Term Outlook
8.4.3. Likely Rebound
8.5. Market Dynamics
8.5.1. Drivers
8.5.2. Restraints
8.5.3. Opportunity Analysis
9. Global Inductor Market Analysis 2017-2021 and Forecast 2022-2032, by Inductance
9.1. Introduction / Key Findings
9.2. Historical Market Size (US$ Mn) and Volume Analysis by Inductance, 2017-2021
9.3. Current and Future Market Size (US$ Mn) and Volume Analysis and Forecast by Inductance, 2022-2032
9.3.1. Fixed Inductors
9.3.2. Variable Inductors
9.4. Market Attractiveness Analysis by Inductance
10. Global Inductor Market Analysis 2017-2021 and Forecast 2022-2032, by Type
10.1. Introduction / Key Findings
10.2. Historical Market Size (US$ Mn) and Volume Analysis by Type, 2017-2021
10.3. Current and Future Market Size (US$ Mn) and Volume Analysis and Forecast by Type, 2022-2032
10.3.1. Film Type
10.3.1.1. Thin Film
10.3.1.2. Thick Film
10.3.2. Multilayered
10.3.3. Wire Wound
10.3.3.1. Bobbin
10.3.3.2. Toroidal
10.3.4. Molded
10.4. Market Attractiveness Analysis by Type
11. Global Inductor Market Analysis 2017-2021 and Forecast 2022-2032, by Core Type
11.1. Introduction / Key Findings
11.2. Historical Market Size (US$ Mn) and Volume Analysis by Core Type, 2017-2021
11.3. Current and Future Market Size (US$ Mn) and Volume Analysis and Forecast by Core Type, 2022-2032
11.3.1. Air Core
11.3.1.1. Ceramic Core
11.3.1.2. Phenolic Core
11.3.2. Ferromagnetic/Ferrite Core
11.3.2.1. Soft Ferrites
11.3.2.2. Hard Ferrites
11.3.3. Iron Core
11.4. Market Attractiveness Analysis by Core Type
12. Global Inductor Market Analysis 2017-2021 and Forecast 2022-2032, by Mounting Technique
12.1. Introduction / Key Findings
12.2. Historical Market Size (US$ Mn) and Volume Analysis by Mounting Technique, 2017-2021
12.3. Current and Future Market Size (US$ Mn) and Volume Analysis and Forecast by Mounting Technique, 2022-2032
12.3.1. Surface Mount
12.3.2. Through Hole
12.4. Market Attractiveness Analysis by Mounting Technique
13. Global Inductor Market Analysis 2017-2021 and Forecast 2022-2032, by Application
13.1. Introduction / Key Findings
13.2. Historical Market Size (US$ Mn) and Volume Analysis by Application, 2017-2021
13.3. Current and Future Market Size (US$ Mn) and Volume Analysis and Forecast by Application, 2022-2032
13.3.1. Automotive
13.3.2. Industrial
13.3.3. RF & Telecommunication and High Frequency Application
13.3.4. Military & Defense
13.3.5. Consumer Electronics
13.3.6. Power Generation, Transmission & Distribution
13.3.7. Healthcare
13.4. Market Attractiveness Analysis by Application
14. Global Inductor Market Analysis 2017-2021 and Forecast 2022-2032, by Region
14.1. Introduction
14.2. Historical Market Size (US$ Mn) and Volume Analysis by Region, 2017-2021
14.3. Current Market Size (US$ Mn) and Volume Analysis and Forecast by Region, 2022-2032
14.3.1. North America
14.3.2. Latin America
14.3.3. Europe
14.3.4. Middle East and Africa (MEA)
14.3.5. East Asia
14.3.6. South Asia and Pacific
14.4. Market Attractiveness Analysis by Region
15. North America Inductor Market Analysis 2017-2021 and Forecast 2022-2032
15.1. Introduction
15.2. Pricing Analysis
15.3. Historical Market Size (US$ Mn) and Volume Trend Analysis by Market Taxonomy, 2017-2021
15.4. Market Size (US$ Mn) and Volume Forecast by Market Taxonomy, 2022-2032
15.4.1. By Country
15.4.1.1. U.S.
15.4.1.2. Canada
15.4.2. By Inductance
15.4.3. By Type
15.4.4. By Core Type
15.4.5. By Mounting Technique
15.4.6. By Application
15.5. Market Attractiveness Analysis
15.5.1. By Country
15.5.2. By Inductance
15.5.3. By Type
15.5.4. By Core Type
15.5.5. By Mounting Technique
15.5.6. By Application
15.6. Market Trends
16. Latin America Inductor Market Analysis 2017-2021 and Forecast 2022-2032
16.1. Introduction
16.2. Pricing Analysis
16.3. Historical Market Size (US$ Mn) and Volume Trend Analysis by Market Taxonomy, 2017-2021
16.4. Market Size (US$ Mn) and Volume Forecast by Market Taxonomy, 2022-2032
16.4.1. By Country
16.4.1.1. Brazil
16.4.1.2. Mexico
16.4.1.3. Rest of Latin America
16.4.2. By Inductance
16.4.3. By Type
16.4.4. By Core Type
16.4.5. By Mounting Technique
16.4.6. By Application
16.5. Market Attractiveness Analysis
16.5.1. By Country
16.5.2. By Inductance
16.5.3. By Type
16.5.4. By Core Type
16.5.5. By Mounting Technique
16.5.6. By Application
16.6. Market Trends
17. Europe Inductor Market Analysis 2017-2021 and Forecast 2022-2032
17.1. Introduction
17.2. Pricing Analysis
17.3. Historical Market Size (US$ Mn) and Volume Trend Analysis by Market Taxonomy, 2017-2021
17.4. Market Size (US$ Mn) and Volume Forecast by Market Taxonomy, 2022-2032
17.4.1. By Country
17.4.1.1. Germany
17.4.1.2. Italy
17.4.1.3. France
17.4.1.4. U.K.
17.4.1.5. Spain
17.4.1.6. BENELUX
17.4.1.7. Russia
17.4.1.8. Rest of Europe
17.4.2. By Inductance
17.4.3. By Type
17.4.4. By Core Type
17.4.5. By Mounting Technique
17.4.6. By Application
17.5. Market Attractiveness Analysis
17.5.1. By Country
17.5.2. By Inductance
17.5.3. By Type
17.5.4. By Core Type
17.5.5. By Mounting Technique
17.5.6. By Application
17.6. Market Trends
18. South Asia and Pacific Inductor Market Analysis 2017-2021 and Forecast 2022-2032
18.1. Introduction
18.2. Pricing Analysis
18.3. Historical Market Size (US$ Mn) and Volume Trend Analysis by Market Taxonomy, 2017-2021
18.4. Market Size (US$ Mn) and Volume Forecast by Market Taxonomy, 2022-2032
18.4.1. By Country
18.4.1.1. India
18.4.1.2. ASEAN
18.4.1.3. Oceania
18.4.1.4. Rest of South Asia & Pacific
18.4.2. By Inductance
18.4.3. By Type
18.4.4. By Core Type
18.4.5. By Mounting Technique
18.4.6. By Application
18.5. Market Attractiveness Analysis
18.5.1. By Country
18.5.2. By Inductance
18.5.3. By Type
18.5.4. By Core Type
18.5.5. By Mounting Technique
18.5.6. By Application
18.6. Market Trends
19. East Asia Inductor Market Analysis 2017-2021 and Forecast 2022-2032
19.1. Introduction
19.2. Pricing Analysis
19.3. Historical Market Size (US$ Mn) and Volume Trend Analysis by Market Taxonomy, 2017-2021
19.4. Market Size (US$ Mn) and Volume Forecast by Market Taxonomy, 2022-2032
19.4.1. By Country
19.4.1.1. China
19.4.1.2. Japan
19.4.1.3. South Korea
19.4.2. By Inductance
19.4.3. By Type
19.4.4. By Core Type
19.4.5. By Mounting Technique
19.4.6. By Application
19.5. Market Attractiveness Analysis
19.5.1. By Country
19.5.2. By Inductance
19.5.3. By Type
19.5.4. By Core Type
19.5.5. By Mounting Technique
19.5.6. By Application
19.6. Market Trends
20. Middle East and Africa Inductor Market Analysis 2017-2021 and Forecast 2022-2032
20.1. Introduction
20.2. Pricing Analysis
20.3. Historical Market Size (US$ Mn) and Volume Trend Analysis by Market Taxonomy, 2017-2021
20.4. Market Size (US$ Mn) and Volume Forecast by Market Taxonomy, 2022-2032
20.4.1. By Country
20.4.1.1. GCC Countries
20.4.1.2. Turkey
20.4.1.3. Northern Africa
20.4.1.4. South Africa
20.4.1.5. Rest of Middle East and Africa
20.4.2. By Inductance
20.4.3. By Type
20.4.4. By Core Type
20.4.5. By Mounting Technique
20.4.6. By Application
20.5. Market Attractiveness Analysis
20.5.1. By Country
20.5.2. By Inductance
20.5.3. By Type
20.5.4. By Core Type
20.5.5. By Mounting Technique
20.5.6. By Application
20.6. Market Trends
21. Emerging Countries Inductor Market Analysis
21.1. Introduction
21.1.1. Market Value Proportion Analysis, By Key Countries
21.1.2. Global Vs. Country Growth Comparison
21.2. U.S. Inductor Market Analysis
21.2.1. By Inductance
21.2.2. By Type
21.2.3. By Core Type
21.2.4. By Mounting Technique
21.2.5. By Application
21.3. Canada Inductor Market Analysis
21.3.1. By Inductance
21.3.2. By Type
21.3.3. By Core Type
21.3.4. By Mounting Technique
21.3.5. By Application
21.4. Brazil Inductor Market Analysis
21.4.1. By Inductance
21.4.2. By Type
21.4.3. By Core Type
21.4.4. By Mounting Technique
21.4.5. By Application
21.5. Mexico Inductor Market Analysis
21.5.1. By Inductance
21.5.2. By Type
21.5.3. By Core Type
21.5.4. By Mounting Technique
21.5.5. By Application
21.6. Germany Inductor Market Analysis
21.6.1. By Inductance
21.6.2. By Type
21.6.3. By Core Type
21.6.4. By Mounting Technique
21.6.5. By Application
21.7. Italy Inductor Market Analysis
21.7.1. By Inductance
21.7.2. By Type
21.7.3. By Core Type
21.7.4. By Mounting Technique
21.7.5. By Application
21.8. France Inductor Market Analysis
21.8.1. By Inductance
21.8.2. By Type
21.8.3. By Core Type
21.8.4. By Mounting Technique
21.8.5. By Application
21.9. U.K. Inductor Market Analysis
21.9.1. By Inductance
21.9.2. By Type
21.9.3. By Core Type
21.9.4. By Mounting Technique
21.9.5. By Application
21.10. Spain Inductor Market Analysis
21.10.1. By Inductance
21.10.2. By Type
21.10.3. By Core Type
21.10.4. By Mounting Technique
21.10.5. By Application
21.11. BENELUX Inductor Market Analysis
21.11.1. By Inductance
21.11.2. By Type
21.11.3. By Core Type
21.11.4. By Mounting Technique
21.11.5. By Application
21.12. Russia Inductor Market Analysis
21.12.1. By Inductance
21.12.2. By Type
21.12.3. By Core Type
21.12.4. By Mounting Technique
21.12.5. By Application
21.13. China Inductor Market Analysis
21.13.1. By Inductance
21.13.2. By Type
21.13.3. By Core Type
21.13.4. By Mounting Technique
21.13.5. By Application
21.14. Japan Inductor Market Analysis
21.14.1. By Inductance
21.14.2. By Type
21.14.3. By Core Type
21.14.4. By Mounting Technique
21.14.5. By Application
21.15. S. Korea Inductor Market Analysis
21.15.1. By Inductance
21.15.2. By Type
21.15.3. By Core Type
21.15.4. By Mounting Technique
21.15.5. By Application
21.16. India Inductor Market Analysis
21.16.1. By Inductance
21.16.2. By Type
21.16.3. By Core Type
21.16.4. By Mounting Technique
21.16.5. By Application
21.17. ASEAN Inductor Market Analysis
21.17.1. By Inductance
21.17.2. By Type
21.17.3. By Core Type
21.17.4. By Mounting Technique
21.17.5. By Application
21.18. Australia and New Zealand Inductor Market Analysis
21.18.1. By Inductance
21.18.2. By Type
21.18.3. By Core Type
21.18.4. By Mounting Technique
21.18.5. By Application
21.19. GCC Inductor Market Analysis
21.19.1. By Inductance
21.19.2. By Type
21.19.3. By Core Type
21.19.4. By Mounting Technique
21.19.5. By Application
21.20. Turkey Inductor Market Analysis
21.20.1. By Inductance
21.20.2. By Type
21.20.3. By Core Type
21.20.4. By Mounting Technique
21.20.5. By Application
21.21. South Africa Inductor Market Analysis
21.21.1. By Inductance
21.21.2. By Type
21.21.3. By Core Type
21.21.4. By Mounting Technique
21.21.5. By Application
21.22. Northern Africa Inductor Market Analysis
21.22.1. By Inductance
21.22.2. By Type
21.22.3. By Core Type
21.22.4. By Mounting Technique
21.22.5. By Application
22. Market Structure Analysis
22.1. Market Analysis by Tier of Companies (Inductor)
22.2. Market Share Analysis of Top Players
22.3. Market Presence Analysis
23. Competition Analysis
23.1. Competition Dashboard
23.2. Competition Benchmarking
23.3. Competition Deep Dive
23.3.1. Murata Manufacturing
23.3.1.1. Overview
23.3.1.2. Product Portfolio
23.3.1.3. Profitability by Market Segments (Product/Channel/Region)
23.3.1.4. Sales Footprint
23.3.1.5. Strategy Overview
23.3.2. TDK
23.3.2.1. Overview
23.3.2.2. Product Portfolio
23.3.2.3. Profitability by Market Segments (Product/Channel/Region)
23.3.2.4. Sales Footprint
23.3.2.5. Strategy Overview
23.3.3. Vishay Intertechnology
23.3.3.1. Overview
23.3.3.2. Product Portfolio
23.3.3.3. Profitability by Market Segments (Product/Channel/Region)
23.3.3.4. Sales Footprint
23.3.3.5. Strategy Overview
23.3.4. TAIYO YUDEN
23.3.4.1. Overview
23.3.4.2. Product Portfolio
23.3.4.3. Profitability by Market Segments (Product/Channel/Region)
23.3.4.4. Sales Footprint
23.3.4.5. Strategy Overview
23.3.5. Chilisin
23.3.5.1. Overview
23.3.5.2. Product Portfolio
23.3.5.3. Profitability by Market Segments (Product/Channel/Region)
23.3.5.4. Sales Footprint
23.3.5.5. Strategy Overview
23.3.6. Delta Electronics
23.3.6.1. Overview
23.3.6.2. Product Portfolio
23.3.6.3. Profitability by Market Segments (Product/Channel/Region)
23.3.6.4. Sales Footprint
23.3.6.5. Strategy Overview
23.3.7. Panasonic
23.3.7.1. Overview
23.3.7.2. Product Portfolio
23.3.7.3. Profitability by Market Segments (Product/Channel/Region)
23.3.7.4. Sales Footprint
23.3.7.5. Strategy Overview
23.3.8. ABC Taiwan Electronics
23.3.8.1. Overview
23.3.8.2. Product Portfolio
23.3.8.3. Profitability by Market Segments (Product/Channel/Region)
23.3.8.4. Sales Footprint
23.3.8.5. Strategy Overview
23.3.9. Pulse Electronics
23.3.9.1. Overview
23.3.9.2. Product Portfolio
23.3.9.3. Profitability by Market Segments (Product/Channel/Region)
23.3.9.4. Sales Footprint
23.3.9.5. Strategy Overview
23.3.10. Coilcraft
23.3.10.1. Overview
23.3.10.2. Product Portfolio
23.3.10.3. Profitability by Market Segments (Product/Channel/Region)
23.3.10.4. Sales Footprint
23.3.10.5. Strategy Overview
23.3.11. Shenzhen Sunlord Electronics
23.3.11.1. Overview
23.3.11.2. Product Portfolio
23.3.11.3. Profitability by Market Segments (Product/Channel/Region)
23.3.11.4. Sales Footprint
23.3.11.5. Strategy Overview
23.3.12. Bourns
23.3.12.1. Overview
23.3.12.2. Product Portfolio
23.3.12.3. Profitability by Market Segments (Product/Channel/Region)
23.3.12.4. Sales Footprint
23.3.12.5. Strategy Overview
23.3.13. ICE Components
23.3.13.1. Overview
23.3.13.2. Product Portfolio
23.3.13.3. Profitability by Market Segments (Product/Channel/Region)
23.3.13.4. Sales Footprint
23.3.13.5. Strategy Overview
23.3.14. Kyocera Corp AVX
23.3.14.1. Overview
23.3.14.2. Product Portfolio
23.3.14.3. Profitability by Market Segments (Product/Channel/Region)
23.3.14.4. Sales Footprint
23.3.14.5. Strategy Overview
23.3.15. Bel Fuse Inc.
23.3.15.1. Overview
23.3.15.2. Product Portfolio
23.3.15.3. Profitability by Market Segments (Product/Channel/Region)
23.3.15.4. Sales Footprint
23.3.15.5. Strategy Overview
23.3.16. Wurth Elektronik
23.3.16.1. Overview
23.3.16.2. Product Portfolio
23.3.16.3. Profitability by Market Segments (Product/Channel/Region)
23.3.16.4. Sales Footprint
23.3.16.5. Strategy Overview
23.3.17. TE Connectivity
23.3.17.1. Overview
23.3.17.2. Product Portfolio
23.3.17.3. Profitability by Market Segments (Product/Channel/Region)
23.3.17.4. Sales Footprint
23.3.17.5. Strategy Overview
23.3.18. Samsung Electro Mechanics
23.3.18.1. Overview
23.3.18.2. Product Portfolio
23.3.18.3. Profitability by Market Segments (Product/Channel/Region)
23.3.18.4. Sales Footprint
23.3.18.5. Strategy Overview
24. Assumptions and Acronyms Used
25. Research Methodology
Let us know your requirement to get
100% FREE customization
List of Tables
Table 01: Global Inductor Market Value (US$ Mn) and Volume (Mn Units) Historical Data 2017 – 2021 and Forecast 2022-2032 by Inductance
Table 02: Global Inductor Market Volume (Mn Units) Historical Data 2017 – 2021 and Forecast 2022-2032 by Type
Table 03: Global Inductor Market Value (US$ Mn) Historical Data 2017 – 2021 and Forecast 2022-2032 by Type
Table 04: Global Inductor Market Volume (Mn Units) Historical Data 2017–2021 and Forecast 2022–2032 By Core Type
Table 05: Global Inductor Market Value (US$ Mn) Historical Data 2017–2021 and Forecast 2022–2032 By Core Type
Table 06: Global Inductor Market Value (US$ Mn) and Volume (Mn Units) Historical Data 2017–2021 and Forecast 2022–2032 By Mounting Techniques
Table 07: Global Inductor Market Volume (Mn Units) Historical Data 2017 – 2021 and Forecast 2022-2032 By Application
Table 08: Global Inductor Market Value (US$ Mn) Historical Data 2017 – 2021 and Forecast 2022-2032 By Application
Table 09: Global Inductor Market Value (US$ Mn) and Volume (Mn Units) Historical Data 2017 – 2021 and Forecast 2022-2032 By Region
Table 10: North America Inductor Market Value (US$ Mn) and Volume (Mn Units) Historical Data 2017–2021 and Forecast 2022–2032 By Country
Table 11: North America Inductor Market Value (US$ Mn) and Volume (Mn Units) Historical Data 2017 – 2021 and Forecast 2022-2032 by Inductance
Table 12: North America Inductor Market Volume (Mn Units) Historical Data 2017 – 2021 and Forecast 2022-2032 by Type
Table 13: North America Inductor Market Value (US$ Mn) Historical Data 2017 – 2021 and Forecast 2022-2032 by Type
Table 14: North America Inductor Market Value (US$ Mn) and Volume (Mn Units) Historical Data 2017–2021 and Forecast 2022–2032 By Core Type
Table 15: North America Inductor Market Value (US$ Mn) and Volume (Mn Units) Historical Data 2017–2021 and Forecast 2022–2032 By Mounting Techniques
Table 16: North America Inductor Market Volume (Mn Units) Historical Data 2017 – 2021 and Forecast 2022-2032 By Application
Table 17: North America Inductor Market Value (US$ Mn) Historical Data 2017 – 2021 and Forecast 2022-2032 By Application
Table 18: Latin America Inductor Market Volume (Mn Units) and Value (US$ Mn) Historical Data 2017–2021 and Forecast 2022–2032 By Country
Table 19: Latin America Inductor Market Value (US$ Mn) and Volume (Mn Units) Historical Data 2017 – 2021 and Forecast 2022-2032 by Inductance
Table 20: Latin America Inductor Market Volume (Mn Units) Historical Data 2017 – 2021 and Forecast 2022-2032 by Type
Table 21: Latin America Inductor Market Value (US$ Mn) Historical Data 2017 – 2021 and Forecast 2022-2032 by Type
Table 22: Latin America Inductor Market Value (US$ Mn) and Volume (Mn Units) Historical Data 2017–2021 and Forecast 2022–2032 By Core Type
Table 23: Latin America Inductor Market Value (US$ Mn) and Volume (Mn Units) Historical Data 2017–2021 and Forecast 2022–2032 By Mounting Techniques
Table 24: Latin America Inductor Market Volume (Mn Units) Historical Data 2017 – 2021 and Forecast 2022-2032 By Application
Table 25: Latin America Inductor Market Value (US$ Mn) Historical Data 2017 – 2021 and Forecast 2022-2032 By Application
Table 26: Europe Inductor Market Value (US$ Mn) and Volume (Mn Units) Historical Data 2017–2021 and Forecast 2022–2032 By Country
Table 27: Europe Inductor Market Value (US$ Mn) and Volume (Mn Units) Historical Data 2017 – 2021 and Forecast 2022-2032 by Inductance
Table 28: Europe Inductor Market Volume (Mn Units) Historical Data 2017 – 2021 and Forecast 2022-2032 by Type
Table 29: Europe Inductor Market Value (US$ Mn) Historical Data 2017 – 2021 and Forecast 2022-2032 by Type
Table 30: Europe Inductor Market Value (US$ Mn) and Volume (Mn Units) Historical Data 2017–2021 and Forecast 2022–2032 By Core Type
Table 31: Europe Inductor Market Value (US$ Mn) and Volume (Mn Units) Historical Data 2017–2021 and Forecast 2022–2032 By Mounting Techniques
Table 32: Europe Inductor Market Volume (Mn Units) Historical Data 2017 – 2021 and Forecast 2022-2032 By Application
Table 33: Europe Inductor Market Value (US$ Mn) Historical Data 2017 – 2021 and Forecast 2022-2032 By Application
Table 34: East Asia Inductor Market Value (US$ Mn) and Volume (Mn Units) Historical Data 2017–2021 and Forecast 2022–2032 By Country
Table 35: East Asia Inductor Market Value (US$ Mn) and Volume (Mn Units) Historical Data 2017 – 2021 and Forecast 2022-2032 by Inductance
Table 36: East Asia Inductor Market Volume (Mn Units) Historical Data 2017 – 2021 and Forecast 2022-2032 by Type
Table 37: East Asia Inductor Market Value (US$ Mn) Historical Data 2017 – 2021 and Forecast 2022-2032 by Type
Table 38: East Asia Inductor Market Value (US$ Mn) and Volume (Mn Units) Historical Data 2017–2021 and Forecast 2022–2032 By Core Type
Table 39: East Asia Inductor Market Value (US$ Mn) and Volume (Mn Units) Historical Data 2017–2021 and Forecast 2022–2032 By Mounting Techniques
Table 40: East Asia Inductor Market Volume (Mn Units) Historical Data 2017 – 2021 and Forecast 2022-2032 By Application
Table 41: East Asia Inductor Market Value (US$ Mn) Historical Data 2017 – 2021 and Forecast 2022-2032 By Application
Table 42: South Asia & Pacific Inductor Market Value (US$ Mn) and Volume (Mn Units) Historical Data 2017–2021 and Forecast 2022–2032 By Country
Table 43: South Asia & Pacific Inductor Market Value (US$ Mn) and Volume (Mn Units) Historical Data 2017 – 2021 and Forecast 2022-2032 by Inductance
Table 44: South Asia & Pacific Inductor Market Volume (Mn Units) Historical Data 2017 – 2021 and Forecast 2022-2032 by Type
Table 45: South Asia & Pacific Inductor Market Value (US$ Mn) Historical Data 2017 – 2021 and Forecast 2022-2032 by Type
Table 46: South Asia & Pacific Inductor Market Value (US$ Mn) and Volume (Mn Units) Historical Data 2017–2021 and Forecast 2022–2032 By Core Type
Table 47: South Asia & Pacific Inductor Market Value (US$ Mn) and Volume (Mn Units) Historical Data 2017–2021 and Forecast 2022–2032 By Mounting Techniques
Table 48: South Asia & Pacific Inductor Market Volume (Mn Units) Historical Data 2017 – 2021 and Forecast 2022-2032 By Application
Table 49: South Asia & Pacific Inductor Market Value (US$ Mn) Historical Data 2017 – 2021 and Forecast 2022-2032 By Application
Table 50: Middle East & Africa Inductor Market Value (US$ Mn) and Volume (Mn Units) Historical Data 2017–2021 and Forecast 2022–2032 By Country
Table 51: Middle East & Africa Inductor Market Value (US$ Mn) and Volume (Mn Units) Historical Data 2017 – 2021 and Forecast 2022-2032 by Inductance
Table 52: Middle East & Africa Inductor Market Volume (Mn Units) Historical Data 2017 – 2021 and Forecast 2022-2032 by Type
Table 53: Middle East & Africa Inductor Market Value (US$ Mn) Historical Data 2017 – 2021 and Forecast 2022-2032 by Type
Table 54: Middle East & Africa Inductor Market Value (US$ Mn) and Volume (Mn Units) Historical Data 2017–2021 and Forecast 2022–2032 By Core Type
Table 55: Middle East & Africa Inductor Market Value (US$ Mn) and Volume (Mn Units) Historical Data 2017–2021 and Forecast 2022–2032 By Mounting Techniques
Table 56: Middle East & Africa Inductor Market Volume (Mn Units) Historical Data 2017 – 2021 and Forecast 2022-2032 By Application
Table 57: Middle East & Africa Inductor Market Value (US$ Mn) Historical Data 2017 – 2021 and Forecast 2022-2032 By Application
Find your sweet spots for generating winning opportunities in this market.
Talk to AnalystList of Charts
Figure 01: Global Inductor Market Historical Volume (Mn Units), 2017–2021
Figure 02: Global Inductor Market Volume (Mn Units) Forecast, 2022–2032
Figure 03: Global Inductor Market Historical Value (US$ Mn), 2017 – 2021
Figure 04: Global Inductor Market Value (US$ Mn) Forecast, 2022 – 2032
Figure 05: Global Inductor Market Absolute $ Opportunity, 2022 – 2032
Figure 06: Global Inductor Market Share and BPS Analysis by Inductance– 2022 & 2032
Figure 07: Global Inductor Market Y-o-Y Growth Projections by Inductance, 2022-2032
Figure 08: Global Inductor Market Attractiveness by Inductance, 2022-2032
Figure 09: Global Inductor Market Share and BPS Analysis by Type – 2022 & 2032
Figure 10: Global Inductor Market Y-o-Y Growth Projections by Type, 2022-2032
Figure 11: Global Inductor Market Attractiveness by Type, 2022-2032
Figure 12: Global Inductor Market Share and BPS Analysis by Core Type – 2022 & 2032
Figure 13: Global Inductor Market Y-o-Y Growth Projections by Core Type, 2022-2032
Figure 14: Global Inductor Market Attractiveness by Core Type, 2022-2032
Figure 15: Global Inductor Market Share and BPS Analysis by Mounting Techniques– 2022 & 2032
Figure 16: Global Inductor Market Y-o-Y Growth Projections by Mounting Techniques, 2022-2032
Figure 17: Global Inductor Market Attractiveness by Mounting Techniques, 2022-2032
Figure 18: Global Inductor Market Share and BPS Analysis by Application– 2022 & 2032
Figure 19: Global Inductor Market Y-o-Y Growth Projections by Application, 2022-2032
Figure 20: Global Inductor Market Attractiveness by Application, 2022-2032
Figure 21: Global Inductor Market Share and BPS Analysis by Region– 2022 & 2032
Figure 22: Global Inductor Market Y-o-Y Growth Projections by Region, 2022-2032
Figure 23: Global Inductor Market Attractiveness by Region, 2022-2032
Figure 24: North America Inductor Market Share and BPS Analysis by Country – 2022 & 2032
Figure 25: North America Inductor Market Y-o-Y Growth Projections by Country, 2022-2032
Figure 26: North America Inductor Market Attractiveness by Country, 2022-2032
Figure 27: North America Inductor Market Share and BPS Analysis by Inductance– 2022 & 2032
Figure 28: North America Inductor Market Y-o-Y Growth Projections by Inductance, 2022-2032
Figure 29: North America Inductor Market Attractiveness by Inductance, 2022-2032
Figure 30: North America Inductor Market Share and BPS Analysis by Type – 2022 & 2032
Figure 31: North America Inductor Market Y-o-Y Growth Projections by Type, 2022-2032
Figure 32: North America Inductor Market Attractiveness by Type, 2022-2032
Figure 33: North America Inductor Market Share and BPS Analysis by Core Type – 2022 & 2032
Figure 34: North America Inductor Market Y-o-Y Growth Projections by Core Type, 2022-2032
Figure 35: North America Inductor Market Attractiveness by Core Type, 2022-2032
Figure 36: North America Inductor Market Share and BPS Analysis by Mounting Techniques– 2022 & 2032
Figure 37: North America Inductor Market Y-o-Y Growth Projections by Mounting Techniques, 2022-2032
Figure 38: North America Inductor Market Attractiveness by Mounting Techniques, 2022-2032
Figure 39: North America Inductor Market Share and BPS Analysis by Application– 2022 & 2032
Figure 40: North America Inductor Market Y-o-Y Growth Projections by Application, 2022-2032
Figure 41: North America Inductor Market Attractiveness by Application, 2022-2032
Figure 42: Latin America Inductor Market Share and BPS Analysis by Country – 2022 & 2032
Figure 43: Latin America Inductor Market Y-o-Y Growth Projections by Country, 2022-2032
Figure 44: Latin America Inductor Market Attractiveness by Country, 2022-2032
Figure 45: Latin America Inductor Market Share and BPS Analysis by Inductance– 2022 & 2032
Figure 46: Latin America Inductor Market Y-o-Y Growth Projections by Inductance, 2022-2032
Figure 47: Latin America Inductor Market Attractiveness by Inductance, 2022-2032
Figure 48: Latin America Inductor Market Share and BPS Analysis by Type – 2022 & 2032
Figure 49: Latin America Inductor Market Y-o-Y Growth Projections by Type, 2022-2032
Figure 50: Latin America Inductor Market Attractiveness by Type, 2022-2032
Figure 51: Latin America Inductor Market Share and BPS Analysis by Core Type – 2022 & 2032
Figure 52: Latin America Inductor Market Y-o-Y Growth Projections by Core Type, 2022-2032
Figure 53: Latin America Inductor Market Attractiveness by Core Type, 2022-2032
Figure 54: Latin America Inductor Market Share and BPS Analysis by Mounting Techniques– 2022 & 2032
Figure 55: Latin America Inductor Market Y-o-Y Growth Projections by Mounting Techniques, 2022-2032
Figure 56: Latin America Inductor Market Attractiveness by Mounting Techniques, 2022-2032
Figure 57: Latin America Inductor Market Share and BPS Analysis by Application– 2022 & 2032
Figure 58: Latin America Inductor Market Y-o-Y Growth Projections by Application, 2022-2032
Figure 59: Latin America Inductor Market Attractiveness by Application, 2022-2032
Figure 60: Europe Inductor Market Share and BPS Analysis by Country – 2022 & 2032
Figure 61: Europe Inductor Market Y-o-Y Growth Projections by Country, 2022-2032
Figure 62: Europe Inductor Market Attractiveness by Country, 2022-2032
Figure 63: Europe Inductor Market Share and BPS Analysis by Inductance– 2022 & 2032
Figure 64: Europe Inductor Market Y-o-Y Growth Projections by Inductance, 2022-2032
Figure 65: Europe Inductor Market Attractiveness by Inductance, 2022-2032
Figure 66: Europe Inductor Market Share and BPS Analysis by Type – 2022 & 2032
Figure 67: Europe Inductor Market Y-o-Y Growth Projections by Type, 2022-2032
Figure 68: Europe Inductor Market Attractiveness by Type, 2022-2032
Figure 69: Europe Inductor Market Share and BPS Analysis by Core Type – 2022 & 2032
Figure 70: Europe Inductor Market Y-o-Y Growth Projections by Core Type, 2022-2032
Figure 71: Europe Inductor Market Attractiveness by Core Type, 2022-2032
Figure 72: Europe Inductor Market Share and BPS Analysis by Mounting Techniques– 2022 & 2032
Figure 73: Europe Inductor Market Y-o-Y Growth Projections by Mounting Techniques, 2022-2032
Figure 74: Europe Inductor Market Attractiveness by Mounting Techniques, 2022-2032
Figure 75: Europe Inductor Market Share and BPS Analysis by Application– 2022 & 2032
Figure 76: Europe Inductor Market Y-o-Y Growth Projections by Application, 2022-2032
Figure 77: Europe Inductor Market Attractiveness by Application, 2022-2032
Figure 78: East Asia Inductor Market Share and BPS Analysis by Country – 2022 & 2032
Figure 79: East Asia Inductor Market Y-o-Y Growth Projections by Country, 2022-2032
Figure 80: East Asia Inductor Market Attractiveness by Country, 2022-2032
Figure 81: East Asia Inductor Market Share and BPS Analysis by Inductance– 2022 & 2032
Figure 82: East Asia Inductor Market Y-o-Y Growth Projections by Inductance, 2022-2032
Figure 83: East Asia Inductor Market Attractiveness by Inductance, 2022-2032
Figure 84: East Asia Inductor Market Share and BPS Analysis by Type – 2022 & 2032
Figure 85: East Asia Inductor Market Y-o-Y Growth Projections by Type, 2022-2032
Figure 86: East Asia Inductor Market Attractiveness by Type, 2022-2032
Figure 87: East Asia Inductor Market Share and BPS Analysis by Core Type – 2022 & 2032
Figure 88: East Asia Inductor Market Y-o-Y Growth Projections by Core Type, 2022-2032
Figure 89: East Asia Inductor Market Attractiveness by Core Type, 2022-2032
Figure 90: East Asia Inductor Market Share and BPS Analysis by Mounting Techniques– 2022 & 2032
Figure 91: East Asia Inductor Market Y-o-Y Growth Projections by Mounting Techniques, 2022-2032
Figure 92: East Asia Inductor Market Attractiveness by Mounting Techniques, 2022-2032
Figure 93: East Asia Inductor Market Share and BPS Analysis by Application– 2022 & 2032
Figure 94: East Asia Inductor Market Y-o-Y Growth Projections by Application, 2022-2032
Figure 95: East Asia Inductor Market Attractiveness by Application, 2022-2032
Figure 96: South Asia & Pacific Inductor Market Share and BPS Analysis by Country – 2022 & 2032
Figure 97: South Asia & Pacific Inductor Market Y-o-Y Growth Projections by Country, 2022-2032
Figure 98: South Asia & Pacific Inductor Market Attractiveness by Country, 2022-2032
Figure 99: South Asia & Pacific Inductor Market Share and BPS Analysis by Inductance– 2022 & 2032
Figure 100: South Asia & Pacific Inductor Market Y-o-Y Growth Projections by Inductance, 2022-2032
Figure 101: South Asia & Pacific Inductor Market Attractiveness by Inductance, 2022-2032
Figure 102: South Asia & Pacific Inductor Market Share and BPS Analysis by Type – 2022 & 2032
Figure 103: South Asia & Pacific Inductor Market Y-o-Y Growth Projections by Type, 2022-2032
Figure 104: South Asia & Pacific Inductor Market Attractiveness by Type, 2022-2032
Figure 105: South Asia & Pacific Inductor Market Share and BPS Analysis by Core Type – 2022 & 2032
Figure 106: South Asia & Pacific Inductor Market Y-o-Y Growth Projections by Core Type, 2022-2032
Figure 107: South Asia & Pacific Inductor Market Attractiveness by Core Type, 2022-2032
Figure 108: South Asia & Pacific Inductor Market Share and BPS Analysis by Mounting Techniques– 2022 & 2032
Figure 109: South Asia & Pacific Inductor Market Y-o-Y Growth Projections by Mounting Techniques, 2022-2032
Figure 110: South Asia & Pacific Inductor Market Attractiveness by Mounting Techniques, 2022-2032
Figure 111: South Asia & Pacific Inductor Market Share and BPS Analysis by Application– 2022 & 2032
Figure 112: South Asia & Pacific Inductor Market Y-o-Y Growth Projections by Application, 2022-2032
Figure 113: South Asia & Pacific Inductor Market Attractiveness by Application, 2022-2032
Figure 114: Middle East & Africa Inductor Market Share and BPS Analysis by Country– 2022 & 2032
Figure 115: Middle East & Africa Inductor Market Y-o-Y Growth Projections by Country, 2022-2032
Figure 116: Middle East & Africa Inductor Market Attractiveness by Country, 2022-2032
Figure 117: Middle East & Africa Inductor Market Share and BPS Analysis by Inductance– 2022 & 2032
Figure 118: Middle East & Africa Inductor Market Y-o-Y Growth Projections by Inductance, 2022-2032
Figure 119: Middle East & Africa Inductor Market Attractiveness by Inductance, 2022-2032
Figure 120: Middle East & Africa Inductor Market Share and BPS Analysis by Type – 2022 & 2032
Figure 121: Middle East & Africa Inductor Market Y-o-Y Growth Projections by Type, 2022-2032
Figure 122: Middle East & Africa Inductor Market Attractiveness by Type, 2022-2032
Figure 123: Middle East & Africa Inductor Market Share and BPS Analysis by Core Type – 2022 & 2032
Figure 124: Middle East & Africa Inductor Market Y-o-Y Growth Projections by Core Type, 2022-2032
Figure 125: Middle East & Africa Inductor Market Attractiveness by Core Type, 2022-2032
Figure 126: Middle East & Africa Inductor Market Share and BPS Analysis by Mounting Techniques– 2022 & 2032
Figure 127: Middle East & Africa Inductor Market Y-o-Y Growth Projections by Mounting Techniques, 2022-2032
Figure 128: Middle East & Africa Inductor Market Attractiveness by Mounting Techniques, 2022-2032
Figure 129: Middle East & Africa Inductor Market Share and BPS Analysis by Application– 2022 & 2032
Figure 130: Middle East & Africa Inductor Market Y-o-Y Growth Projections by Application, 2022-2032
Figure 131: Middle East & Africa Inductor Market Attractiveness By Application, 2022-2032
Need specific information?
Request CustomizationExplore Industrial Automation Insights
View Reports