Cell and Gene Therapy Clinical Trial Market
Increasing investments in cell and gene therapy promises significant opportunity for the cell and gene therapy market: Opportunities ahead
Cell and Gene Therapy Clinical Trial Market by Phase, Indication & Region – Forecast 2022–2032
Cell and Gene Therapy Clinical Trial Market Outlook
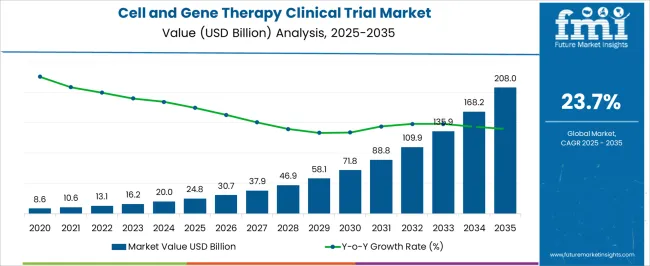
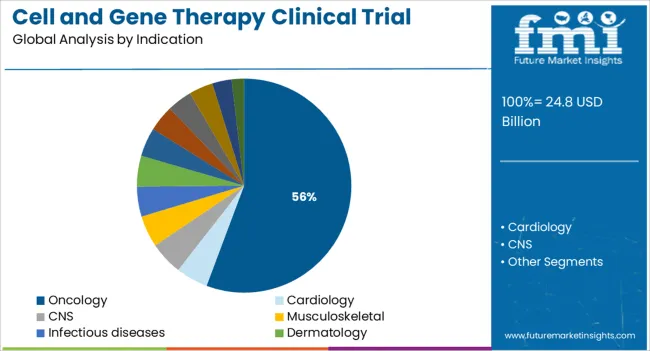
Newly released Cell and Gene Therapy Clinical Trial Market analysis report by Future Market Insights shows that global sales of the Cell and Gene Therapy Clinical Trial Market in 2021 were held at US$ 10.7 Bn. With a CAGR of 24.9% during 2022 - 2032, the market is projected to reach US$ 119.3 Bn by 2032. Oncology is expected to be the highest revenue-generating segment, projected to grow at a CAGR of over 27.9% during 2022 – 2032.
Attribute |
Details |
Global Cell and Gene Therapy Clinical Trial Market (2022) |
US$ 13.1 Bn |
Global Cell and Gene Therapy Clinical Trial Market (2032) |
US$ 119.3 Bn |
Global Cell and Gene Therapy Clinical Trial Market CAGR (2022 - 2032) |
24.9% |
U.S. Cell and Gene Therapy Clinical Trial Market CAGR (2022 - 2032) |
23.7% |
Key Companies Profiled |
|
Let us know your requirement to get
100% FREE customization
Revenue of Cell and Gene Therapy Clinical Trial Market from 2015 to 2021 Compared to Demand Outlook for 2022 to 2032
As per the Cell and Gene Therapy Clinical Trial Market research by Future Market Insights - a market research and competitive intelligence provider, historically, from 2015 to 2021, market value of the Cell and Gene Therapy Clinical Trial Market increased at around 21.9% CAGR.
Gene therapy is a revolutionary treatment method that includes inserting one or more corrected genes into patient cells that have been developed in the lab to repair disorders.
As an alternate therapy option or tailored medicine, CGT holds significant potential. Furthermore, as compared with small-molecule medicines, they have a higher success rate as cell and gene therapy is centered on the diagnosis of definite disease instead of macro-level like small-molecule treatment.
Cell and gene therapy is a promising treatment option for a variety of ailments, including cancer and rare genetic disorders. It exemplifies the life sciences industry's new wave of innovation. Even though just a few early medicines have received FDA clearance in the United States, there are numerous potential therapies under development around the world. Increasing funding, investments in research and development, and product launches are boosting the market growth.
Other factors influencing gene therapy market growth include increased research spending, rising cancer incidence, speedier product approvals, and increased commercialization of cell and gene treatments.
Which Factors are Propelling Cell and Gene Therapy Clinical Trial Demand?
The global market is being transformed by the development of efficient and selective gene targeting and delivery techniques, as well as the growing knowledge of disease path mechanisms. The most common indications are currently human cancers and monogenic disorders.
A rise in the number of genetic defects and cancers, as well as explicit gene modification techniques and greater financial support for gene therapy in clinical trials, are the key trends.
However, cell and gene therapy developers face challenges in several key areas, including enabling patient access, managing supply chain and manufacturing operations, and developing a healthcare provider network, as with any new and innovative disruptive technology. The high operational expenses associated with cell and gene therapy manufacturing, on the oth
Find your sweet spots for generating winning opportunities in this market.
Talk to AnalystHow is the market for cell and gene therapy projected to develop as the prevalence of cardiovascular disease and cancer rises?
Cell treatment is centered on ailments at the cellular level, which includes the restoration of a specific cell population or using cells as therapeutic carriers. Gene therapy seeks to alter the course of numerous inherited and acquired issues at the genetic level. The global cell and gene therapy market is projected to grow due to the rising prevalence of cardiovascular diseases and the introduction of effective recommendations.
However, a number of development difficulties, including safety and efficacy concerns, lengthy clinical trial procedures, stringent regulatory environment, and high costs, are expected to limit cell and gene therapy acceptability, thus choking market expansion.
Region-wise Analysis
Which Region is projected to Offer the Largest Opportunity for the Cell and Gene Therapy Clinical Trial Market?
North America held the highest market of around 50% in 2021. Increased prevalence of chronic illnesses, surged investment in research and development activities, and active engagement and support from the government have been the prominent drivers of the gene therapy market.
Furthermore, in the United States, the regulatory approval procedure is improving and becoming more beneficial for CGT vendors. To speed up the approval process, the FDA has given CGTs orphan drug status, breakthrough designation, accelerated approvals, and RMAT designations.
High economic status and high healthcare spending drive the CGT market in North America. Sponsorship and financial funding for CGT products come mostly from National Health Institutes, companies, academic institutes, and hospitals.
Rising medical tourism, a greater emphasis on healthcare, the incidence of uncommon chronic illnesses, and increased research and development activities in East Asia and South Asia are projected to fuel demand for gene treatments throughout the forecast period.
A unified Market Research Subscription Platform, built for today's disparate research needs.
Country-wise Analysis
U.S. Cell and Gene Therapy Clinical Trial Market Analysis
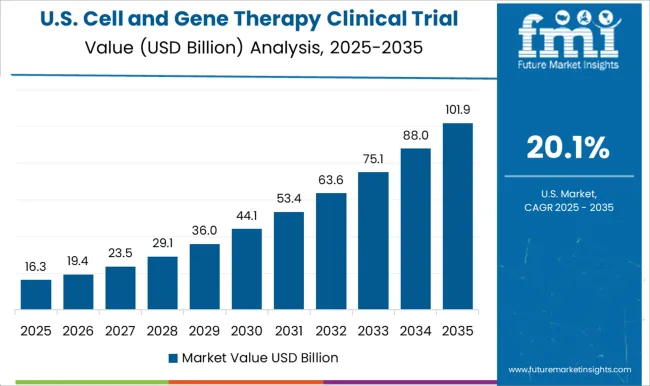
The United States is expected to account for the largest market of US$ 44.7 Bn by 2032. It holds a dominant position in the global cell and gene therapy market, owing to the high prevalence of genetic disorders.
Demand for cell and gene therapy is also expected to rise as research and development activities expand. Several novel cell and gene therapies are being developed for a variety of ailments, with the majority of them aimed at cancer and cardiovascular disease treatments. These medications either are in clinical development or are awaiting FDA approval.
U.K. Cell and Gene Therapy Clinical Trial Market Analysis
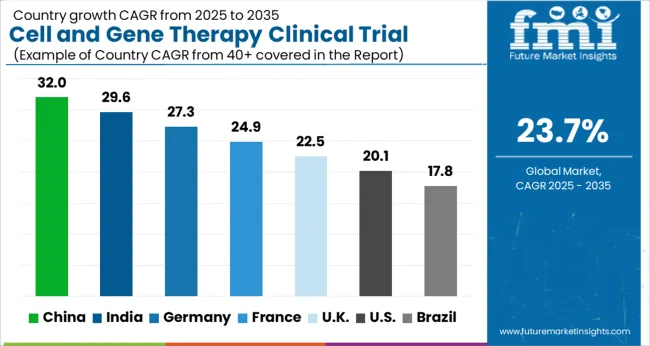
The market in the U.K. is projected to reach US$ 4 Bn by 2032. Growing at a CAGR of 24.3% during 2022 – 2032, the market in the country is expected to gross an absolute dollar opportunity of US$ 3.5 Bn.
Japan Cell and Gene Therapy Clinical Trial Market Analysis
The market in Japan is expected to grow at a CAGR of 32.4% during the forecast period to reach a valuation of US$ 7.4 Bn by 2032. During 2022 – 2032, the market is expected to gross an absolute dollar opportunity of US$ 6.9 Bn.
South Korea Cell and Gene Therapy Clinical Trial Market Analysis
The market in South Korea is expected to reach US$ 2.8 Bn by 2032. The market is expected to grow with a CAGR of 25.8% during 2022 – 2032, with an absolute dollar opportunity of US$ 2.5 Bn.
Category-wise Insights
Why is Oncology projected to witness the fastest growth among Cell and Gene Therapy Clinical Trial Indications?
The market through Oncology indication is forecasted to grow at a CAGR of 27.9% during 2022-2032. Oncology has been a focus of considerable study for gene therapy processes and approaches. More than 60% of ongoing gene therapy clinical studies are aimed at cancer. Because of the significant frequency of cancer disorders, particularly in poor and middle-income nations, the category is projected to rise at a promising rate.
In addition, the success of CAR-T cell treatments in the treatment of hematological malignancies has paved the path for increased investment in CGTs in oncology. Biotech and pharmaceutical corporations are both investing in this method to treat various forms of cancer at a global scale.
Competitive Analysis
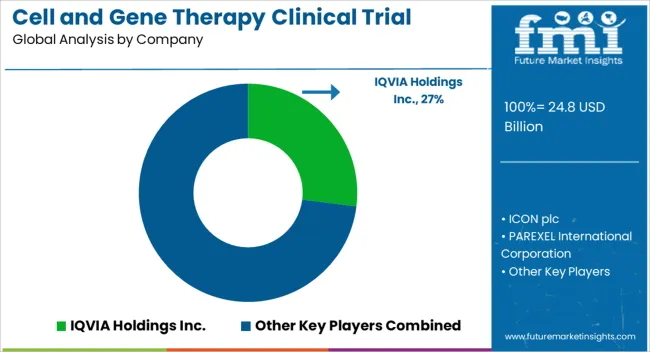
Some of the key players in the cell and gene therapy market include IQVIA Holdings Inc., Medpace Holdings Inc., Gilead Sciences, Dendreon, Vericel, Novartis, and Amgen.
Some of the recent developments of key Cell and Gene Therapy Clinical Trial providers are as follows:
- In March 2020, Rexenbio and Ultragenyx Pharmaceutical collaborated on the use of the NAV technology platform.
- In January 2020, Hema Care Corporation, a major operator in the manufacture of human-derived cellular products for the cell therapy market, was acquired by Charles River Laboratory in US$ 380 million.
Similarly, recent developments related to companies Cell and Gene Therapy Clinical Trial services have been tracked by the team at Future Market Insights, which are available in the full report.
Market Segments Covered in Cell and Gene Therapy Clinical Trial Market Analysis
By Phase:
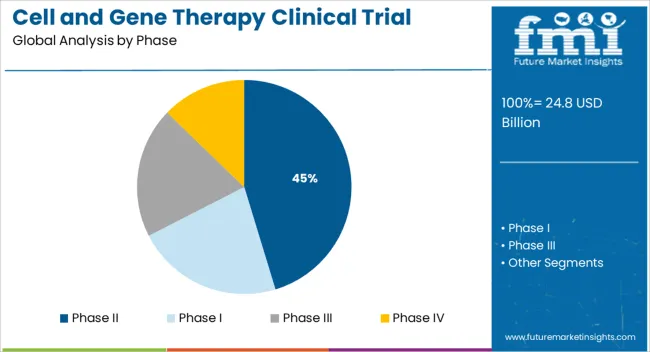
- Phase I
- Phase II
- Phase III
By Indication:
- Oncology
- Cardiology
- CNS
- Musculoskeletal
- Infectious diseases
- Dermatology
- Endocrine
- Metabolic
- Genetic
- Immunology & Inflammation
- Ophthalmology
- Hematology
- Gastroenterology
- Other Indications
By Region:
- North America
- Latin America
- Europe
- APAC
- MEA
Frequently Asked Questions
The global market is worth more than US$ 10.7 Bn at present.
The value of the Cell and Gene Therapy Clinical Trial Market is projected to increase at a CAGR of around 24.9% during 2022 – 2032.
The value of the Cell and Gene Therapy Clinical Trial Market increased at a CAGR of around 21.9% during 2015 – 2021.
The development of efficient and selective gene targeting and delivery techniques, as well as a better understanding of disease path mechanisms are bolstering the growth.
The market for Cell and Gene Therapy Clinical Trial Market in China is projected to expand at a CAGR of around 25.4% during 2022 – 2032.
While the market in South Korea is expected to grow at nearly 25.8%, the market in Japan is projected to register a CAGR of nearly 32.4% during 2022 - 2032.
Table of Content
1. Executive Summary
1.1. Global Market Outlook
1.2. Demand-side Trends
1.3. Supply-side Trends
1.4. Technology Roadmap Analysis
1.5. Analysis and Recommendations
2. Market Overview
2.1. Market Coverage / Taxonomy
2.2. Market Definition / Scope / Limitations
3. Market Background
3.1. Market Dynamics
3.1.1. Drivers
3.1.2. Restraints
3.1.3. Opportunity
3.1.4. Trends
3.2. Scenario Forecast
3.2.1. Demand in Optimistic Scenario
3.2.2. Demand in Likely Scenario
3.2.3. Demand in Conservative Scenario
3.3. Opportunity Map Analysis
3.4. Investment Feasibility Matrix
3.5. PESTLE and Porter’s Analysis
3.6. Regulatory Landscape
3.6.1. By Key Regions
3.6.2. By Key Countries
3.7. Regional Parent Market Outlook
4. Global Market Analysis 2017-2021 and Forecast, 2022-2032
4.1. Historical Market Size Value (US$ Mn) Analysis, 2017-2021
4.2. Current and Future Market Size Value (US$ Mn) Projections, 2022-2032
4.2.1. Y-o-Y Growth Trend Analysis
4.2.2. Absolute $ Opportunity Analysis
5. Global Market Analysis 2017-2021 and Forecast 2022-2032, By Phase
5.1. Introduction / Key Findings
5.2. Historical Market Size Value (US$ Mn) Analysis By Phase, 2017-2021
5.3. Current and Future Market Size Value (US$ Mn) Analysis and Forecast By Phase, 2022-2032
5.3.1. Phase I
5.3.2. Phase II
5.3.3. Phase III
5.3.4. Phase IV
5.4. Y-o-Y Growth Trend Analysis By Phase, 2017-2021
5.5. Absolute $ Opportunity Analysis By Phase, 2022-2032
6. Global Market Analysis 2017-2021 and Forecast 2022-2032, By Indication
6.1. Introduction / Key Findings
6.2. Historical Market Size Value (US$ Mn) Analysis By Indication, 2017-2021
6.3. Current and Future Market Size Value (US$ Mn) Analysis and Forecast By Indication, 2022-2032
6.3.1. Oncology
6.3.2. Cardiology
6.3.3. CNS
6.3.4. Musculoskeletal
6.3.5. Infectious diseases
6.3.6. Dermatology
6.3.7. Endocrine, metabolic, genetic
6.3.8. Immunology & inflammation
6.3.9. Ophthalmology
6.3.10. Hematology
6.3.11. Gastroenterology
6.3.12. Other Indications
6.4. Y-o-Y Growth Trend Analysis By Indication, 2017-2021
6.5. Absolute $ Opportunity Analysis By Indication, 2022-2032
7. Global Market Analysis 2017-2021 and Forecast 2022-2032, By Region
7.1. Introduction
7.2. Historical Market Size Value (US$ Mn) Analysis By Region, 2017-2021
7.3. Current Market Size Value (US$ Mn) Analysis and Forecast By Region, 2022-2032
7.3.1. North America
7.3.2. Latin America
7.3.3. Europe
7.3.4. Asia Pacific
7.3.5. Middle East and Africa
7.4. Market Attractiveness Analysis By Region
8. North America Market Analysis 2017-2021 and Forecast 2022-2032, By Country
8.1. Historical Market Size Value (US$ Mn) Trend Analysis By Market Taxonomy, 2017-2021
8.2. Market Size Value (US$ Mn) Forecast By Market Taxonomy, 2022-2032
8.2.1. By Country
8.2.1.1. U.S.
8.2.1.2. Canada
8.2.2. By Phase
8.2.3. By Indication
8.3. Market Attractiveness Analysis
8.3.1. By Country
8.3.2. By Phase
8.3.3. By Indication
8.4. Key Takeaways
9. Latin America Market Analysis 2017-2021 and Forecast 2022-2032, By Country
9.1. Historical Market Size Value (US$ Mn) Trend Analysis By Market Taxonomy, 2017-2021
9.2. Market Size Value (US$ Mn) Forecast By Market Taxonomy, 2022-2032
9.2.1. By Country
9.2.1.1. Brazil
9.2.1.2. Mexico
9.2.1.3. Rest of Latin America
9.2.2. By Phase
9.2.3. By Indication
9.3. Market Attractiveness Analysis
9.3.1. By Country
9.3.2. By Phase
9.3.3. By Indication
9.4. Key Takeaways
10. Europe Market Analysis 2017-2021 and Forecast 2022-2032, By Country
10.1. Historical Market Size Value (US$ Mn) Trend Analysis By Market Taxonomy, 2017-2021
10.2. Market Size Value (US$ Mn) Forecast By Market Taxonomy, 2022-2032
10.2.1. By Country
10.2.1.1. Germany
10.2.1.2. Italy
10.2.1.3. France
10.2.1.4. U.K.
10.2.1.5. Russia
10.2.1.6. BENELUX
10.2.1.7. Rest of Europe
10.2.2. By Phase
10.2.3. By Indication
10.3. Market Attractiveness Analysis
10.3.1. By Country
10.3.2. By Phase
10.3.3. By Indication
10.4. Key Takeaways
11. Asia Pacific Market Analysis 2017-2021 and Forecast 2022-2032, By Country
11.1. Historical Market Size Value (US$ Mn) Trend Analysis By Market Taxonomy, 2017-2021
11.2. Market Size Value (US$ Mn) Forecast By Market Taxonomy, 2022-2032
11.2.1. By Country
11.2.1.1. China
11.2.1.2. Japan
11.2.1.3. South Korea
11.2.1.4. Rest of Asia Pacific
11.2.2. By Phase
11.2.3. By Indication
11.3. Market Attractiveness Analysis
11.3.1. By Country
11.3.2. By Phase
11.3.3. By Indication
11.4. Key Takeaways
12. Middle East and Africa Market Analysis 2017-2021 and Forecast 2022-2032, By Country
12.1. Historical Market Size Value (US$ Mn) Trend Analysis By Market Taxonomy, 2017-2021
12.2. Market Size Value (US$ Mn) Forecast By Market Taxonomy, 2022-2032
12.2.1. By Country
12.2.1.1. GCC Countries
12.2.1.2. South Africa
12.2.1.3. Turkey
12.2.1.4. Rest of Middle East and Africa
12.2.2. By Phase
12.2.3. By Indication
12.3. Market Attractiveness Analysis
12.3.1. By Country
12.3.2. By Phase
12.3.3. By Indication
12.4. Key Takeaways
13. Key Countries Market Analysis
13.1. U.S.
13.1.1. Pricing Analysis
13.1.2. Market Share Analysis, 2021
13.1.2.1. By Phase
13.1.2.2. By Indication
13.2. Canada
13.2.1. Pricing Analysis
13.2.2. Market Share Analysis, 2021
13.2.2.1. By Phase
13.2.2.2. By Indication
13.3. Brazil
13.3.1. Pricing Analysis
13.3.2. Market Share Analysis, 2021
13.3.2.1. By Phase
13.3.2.2. By Indication
13.4. Mexico
13.4.1. Pricing Analysis
13.4.2. Market Share Analysis, 2021
13.4.2.1. By Phase
13.4.2.2. By Indication
13.5. Germany
13.5.1. Pricing Analysis
13.5.2. Market Share Analysis, 2021
13.5.2.1. By Phase
13.5.2.2. By Indication
13.6. Italy
13.6.1. Pricing Analysis
13.6.2. Market Share Analysis, 2021
13.6.2.1. By Phase
13.6.2.2. By Indication
13.7. France
13.7.1. Pricing Analysis
13.7.2. Market Share Analysis, 2021
13.7.2.1. By Phase
13.7.2.2. By Indication
13.8. U.K.
13.8.1. Pricing Analysis
13.8.2. Market Share Analysis, 2021
13.8.2.1. By Phase
13.8.2.2. By Indication
13.9. Russia
13.9.1. Pricing Analysis
13.9.2. Market Share Analysis, 2021
13.9.2.1. By Phase
13.9.2.2. By Indication
13.10. BENELUX
13.10.1. Pricing Analysis
13.10.2. Market Share Analysis, 2021
13.10.2.1. By Phase
13.10.2.2. By Indication
13.11. China
13.11.1. Pricing Analysis
13.11.2. Market Share Analysis, 2021
13.11.2.1. By Phase
13.11.2.2. By Indication
13.12. Japan
13.12.1. Pricing Analysis
13.12.2. Market Share Analysis, 2021
13.12.2.1. By Phase
13.12.2.2. By Indication
13.13. South Korea
13.13.1. Pricing Analysis
13.13.2. Market Share Analysis, 2021
13.13.2.1. By Phase
13.13.2.2. By Indication
13.14. GCC Countries
13.14.1. Pricing Analysis
13.14.2. Market Share Analysis, 2021
13.14.2.1. By Phase
13.14.2.2. By Indication
13.15. South Africa
13.15.1. Pricing Analysis
13.15.2. Market Share Analysis, 2021
13.15.2.1. By Phase
13.15.2.2. By Indication
13.16. Turkey
13.16.1. Pricing Analysis
13.16.2. Market Share Analysis, 2021
13.16.2.1. By Phase
13.16.2.2. By Indication
14. Market Structure Analysis
14.1. Competition Dashboard
14.2. Competition Benchmarking
14.3. Market Share Analysis of Top Players
14.3.1. By Regional
14.3.2. By Phase
14.3.3. By Indication
15. Competition Analysis
15.1. Competition Deep Dive
15.1.1. ICON plc
15.1.1.1. Overview
15.1.1.2. Product Portfolio
15.1.1.3. Profitability by Market Segments
15.1.1.4. Sales Footprint
15.1.1.5. Strategy Overview
15.1.1.5.1. Marketing Strategy
15.1.2. IQVIA Holdings Inc.
15.1.2.1. Overview
15.1.2.2. Product Portfolio
15.1.2.3. Profitability by Market Segments
15.1.2.4. Sales Footprint
15.1.2.5. Strategy Overview
15.1.2.5.1. Marketing Strategy
15.1.3. PAREXEL International Corporation
15.1.3.1. Overview
15.1.3.2. Product Portfolio
15.1.3.3. Profitability by Market Segments
15.1.3.4. Sales Footprint
15.1.3.5. Strategy Overview
15.1.3.5.1. Marketing Strategy
15.1.4. Covance Inc.
15.1.4.1. Overview
15.1.4.2. Product Portfolio
15.1.4.3. Profitability by Market Segments
15.1.4.4. Sales Footprint
15.1.4.5. Strategy Overview
15.1.4.5.1. Marketing Strategy
15.1.5. Syneos Health
15.1.5.1. Overview
15.1.5.2. Product Portfolio
15.1.5.3. Profitability by Market Segments
15.1.5.4. Sales Footprint
15.1.5.5. Strategy Overview
15.1.5.5.1. Marketing Strategy
15.1.6. CHARLES RIVER LABORATORIES INTERNATIONAL, INC.
15.1.6.1. Overview
15.1.6.2. Product Portfolio
15.1.6.3. Profitability by Market Segments
15.1.6.4. Sales Footprint
15.1.6.5. Strategy Overview
15.1.6.5.1. Marketing Strategy
15.1.7. MEDPACE HOLDINGS, INC.
15.1.7.1. Overview
15.1.7.2. Product Portfolio
15.1.7.3. Profitability by Market Segments
15.1.7.4. Sales Footprint
15.1.7.5. Strategy Overview
15.1.7.5.1. Marketing Strategy
15.1.8. Novartis
15.1.8.1. Overview
15.1.8.2. Product Portfolio
15.1.8.3. Profitability by Market Segments
15.1.8.4. Sales Footprint
15.1.8.5. Strategy Overview
15.1.8.5.1. Marketing Strategy
15.1.9. Novotech
15.1.9.1. Overview
15.1.9.2. Product Portfolio
15.1.9.3. Profitability by Market Segments
15.1.9.4. Sales Footprint
15.1.9.5. Strategy Overview
15.1.9.5.1. Marketing Strategy
15.1.10. Veristat, LLC
15.1.10.1. Overview
15.1.10.2. Product Portfolio
15.1.10.3. Profitability by Market Segments
15.1.10.4. Sales Footprint
15.1.10.5. Strategy Overview
15.1.10.5.1. Marketing Strategy
16. Assumptions & Acronyms Used
17. Research Methodology
Let us know your requirement to get
100% FREE customization
List of Tables
Table 1: Global Market Value (US$ Mn) Forecast by Region, 2017-2032
Table 2: Global Market Value (US$ Mn) Forecast by Phase, 2017-2032
Table 3: Global Market Value (US$ Mn) Forecast by Indication, 2017-2032
Table 4: North America Market Value (US$ Mn) Forecast by Country, 2017-2032
Table 5: North America Market Value (US$ Mn) Forecast by Phase, 2017-2032
Table 6: North America Market Value (US$ Mn) Forecast by Indication, 2017-2032
Table 7: Latin America Market Value (US$ Mn) Forecast by Country, 2017-2032
Table 8: Latin America Market Value (US$ Mn) Forecast by Phase, 2017-2032
Table 9: Latin America Market Value (US$ Mn) Forecast by Indication, 2017-2032
Table 10: Europe Market Value (US$ Mn) Forecast by Country, 2017-2032
Table 11: Europe Market Value (US$ Mn) Forecast by Phase, 2017-2032
Table 12: Europe Market Value (US$ Mn) Forecast by Indication, 2017-2032
Table 13: Asia Pacific Market Value (US$ Mn) Forecast by Country, 2017-2032
Table 14: Asia Pacific Market Value (US$ Mn) Forecast by Phase, 2017-2032
Table 15: Asia Pacific Market Value (US$ Mn) Forecast by Indication, 2017-2032
Table 16: Middle East and Africa Market Value (US$ Mn) Forecast by Country, 2017-2032
Table 17: Middle East and Africa Market Value (US$ Mn) Forecast by Phase, 2017-2032
Table 18: Middle East and Africa Market Value (US$ Mn) Forecast by Indication, 2017-2032
Find your sweet spots for generating winning opportunities in this market.
Talk to AnalystList of Charts
Figure 1: Global Market Value (US$ Mn) by Phase, 2022-2032
Figure 2: Global Market Value (US$ Mn) by Indication, 2022-2032
Figure 3: Global Market Value (US$ Mn) by Region, 2022-2032
Figure 4: Global Market Value (US$ Mn) Analysis by Region, 2017-2032
Figure 5: Global Market Value Share (%) and BPS Analysis by Region, 2022-2032
Figure 6: Global Market Y-o-Y Growth (%) Projections by Region, 2022-2032
Figure 7: Global Market Value (US$ Mn) Analysis by Phase, 2017-2032
Figure 8: Global Market Value Share (%) and BPS Analysis by Phase, 2022-2032
Figure 9: Global Market Y-o-Y Growth (%) Projections by Phase, 2022-2032
Figure 10: Global Market Value (US$ Mn) Analysis by Indication, 2017-2032
Figure 11: Global Market Value Share (%) and BPS Analysis by Indication, 2022-2032
Figure 12: Global Market Y-o-Y Growth (%) Projections by Indication, 2022-2032
Figure 13: Global Market Attractiveness by Phase, 2022-2032
Figure 14: Global Market Attractiveness by Indication, 2022-2032
Figure 15: Global Market Attractiveness by Region, 2022-2032
Figure 16: North America Market Value (US$ Mn) by Phase, 2022-2032
Figure 17: North America Market Value (US$ Mn) by Indication, 2022-2032
Figure 18: North America Market Value (US$ Mn) by Country, 2022-2032
Figure 19: North America Market Value (US$ Mn) Analysis by Country, 2017-2032
Figure 20: North America Market Value Share (%) and BPS Analysis by Country, 2022-2032
Figure 21: North America Market Y-o-Y Growth (%) Projections by Country, 2022-2032
Figure 22: North America Market Value (US$ Mn) Analysis by Phase, 2017-2032
Figure 23: North America Market Value Share (%) and BPS Analysis by Phase, 2022-2032
Figure 24: North America Market Y-o-Y Growth (%) Projections by Phase, 2022-2032
Figure 25: North America Market Value (US$ Mn) Analysis by Indication, 2017-2032
Figure 26: North America Market Value Share (%) and BPS Analysis by Indication, 2022-2032
Figure 27: North America Market Y-o-Y Growth (%) Projections by Indication, 2022-2032
Figure 28: North America Market Attractiveness by Phase, 2022-2032
Figure 29: North America Market Attractiveness by Indication, 2022-2032
Figure 30: North America Market Attractiveness by Country, 2022-2032
Figure 31: Latin America Market Value (US$ Mn) by Phase, 2022-2032
Figure 32: Latin America Market Value (US$ Mn) by Indication, 2022-2032
Figure 33: Latin America Market Value (US$ Mn) by Country, 2022-2032
Figure 34: Latin America Market Value (US$ Mn) Analysis by Country, 2017-2032
Figure 35: Latin America Market Value Share (%) and BPS Analysis by Country, 2022-2032
Figure 36: Latin America Market Y-o-Y Growth (%) Projections by Country, 2022-2032
Figure 37: Latin America Market Value (US$ Mn) Analysis by Phase, 2017-2032
Figure 38: Latin America Market Value Share (%) and BPS Analysis by Phase, 2022-2032
Figure 39: Latin America Market Y-o-Y Growth (%) Projections by Phase, 2022-2032
Figure 40: Latin America Market Value (US$ Mn) Analysis by Indication, 2017-2032
Figure 41: Latin America Market Value Share (%) and BPS Analysis by Indication, 2022-2032
Figure 42: Latin America Market Y-o-Y Growth (%) Projections by Indication, 2022-2032
Figure 43: Latin America Market Attractiveness by Phase, 2022-2032
Figure 44: Latin America Market Attractiveness by Indication, 2022-2032
Figure 45: Latin America Market Attractiveness by Country, 2022-2032
Figure 46: Europe Market Value (US$ Mn) by Phase, 2022-2032
Figure 47: Europe Market Value (US$ Mn) by Indication, 2022-2032
Figure 48: Europe Market Value (US$ Mn) by Country, 2022-2032
Figure 49: Europe Market Value (US$ Mn) Analysis by Country, 2017-2032
Figure 50: Europe Market Value Share (%) and BPS Analysis by Country, 2022-2032
Figure 51: Europe Market Y-o-Y Growth (%) Projections by Country, 2022-2032
Figure 52: Europe Market Value (US$ Mn) Analysis by Phase, 2017-2032
Figure 53: Europe Market Value Share (%) and BPS Analysis by Phase, 2022-2032
Figure 54: Europe Market Y-o-Y Growth (%) Projections by Phase, 2022-2032
Figure 55: Europe Market Value (US$ Mn) Analysis by Indication, 2017-2032
Figure 56: Europe Market Value Share (%) and BPS Analysis by Indication, 2022-2032
Figure 57: Europe Market Y-o-Y Growth (%) Projections by Indication, 2022-2032
Figure 58: Europe Market Attractiveness by Phase, 2022-2032
Figure 59: Europe Market Attractiveness by Indication, 2022-2032
Figure 60: Europe Market Attractiveness by Country, 2022-2032
Figure 61: Asia Pacific Market Value (US$ Mn) by Phase, 2022-2032
Figure 62: Asia Pacific Market Value (US$ Mn) by Indication, 2022-2032
Figure 63: Asia Pacific Market Value (US$ Mn) by Country, 2022-2032
Figure 64: Asia Pacific Market Value (US$ Mn) Analysis by Country, 2017-2032
Figure 65: Asia Pacific Market Value Share (%) and BPS Analysis by Country, 2022-2032
Figure 66: Asia Pacific Market Y-o-Y Growth (%) Projections by Country, 2022-2032
Figure 67: Asia Pacific Market Value (US$ Mn) Analysis by Phase, 2017-2032
Figure 68: Asia Pacific Market Value Share (%) and BPS Analysis by Phase, 2022-2032
Figure 69: Asia Pacific Market Y-o-Y Growth (%) Projections by Phase, 2022-2032
Figure 70: Asia Pacific Market Value (US$ Mn) Analysis by Indication, 2017-2032
Figure 71: Asia Pacific Market Value Share (%) and BPS Analysis by Indication, 2022-2032
Figure 72: Asia Pacific Market Y-o-Y Growth (%) Projections by Indication, 2022-2032
Figure 73: Asia Pacific Market Attractiveness by Phase, 2022-2032
Figure 74: Asia Pacific Market Attractiveness by Indication, 2022-2032
Figure 75: Asia Pacific Market Attractiveness by Country, 2022-2032
Figure 76: Middle East and Africa Market Value (US$ Mn) by Phase, 2022-2032
Figure 77: Middle East and Africa Market Value (US$ Mn) by Indication, 2022-2032
Figure 78: Middle East and Africa Market Value (US$ Mn) by Country, 2022-2032
Figure 79: Middle East and Africa Market Value (US$ Mn) Analysis by Country, 2017-2032
Figure 80: Middle East and Africa Market Value Share (%) and BPS Analysis by Country, 2022-2032
Figure 81: Middle East and Africa Market Y-o-Y Growth (%) Projections by Country, 2022-2032
Figure 82: Middle East and Africa Market Value (US$ Mn) Analysis by Phase, 2017-2032
Figure 83: Middle East and Africa Market Value Share (%) and BPS Analysis by Phase, 2022-2032
Figure 84: Middle East and Africa Market Y-o-Y Growth (%) Projections by Phase, 2022-2032
Figure 85: Middle East and Africa Market Value (US$ Mn) Analysis by Indication, 2017-2032
Figure 86: Middle East and Africa Market Value Share (%) and BPS Analysis by Indication, 2022-2032
Figure 87: Middle East and Africa Market Y-o-Y Growth (%) Projections by Indication, 2022-2032
Figure 88: Middle East and Africa Market Attractiveness by Phase, 2022-2032
Figure 89: Middle East and Africa Market Attractiveness by Indication, 2022-2032
Figure 90: Middle East and Africa Market Attractiveness by Country, 2022-2032
Need specific information?
Request CustomizationExplore Healthcare Insights
View Reports