The Mammalian Transient Protein Expression market is experiencing significant growth driven by its critical role in rapid protein production for research, therapeutic development, and biopharmaceutical applications. The future outlook of this market is shaped by the increasing demand for high-quality recombinant proteins, accelerated drug discovery processes, and the growing focus on personalized medicine. Continuous advancements in vector design, cell line engineering, and expression technologies have enhanced protein yield, purity, and functional activity, supporting market expansion.
Rising investments in biopharmaceutical research, contract research organizations, and bio-production facilities are further bolstering demand. Additionally, the increasing adoption of mammalian systems over microbial platforms for complex protein expression ensures better post-translational modifications and biologically relevant products.
The market is also influenced by the growing need for flexible and scalable protein production platforms that can meet both small-scale research requirements and large-scale commercial applications As pharmaceutical and biotechnology sectors continue to prioritize speed, efficiency, and reproducibility in protein production, the Mammalian Transient Protein Expression market is expected to witness sustained growth across global regions.
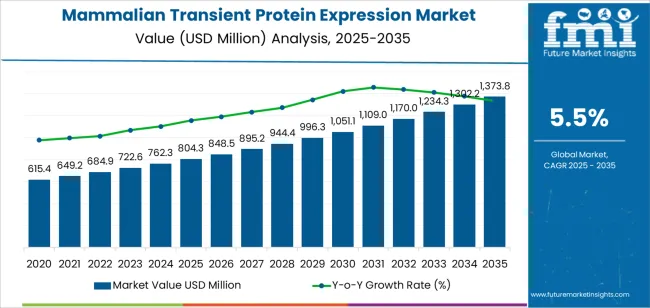
| Metric | Value |
|---|---|
| Mammalian Transient Protein Expression Market Estimated Value in (2025 E) | USD 804.3 million |
| Mammalian Transient Protein Expression Market Forecast Value in (2035 F) | USD 1373.8 million |
| Forecast CAGR (2025 to 2035) | 5.5% |
The market is segmented by Product, Application, and End User and region. By Product, the market is divided into Expression Vectors, Instruments, Cell Lines, and Reagents And Consumables. In terms of Application, the market is classified into Bio-Production, Functional Cell-Based Assays, Academic Research, and Others. Based on End User, the market is segmented into Contract Research Organizations, Biopharmaceutical Companies, and Academic & Research Institutes. Regionally, the market is classified into North America, Latin America, Western Europe, Eastern Europe, Balkan & Baltic Countries, Russia & Belarus, Central Asia, East Asia, South Asia & Pacific, and the Middle East & Africa.
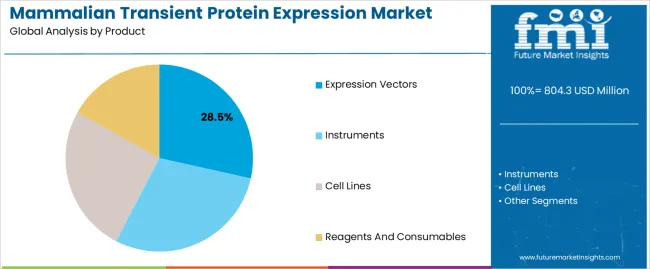
The expression vectors segment is projected to hold 28.50% of the Mammalian Transient Protein Expression market revenue share in 2025, making it the leading product type. This dominance is driven by the versatility and efficiency of vectors in delivering target genes into mammalian cells, enabling high-yield protein expression in a short timeframe.
Enhanced vector designs incorporating strong promoters, selection markers, and replication elements have improved transfection efficiency and protein production. The adoption of optimized vectors allows for rapid and reproducible results in research and biopharmaceutical production, supporting both exploratory studies and preclinical applications.
The segment’s growth is further reinforced by the increasing demand for scalable and customizable expression systems that can accommodate various protein targets while maintaining functionality Additionally, the robust development of transient expression protocols using these vectors has increased productivity, reduced timelines, and enhanced cost-efficiency, solidifying their dominant position in the market.
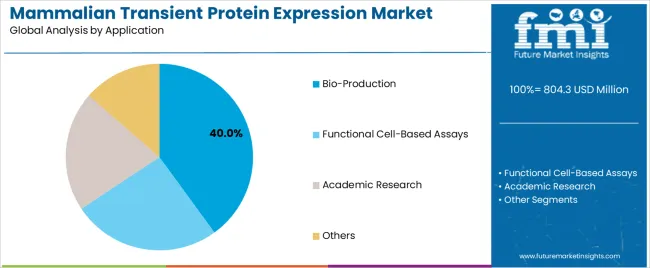
The bio-production application segment is expected to account for 40.00% of the Mammalian Transient Protein Expression market revenue share in 2025, positioning it as the leading application area. Growth in this segment is driven by the rising need for rapid production of therapeutic proteins, antibodies, and complex biologics to support drug development pipelines.
The use of transient expression systems enables flexible and scalable production of proteins without the time-intensive process of generating stable cell lines, making them ideal for preclinical studies and early-stage biomanufacturing. The segment’s expansion is further supported by increasing investments in bioprocessing facilities and contract manufacturing services that rely on efficient protein production platforms.
Continuous improvements in mammalian expression systems, including higher transfection efficiencies, enhanced vector designs, and optimized culture conditions, have significantly increased protein yield and quality Additionally, the growing focus on biologics and personalized therapies continues to drive the adoption of bio-production applications, reinforcing its dominant revenue share in the market.
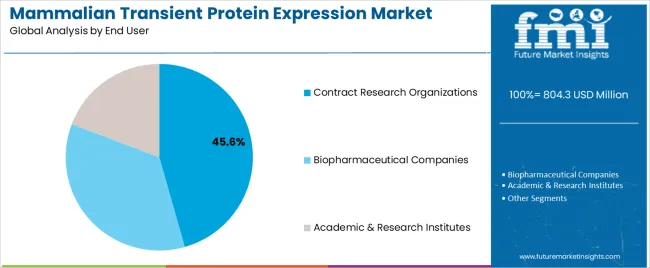
The contract research organizations end user segment is anticipated to hold 45.60% of the Mammalian Transient Protein Expression market revenue in 2025, establishing it as the leading end-use segment. The growth of this segment is influenced by the increasing reliance on external research and bioproduction services by pharmaceutical and biotechnology companies to accelerate protein discovery, production, and testing processes.
Contract research organizations leverage transient expression platforms to provide rapid and scalable protein production, supporting clients with preclinical research, biologics development, and therapeutic protein supply. The segment benefits from the flexibility, cost-effectiveness, and time efficiency offered by transient protein expression systems, allowing contract research organizations to serve a wide range of clients with varying project scopes.
Additionally, the increasing outsourcing trends in biopharmaceutical R&D and the need for specialized expertise in protein expression have strengthened the market share of contract research organizations Their pivotal role in bridging research and commercial production continues to drive the adoption of transient protein expression technologies, maintaining their dominant position in the market.
The table below offers a comparative analysis of the Compound Annual Growth Rate (CAGR) fluctuations for the global mammalian transient protein expression market between the base year (2025) and the current year (2025) over six months.
This examination uncovers significant changes in market performance and highlights trends in revenue generation, giving stakeholders valuable insights into the market’s growth trajectory throughout the year. The first half (H1) encompasses January through June, while the second half (H2) covers July through December.
The first half (H1) is the period from January to June, and the second half (H2) is July to December. In the first half (H1) of the decade from 2025 to 2035, the business is predicted to surge at a CAGR of 6.2%, followed by a slightly lower growth rate of 5.9% in the second half (H2) of the same decade.
| Particular | Value CAGR |
|---|---|
| H1 | 6.2% (2025 to 2035) |
| H2 | 5.9% (2025 to 2035) |
| H1 | 5.5% (2025 to 2035) |
| H2 | 5.0% (2025 to 2035) |
Moving into the subsequent period, from H1 2025 to H2 2035, the CAGR is projected to decrease slightly to 5.5% in the first half and remain relatively moderate at 5.0% in the second half. In the first half (H1) the market witnessed a decrease of 70 BPS while in the second half (H2), the market witnessed a decrease of 90 BPS.
Growing Investment in R&D of Biopharmaceutical Products Influence the Market
Mammalian systems of transient expression have certain advantages that turn them into a must for research and bioproduction. They are able to accelerate and flexibly produce proteins required in earlier stages of research, they also have ability to screen potential drug candidates and optimize therapeutic proteins.
Moreover, its further use for the production of complex proteins, monoclonal antibodies, and therapeutic proteins that require correct folding processes and post-translational modifications like glycosylation further contributes to its growing demand in the biopharmaceutical industry.
Cell line engineering, technologies for transfection, and culture conditions have continued to improve the transient expression systems in mammals which has improved their efficiency, yield, application spectrum and their relative cost-effectiveness that is essential for the production of moderate protein quantity.
Therefore, surge in investment in research and development of biopharmaceuticals all across the globe, growing potential of mammalian transient protein expression to meet stringent requirements on protein quality and its ability to develop novel therapeutics in fast times significantly contributes to its increasing demand in the biopharmaceutical industry.
Increase in investment for research and development of biopharmaceuticals, is significantly contributing to the growing demand of mammalian transient protein expression. In addition, its growing potential to meet up with the stringent requirements on protein quality, regulatory compliance, and fast timelines of production in the development of novel therapeutics further anticipates its market growth.
Growing demand for Market from Contract Research Organizations
Mammalian Transient Protein Expression are becoming increasing favorite among contract research organizations due to their ability meet several challenges in the drug discovery. They assists in rapid and flexible production of proteins that are of central importance in early-stage drug discovery and validation processes.
This flexibility of transient proteins is invariably of great value for the different needs of the pharmaceutical and biotechnology industries in terms of the production of therapeutic proteins and monoclonal antibodies, protein characterization, and assay development.
The demand for mammalian transient protein expression is also growing among CROs due to cost effectiveness as compared to other cell lines development which requires a huge upfront investment. This factor assists CROs to offer their products and services to the market at a more competitive price by maintaining their profitability.
In addition to this, improving technology in transient protein expression also assists contract research organizations work at greater efficiency and scalability which ultimately grow their production capabilities. These factors aid contract research organizations to timely apt for protein production services and support acceleration pace of innovation in biopharmaceutical industry.
Advancements in Gene Expression Platforms Anticipates the Market Growth
Gene expression platforms have contributed immensely for improvements in mammalian transient protein expression systems and the production of proteins. Improved vector design by incorporation of potent promoters, enhancers, and regulatory elements increases the efficiency of cell uptake through transfection and contributes to the improved protein yield.
These vectors are specific in certain mammalian cell lines that facilitate the production of proteins with desired folding and post-translational modifications that are necessary for biological activity.
The entry of innovative methods of transfection, such as lipid-based reagents and electroporation, has tremendously improved the delivery of expression to cells. This has resulted into increased transfection efficiency. At the same time, the growing advancements on cell line engineering has further enhanced the efficiency of host cells that are now being used for the production of complex proteins at industrial scales.
Moreover, improvements in culture conditions and media formulations have optimized the kinetics of cell growth and protein production, which further enhances the productivity without any loss to protein quality. Therefore, the growing automation and high-throughput screening technologies, has given a boost to the identification of optimal expression conditions on the one hand and have also increased the throughput for protein characterization.
These developments have, therefore, not only extended the abilities of TPE systems but have also contributed to the general use of these systems in biopharmaceutical research, drug development, and biotechnology applications.
Surging Number of Pharmaceutical Production Facilities in Emerging Nations Demonstrates Growth Opportunities
Growing number of pharmaceutical production facilities in emerging nations is playing an essential role in the growth of the mammalian transient protein expression (TPE) market. These facilities not only play a vital role but also assist in meeting the largely growing global demand for biologic drugs in the shape of monoclonal antibodies, vaccines, and therapeutic proteins.
The lower operational cost, with access to skilled labor, becomes the attractive factors for pharmaceutical firms to establish hubs for biologics in such emerging markets.
Moreover, regulatory evolution in emerging countries has also facilitated the fast-track approval of biologic drugs from mammalian TPE. Furthermore, the growing partnerships and technology transfer agreements by global pharmaceutical companies with local parties in emerging markets aids and abets the entry of mammalian TPE technologies. Such alliances fast-track the deployment of biologic production capability at a higher speed.
Such capacity growth in the pharmaceuticals manufacturing industry within emerging countries contributes to the growth of global biologics drugs which is one of the major factor for the growth of mammalian transient protein expression market.
The mammalian transient protein expression industry recorded a CAGR of 5.5% between 2020 and 2025. According to the industry, mammalian transient protein expressions generated USD 804.3 million in 2025, up from USD 615.4 million in 2020.
The commercial demand for TPE has significantly increased with the biologics revolution in the manufacture of complex therapeutic proteins. These biologics includes monoclonal antibodies and cytokines, which have grown more favorably in the market due to their specificity and effectiveness in the treatment of various diseases.
Advancements in genetic engineering holds a central place in manipulation of mammalian cells which allows direct expression of proteins that are of interests to the manufacturers in the short term.
This improvement in technology has significantly proliferated applications of transient protein expression (TPE) across a wide range of the biologics space. These factors have contributed to the growing interest of the pharmaceutical companies in developing their operation efficiently and at scale.
Moreover, the products developed using mammalian transient protein expression have received regulatory approval from bodies such as the FDA and EMA, which allows a clear route for the commercialization of such biologic drugs.
Moreover, the growing collaboration and rising investment in the development of cell culture techniques, expression vector design, and media formulations are few of the other factors that are contributing to the growth of the market. These investments are majorly aimed to improve the efficiency of the TPE process at reduced cost which is enabling it to become one of the most prominent technique for biologic production.
These factors all together are propelling the development of mammalian transient protein expression (TPE) technologies in the biopharmaceutical industry.
Companies in the Tier 1 sector account for 51.2% of the global market, ranking them as the dominant players in the industry. Tier 1 players offer a wide range of products compared to other emerging players, have an established industry presence, offer continuous innovation, and have a significant influence in the field.
A strong brand recognition and a loyal customer base provide them with a competitive advantage. Moreover, their strong financial resources enables them to enhance their research and development efforts and expand into new markets. Prominent companies within Tier 1 include Thermo Fisher Scientific, Merck KGaA, Danaher Corporation, Bio-Rad Laboratories, Inc, and Agilent Technologies, Inc.
Tier 2 players dominate the industry with a 37.1% market share. Tier 2 firms have a strong focus on a specific technologies and a substantial presence in the industry, but they have less influence than Tier 1 firms. The players are more competitive when it comes to pricing and target niche markets.
They constantly focus on introducing new products and services. Tier 2 companies include Lonza, FUJIFILM Wako Pure Chemical Corporation, Promega Corporation, Qiagen, Sartorius AG, Takara Bio, Mirus Bio and Creative BioMart
Tier 3 companies many of the times are limited to the local markets due to their limited production capabilities and geographical presence. Those in Tier 3 focus primarily on serving a smaller number of pharmaceutical clients. Few of the prominent players Creative Biolabs, GeneCopoeia, Inc., HiMedia Laboratories
An analysis of the mammalian transient protein expression industry is provided in various countries. Several regions throughout the world are examined, including Asia Pacific, North America, and Europe. USA is forecast to remain the leader with a 6.9% CAGR through 2035. Whereas, South Korea is anticipated to grow at a CAGR of 6.8% through 2035.
| Countries | Value CAGR (2025 to 2035) |
|---|---|
| United States | 6.9% |
| Canada | 4.4% |
| United Kingdom | 5.0% |
| Germany | 6.7% |
| India | 5.8% |
| China | 5.4% |
| South Korea | 6.8% |
Surge in demand for biological drugs like monoclonal antibodies and therapeutic proteins in the country, accelerating the interest in TPE technology. Biologics are majorly preferential and recommended drugs due to their specificity and efficiency in treating complex diseases. In addition, growing trend of preference towards personalized medicine anticipates the growth of the mammalian transient protein expression market in the country.
Growing technological advancements in genetic engineering, cell culture techniques, and expression vector design that has significantly helped in increasing the efficiency and scalability of TPE further augments the market growth. Moreover, association of lower production costs, with reduced timescales, makes it an attractive proposition for pharmaceutical companies those are willing to bring biologic therapies to market.
Further, the presence of well-established pharmaceutical R&D infrastructure in the USA those are willing to make crucial investments in biotechnology act as paving stones for the market of TPE.
These factors act as a very conducive atmosphere for the growth of the mammalian transient protein expression market in the USA and, as a matter of fact, makes it the cornerstone for drug development and production for biologics.
The investment made by private investors and the support extended by the government provides a congenial environment for proactive development of this industry in South Korea. Furthermore, availability of technological advancement in genetic engineering, cell culture techniques, and bioprocessing units strengthens the capabilities of South Korea in this industry.
These strong capabilities of the pharmaceutical industries of South Korea contribute to increased adoption and optimization of TPE for the efficient production of biologic drugs, including monoclonal antibodies and therapeutic proteins.
Besides, industries in South Korea, being oriented toward close cooperation with academia and research institutions, allows young talent to participate in their R&D process, thus keeping them at the leading edge of these fast-growing, competitive markets.
These are just a few of the factors that have helped propel South Korea into one of the top spots for developing and manufacturing biologic drugs via mammalian transient protein expression.
Germany has a well-built biotechnology sector with massive research infrastructure, and an educated and skilled work force. The government also extends their support by providing funding to their biopharmaceutical innovation. Such is the environment that offers accelerated innovation in genetic engineering, cell culture techniques, and expression vector design, covering improvements in TPE process efficiency and scalability.
Strong collaboration between academia, research institutions, and industry players further drives innovation in TPE technology, thereby facilitating the development of new biologic therapies and improvement of existing manufacturing techniques for products.
Increasing healthcare needs, coupled with preference for targeted therapies, and increase in market demand for biologics in Germany augments the growth of the market in the country.
Moreover, presence of highly skilled workforce in the biotech and pharmaceuticals supports the effective implementation and optimization of transient protein expression systems. Therefore, growing investment in R&D and increasing demand for high qualitative biologic drugs with affordable prices propels the growth of the market in the country.
A description of the leading segments in the industry is provided in this section. The expression vector segment held 28.4% of the value share in 2025. Based on the end user, contract research organization held 45.7% of the market in 2025.
| Application | Expression vectors |
|---|---|
| Value Share (2025) | 28.5% |
Expression vectors plays an important role in the mammalian transient protein expression market. They are essential for the production of various proteins in mammalian cells. They act as a molecular vehicles that are designed to carry and deliver genes that are essential for the coding of desired proteins into host cells.
This has been mainly caused by the versatility in accommodating different protein targets and regulatory sequences, especially in the control of gene expression levels and protein production.
Their scalability from benchtop research to large-scale biomanufacturing makes them one of the consistent protein expression with high yields that are essential for addressing biopharmaceutical needs. Commercially available expression vectors have an optimized format for the specific mammalian cell lines and production requirements, contributing to easy research development in academia and industry alike.
In general, expression vectors form a core technology in the TPE market, underscoring the developments in biotechnology, pharmaceutical development, and the production of therapeutic proteins hence, they retain the largest share in the landscape of mammalian transient protein expression.
| End User | Contract Research Organization |
|---|---|
| Value Share (2025) | 45.6% |
Contract Research Organizations hold a predominant share of the mammalian transient protein expression market due to their core competencies and a central role that falls within the biopharmaceutical research and development process.
CROs are fully equipped with ultramodern infrastructure, cutting-edge technologies, and well-trained experienced staff committed to the optimization of TPE processes. Preferential shift of established manufacturers to get their products manufactured from CROs owing to its cost efficient benefits and reduced operational charges has majorly aided CROs to hold highest share of the market.
Moreover, CROs ensure the meeting of regulatory requirements and compliance, meaning that the preclinical and clinical developments are followed up in a line. Quality assurance and documentation expertise gives support to regulatory submissions, adding credibility to research results. Thus, these factors has significantly aided CROs to highest share of these growing market.
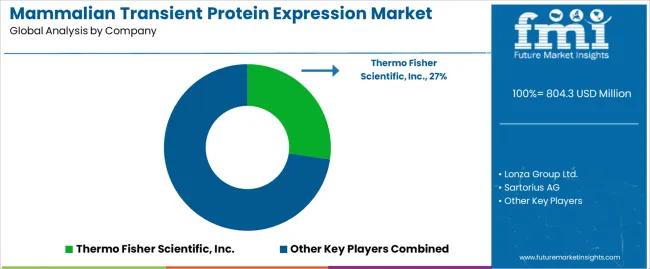
Competitor players such as Thermo Fisher Scientific and Merck KgaA holds the majority of the shares of the market as they are known for their advanced technologies in cell line development, vector systems, and bioprocessing.
Moreover, Strategic partnerships, acquisitions, and global market reach are key strategies that are being adopted by the other key players operating in the market.
Diversification of existing players into providing related services such as stable cell line development and contract manufacturing further enhances competitiveness. Whereas, growing innovation with ongoing advancements aimed at improving protein yield, scalability, and meeting the evolving demands of biopharmaceutical research and development further anticipates the growth of the market in near future.
Recent Industry Developments in the Mammalian Transient Protein Expression Market
In terms of product, the industry is segregated into instruments, expression vectors, cell lines (Chinese hamster ovary (CHO) cells, human embryonic kidney 293 (HEK 293) cells and others cell lines) and reagents and consumables
In terms of Application, the industry is segregated into bio-production (antibody production and therapeutic protein production), functional cell-based assays, academic research and others
In terms of end user, the industry is segmented into biopharmaceutical companies, contract research organizations and academic & research institutes
Key countries of North America, Latin America, Western Europe, Eastern Europe, South Asia, East Asia, Middle East, and Africa have been covered in the report.
The global mammalian transient protein expression market is estimated to be valued at USD 804.3 million in 2025.
The market size for the mammalian transient protein expression market is projected to reach USD 1,373.8 million by 2035.
The mammalian transient protein expression market is expected to grow at a 5.5% CAGR between 2025 and 2035.
The key product types in mammalian transient protein expression market are expression vectors, instruments, cell lines, _chinese hamster ovary (cho) cells, _human embryonic kidney 293 (hek 293) cells, _others cell lines and reagents and consumables.
In terms of application, bio-production segment to command 40.0% share in the mammalian transient protein expression market in 2025.


Our Research Products

The "Full Research Suite" delivers actionable market intel, deep dives on markets or technologies, so clients act faster, cut risk, and unlock growth.

The Leaderboard benchmarks and ranks top vendors, classifying them as Established Leaders, Leading Challengers, or Disruptors & Challengers.

Locates where complements amplify value and substitutes erode it, forecasting net impact by horizon

We deliver granular, decision-grade intel: market sizing, 5-year forecasts, pricing, adoption, usage, revenue, and operational KPIs—plus competitor tracking, regulation, and value chains—across 60 countries broadly.

Spot the shifts before they hit your P&L. We track inflection points, adoption curves, pricing moves, and ecosystem plays to show where demand is heading, why it is changing, and what to do next across high-growth markets and disruptive tech

Real-time reads of user behavior. We track shifting priorities, perceptions of today’s and next-gen services, and provider experience, then pace how fast tech moves from trial to adoption, blending buyer, consumer, and channel inputs with social signals (#WhySwitch, #UX).

Partner with our analyst team to build a custom report designed around your business priorities. From analysing market trends to assessing competitors or crafting bespoke datasets, we tailor insights to your needs.
Supplier Intelligence
Discovery & Profiling
Capacity & Footprint
Performance & Risk
Compliance & Governance
Commercial Readiness
Who Supplies Whom
Scorecards & Shortlists
Playbooks & Docs
Category Intelligence
Definition & Scope
Demand & Use Cases
Cost Drivers
Market Structure
Supply Chain Map
Trade & Policy
Operating Norms
Deliverables
Buyer Intelligence
Account Basics
Spend & Scope
Procurement Model
Vendor Requirements
Terms & Policies
Entry Strategy
Pain Points & Triggers
Outputs
Pricing Analysis
Benchmarks
Trends
Should-Cost
Indexation
Landed Cost
Commercial Terms
Deliverables
Brand Analysis
Positioning & Value Prop
Share & Presence
Customer Evidence
Go-to-Market
Digital & Reputation
Compliance & Trust
KPIs & Gaps
Outputs
Full Research Suite comprises of:
Market outlook & trends analysis
Interviews & case studies
Strategic recommendations
Vendor profiles & capabilities analysis
5-year forecasts
8 regions and 60+ country-level data splits
Market segment data splits
12 months of continuous data updates
DELIVERED AS:
PDF EXCEL ONLINE
Mammalian Cell Fermentation Technology Market Forecast Outlook 2025 to 2035
Mammalian Derived Proteins Market Size and Share Forecast Outlook 2025 to 2035
Transient Elastography Device Market Size and Share Forecast Outlook 2025 to 2035
Transient Protein Expression Market
Protein-Coating Line Market Forecast Outlook 2025 to 2035
Protein Labelling Market Size and Share Forecast Outlook 2025 to 2035
Protein Puddings Market Size and Share Forecast Outlook 2025 to 2035
Protein/Antibody Engineering Market Size and Share Forecast Outlook 2025 to 2035
Protein Purification Resin Market Size and Share Forecast Outlook 2025 to 2035
Protein Hydrolysate For Animal Feed Application Market Size and Share Forecast Outlook 2025 to 2035
Protein Crisps Market Outlook - Growth, Demand & Forecast 2025 to 2035
Protein Hydrolysate Market Size and Share Forecast Outlook 2025 to 2035
Protein Supplement Market - Size, Share, and Forecast 2025 to 2035
Protein Powder Market Analysis - Size, Share, and Forecast Outlook 2025 to 2035
Protein Purification and Isolation Market Insights – Size, Share & Forecast 2025 to 2035
Protein Ingredients Market Analysis - Size, Share, and Forecast 2025 to 2035
Protein A Resins Market Trends, Demand & Forecast 2025 to 2035
Proteinase K Market Growth - Trends & Forecast 2025 to 2035
Proteinuria Treatment Market Insights – Demand & Forecast 2025 to 2035
Protein Packaging Market Trends and Forecast 2025 to 2035

Thank you!
You will receive an email from our Business Development Manager. Please be sure to check your SPAM/JUNK folder too.
Chat With
MaRIA