Transient Elastography Device Market Size and Share Forecast Outlook 2025 to 2035

The Transient Elastography Device Market is estimated to be valued at USD 483.8 million in 2025 and is projected to reach USD 997.0 million by 2035, registering a compound annual growth rate (CAGR) of 7.5% over the forecast period.
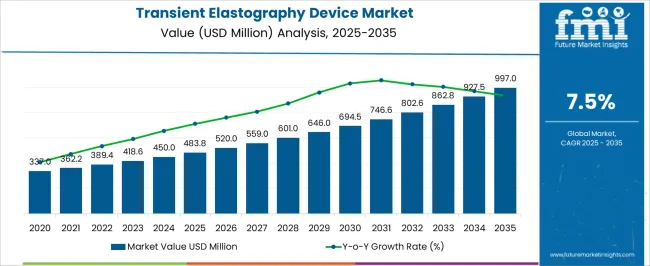
Quick Stats for Transient Elastography Device Market

  • Transient Elastography Device Market Value (2025): USD 483.8 million
  • Transient Elastography Device Market Forecast Value (2035): USD 997.0 million
  • Transient Elastography Device Market Forecast CAGR: 7.5%
  • Leading Segment in Transient Elastography Device Market in 2025: VCTE – Vibration Controlled Transient Elastography (53.1%)
  • Key Growth Regions in Transient Elastography Device Market: North America, Asia-Pacific, Europe
  • Top Key Players in Transient Elastography Device Market: Echosens, VCTE-Vibration Controlled Transient Elastographies, CAP-Controlled Attenuation Parameters, Sandhill Scientific

Transient Elastography Device Market Market Value Analysis

Transient Elastography Device Market Key Takeaways

Metric Value
Transient Elastography Device Market Estimated Value in (2025 E) USD 483.8 million
Transient Elastography Device Market Forecast Value in (2035 F) USD 997.0 million
Forecast CAGR (2025 to 2035) 7.5%

Why is the Transient Elastography Device Market Growing?

The Transient Elastography Device market is experiencing significant growth, driven by the increasing prevalence of liver diseases, including fibrosis, cirrhosis, and non-alcoholic fatty liver disease, which require non-invasive diagnostic solutions. Adoption is being accelerated by the advantages of transient elastography, including rapid assessment, patient comfort, and high diagnostic accuracy compared with traditional biopsy methods. Technological advancements, such as vibration-controlled elastography, are improving measurement precision and expanding clinical applicability.

Rising investments in healthcare infrastructure, particularly in emerging markets, and increasing demand for early diagnosis and continuous monitoring of liver conditions are further supporting market expansion. Hospitals, diagnostic centers, and specialty clinics are actively integrating transient elastography devices into routine workflows to enhance patient outcomes and operational efficiency.

Regulatory support for non-invasive diagnostic tools and growing awareness among healthcare providers regarding disease monitoring protocols are also contributing to adoption As liver disease incidence rises globally and clinicians prioritize efficient, accurate, and patient-friendly diagnostic solutions, the market is expected to witness sustained growth, with innovation in device technology and software analytics driving continued expansion.

Segmental Analysis

The transient elastography device market is segmented by technology, modality, end users, and geographic regions. By technology, transient elastography device market is divided into VCTE – Vibration Controlled Transient Elastography and CAP – Controlled Attenuation Parameter. In terms of modality, transient elastography device market is classified into Standalone Devices and Mobile Devices. Based on end users, transient elastography device market is segmented into Hospitals, Diagnostic Centers, and Ambulatory Surgical Centers. Regionally, the transient elastography device industry is classified into North America, Latin America, Western Europe, Eastern Europe, Balkan & Baltic Countries, Russia & Belarus, Central Asia, East Asia, South Asia & Pacific, and the Middle East & Africa.
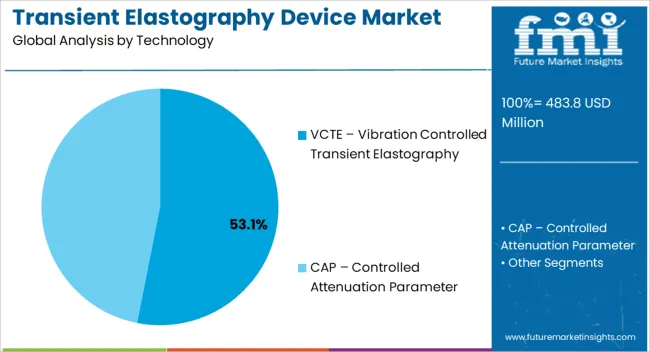
Insights into the VCTE – Vibration Controlled Transient Elastography Technology Segment

Transient Elastography Device Market Analysis By Technology

The VCTE – vibration controlled transient elastography segment is projected to hold 53.1% of the market revenue in 2025, establishing it as the leading technology. Growth in this segment is being driven by its ability to provide highly accurate, reproducible liver stiffness measurements in a non-invasive and rapid manner. The vibration-controlled mechanism enhances the reliability of measurements across diverse patient populations, including those with obesity or comorbidities.

Integration of advanced software for data analysis and reporting further strengthens clinical decision-making capabilities. Adoption is being supported by hospitals and specialty clinics seeking efficient, patient-friendly diagnostic workflows that reduce reliance on invasive biopsy procedures. The ability to combine speed, precision, and ease of use has positioned VCTE as the preferred technology among clinicians.

Continuous improvements in device ergonomics, calibration, and software analytics are expected to reinforce its market leadership As healthcare providers increasingly prioritize early disease detection and monitoring, the VCTE segment is likely to maintain its leading share, driven by clinical efficacy, operational efficiency, and patient comfort.
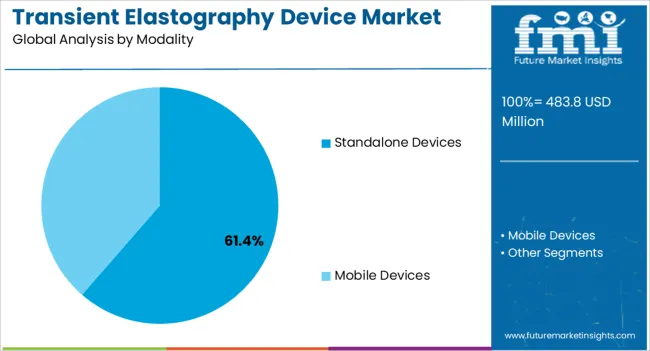
Insights into the Standalone Devices Modality Segment

Transient Elastography Device Market Analysis By Modality

The standalone devices segment is anticipated to account for 61.4% of the market revenue in 2025, making it the leading modality. Growth is being supported by the widespread adoption of compact, independent devices that offer flexibility in deployment across hospitals, clinics, and diagnostic centers. Standalone devices do not require integration with existing imaging systems, allowing for quick installation, portability, and operational efficiency.

These devices are being leveraged to enhance liver disease screening programs, monitor disease progression, and support clinical decision-making in real time. Clinicians benefit from the ease of use, rapid measurement turnaround, and consistent accuracy, which improves patient experience and reduces procedural bottlenecks.

Increasing hospital investments in non-invasive diagnostics, combined with the rising prevalence of chronic liver conditions, are reinforcing demand for standalone devices As healthcare providers prioritize patient-centric, efficient, and cost-effective diagnostic tools, the standalone modality is expected to remain the dominant choice, supported by technological advancements, reliability, and operational convenience.
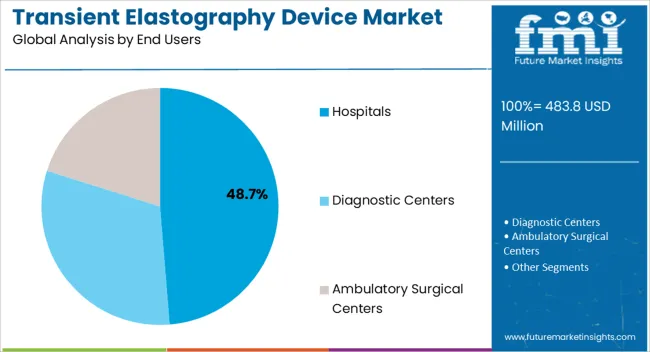
Insights into the Hospitals End Users Segment

Transient Elastography Device Market Analysis By End Users

The hospitals end users segment is expected to hold 48.7% of the market revenue in 2025, establishing it as the leading end-user category. Growth in this segment is being driven by the high patient volumes, multidisciplinary care requirements, and investment capacity of hospitals, which favor the deployment of advanced transient elastography devices. Hospitals are increasingly integrating these devices into routine hepatology and gastroenterology workflows to improve early detection of liver diseases and monitor treatment outcomes.

The ability to perform rapid, non-invasive diagnostics on multiple patients enhances operational efficiency and reduces reliance on invasive biopsy procedures. Hospitals also benefit from comprehensive data management and reporting capabilities, which support clinical research, patient record maintenance, and regulatory compliance.

Rising awareness among healthcare providers regarding the importance of early liver disease intervention, combined with increasing government and private healthcare investments, further reinforces adoption As hospitals continue to prioritize patient-centered care, scalability, and operational efficiency, this end-user segment is expected to maintain its leading position in the market, driving overall growth.

Market Overview

Transient Elastography Device Market Overview

Elastography is a medical imaging technique, like ultrasound and MRI, which is used to detect whether the tissue is hard or soft, depending on which the part is affected or stage of any disease can be determined. Transient elastography is a non – invasive test usually done to detect liver fibrosis.

Liver fibrosis or stestosis is stiffening of liver which is an indication for condition such as cirrhosis and hepatitis. Transient elastography is a technique which works on the principle of measuring the shear wave velocity and provides one dimensional image of the tissue.

In this the wave passes through the tissue which creates a distortion in the tissue. An image is created due to motion of the tissues which determines the condition of the tissue. The transient elastography device uses ultrasound waves of 5 MHz and low frequency elastic waves of 50 Hz, whose velocity is directly related to elasticity.

Transient elastography measures the stiffness of liver in volume which is approximately like a cylinder, 1 cm wide and 4 cm long, 25 – 65 mm just below the skin. The volume measured by transient elastography technique is 100 times bigger than a biopsy sample and is more accurate.
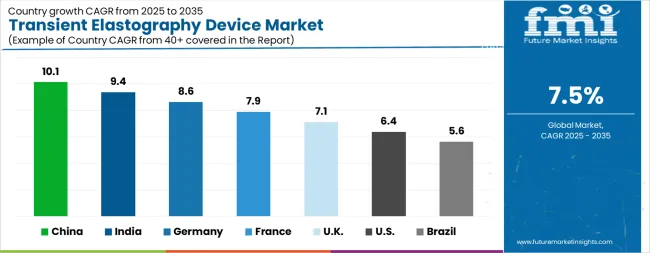
Analysis of Transient Elastography Device Market By Key Countries

Transient Elastography Device Market Cagr Analysis By Country

Country CAGR
China 10.1%
India 9.4%
Germany 8.6%
France 7.9%
UK 7.1%
USA 6.4%
Brazil 5.6%

Country-wise Analysis

The Transient Elastography Device Market is expected to register a CAGR of 7.5% during the forecast period, exhibiting varied country level momentum. China leads with the highest CAGR of 10.1%, followed by India at 9.4%. Developed markets such as Germany, France, and the UK continue to expand steadily, while the USA is likely to grow at consistent rates. Brazil posts the lowest CAGR at 5.6%, yet still underscores a broadly positive trajectory for the global Transient Elastography Device Market. In 2024, Germany held a dominant revenue in the Western Europe market and is expected to grow with a CAGR of 8.6%. The USA Transient Elastography Device Market is estimated to be valued at USD 166.1 million in 2025 and is anticipated to reach a valuation of USD 308.2 million by 2035. Sales are projected to rise at a CAGR of 6.4% over the forecast period between 2025 and 2035. While Japan and South Korea markets are estimated to be valued at USD 22.7 million and USD 12.9 million respectively in 2025.
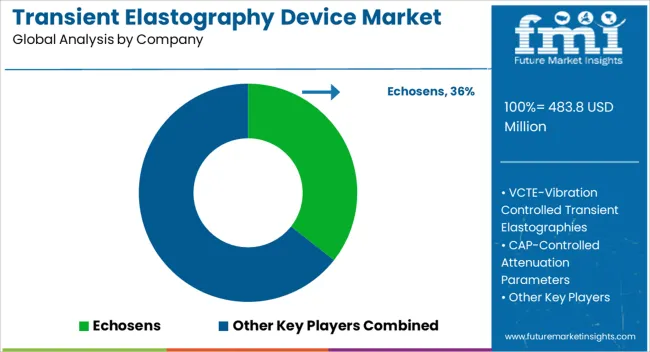
Key Players in the Transient Elastography Device Market

Transient Elastography Device Market Analysis By Company

  • Echosens
  • VCTE-Vibration Controlled Transient Elastographies
  • CAP-Controlled Attenuation Parameters
  • Sandhill Scientific

Scope of the Report

Item Value
Quantitative Units USD 483.8 Million
Technology VCTE – Vibration Controlled Transient Elastography and CAP – Controlled Attenuation Parameter
Modality Standalone Devices and Mobile Devices
End Users Hospitals, Diagnostic Centers, and Ambulatory Surgical Centers
Regions Covered North America, Europe, Asia-Pacific, Latin America, Middle East & Africa
Country Covered United States, Canada, Germany, France, United Kingdom, China, Japan, India, Brazil, South Africa
Key Companies Profiled Echosens, VCTE-Vibration Controlled Transient Elastographies, CAP-Controlled Attenuation Parameters, and Sandhill Scientific

Transient Elastography Device Market by Segments

Technology:

  • VCTE – Vibration Controlled Transient Elastography
  • CAP – Controlled Attenuation Parameter

Modality:

  • Standalone Devices
  • Mobile Devices

End Users:

  • Hospitals
  • Diagnostic Centers
  • Ambulatory Surgical Centers

Region:

  • North America
    • USA
    • Canada
    • Mexico
  • Latin America
    • Brazil
    • Chile
    • Rest of Latin America
  • Western Europe
    • Germany
    • UK
    • Italy
    • Spain
    • France
    • Nordic
    • BENELUX
    • Rest of Western Europe
  • Eastern Europe
    • Russia
    • Poland
    • Hungary
    • Balkan & Baltic
    • Rest of Eastern Europe
  • East Asia
    • China
    • Japan
    • South Korea
  • South Asia and Pacific
    • India
    • ASEAN
    • Australia & New Zealand
    • Rest of South Asia and Pacific
  • Middle East & Africa
    • Kingdom of Saudi Arabia
    • Other GCC Countries
    • Turkiye
    • South Africa
    • Other African Union
    • Rest of Middle East & Africa

Table of Content

  1. Executive Summary
    • Global Market Outlook
    • Demand-side Trends
    • Supply-side Trends
    • Technology Roadmap Analysis
    • Analysis and Recommendations
  2. Market Overview
    • Market Coverage / Taxonomy
    • Market Definition / Scope / Limitations
  3. Market Background
    • Market Dynamics
      • Drivers
      • Restraints
      • Opportunity
      • Trends
    • Scenario Forecast
      • Demand in Optimistic Scenario
      • Demand in Likely Scenario
      • Demand in Conservative Scenario
    • Opportunity Map Analysis
    • Product Life Cycle Analysis
    • Supply Chain Analysis
    • Investment Feasibility Matrix
    • Value Chain Analysis
    • PESTLE and Porter’s Analysis
    • Regulatory Landscape
    • Regional Parent Market Outlook
    • Production and Consumption Statistics
    • Import and Export Statistics
  4. Global Market Analysis 2020 to 2024 and Forecast, 2025 to 2035
    • Historical Market Size Value (USD Million) Analysis, 2020 to 2024
    • Current and Future Market Size Value (USD Million) Projections, 2025 to 2035
      • Y-o-Y Growth Trend Analysis
      • Absolute $ Opportunity Analysis
  5. Global Market Pricing Analysis 2020 to 2024 and Forecast 2025 to 2035
  6. Global Market Analysis 2020 to 2024 and Forecast 2025 to 2035, By Technology
    • Introduction / Key Findings
    • Historical Market Size Value (USD Million) Analysis By Technology , 2020 to 2024
    • Current and Future Market Size Value (USD Million) Analysis and Forecast By Technology , 2025 to 2035
      • VCTE - Vibration Controlled Transient Elastography
      • CAP - Controlled Attenuation Parameter
    • Y-o-Y Growth Trend Analysis By Technology , 2020 to 2024
    • Absolute $ Opportunity Analysis By Technology , 2025 to 2035
  7. Global Market Analysis 2020 to 2024 and Forecast 2025 to 2035, By Modality
    • Introduction / Key Findings
    • Historical Market Size Value (USD Million) Analysis By Modality, 2020 to 2024
    • Current and Future Market Size Value (USD Million) Analysis and Forecast By Modality, 2025 to 2035
      • Standalone Devices
      • Mobile Devices
    • Y-o-Y Growth Trend Analysis By Modality, 2020 to 2024
    • Absolute $ Opportunity Analysis By Modality, 2025 to 2035
  8. Global Market Analysis 2020 to 2024 and Forecast 2025 to 2035, By End Users
    • Introduction / Key Findings
    • Historical Market Size Value (USD Million) Analysis By End Users, 2020 to 2024
    • Current and Future Market Size Value (USD Million) Analysis and Forecast By End Users, 2025 to 2035
      • Hospitals
      • Diagnostic Centers
      • Ambulatory Surgical Centers
    • Y-o-Y Growth Trend Analysis By End Users, 2020 to 2024
    • Absolute $ Opportunity Analysis By End Users, 2025 to 2035
  9. Global Market Analysis 2020 to 2024 and Forecast 2025 to 2035, By Region
    • Introduction
    • Historical Market Size Value (USD Million) Analysis By Region, 2020 to 2024
    • Current Market Size Value (USD Million) Analysis and Forecast By Region, 2025 to 2035
      • North America
      • Latin America
      • Western Europe
      • Eastern Europe
      • East Asia
      • South Asia and Pacific
      • Middle East & Africa
    • Market Attractiveness Analysis By Region
  10. North America Market Analysis 2020 to 2024 and Forecast 2025 to 2035, By Country
    • Historical Market Size Value (USD Million) Trend Analysis By Market Taxonomy, 2020 to 2024
    • Market Size Value (USD Million) Forecast By Market Taxonomy, 2025 to 2035
      • By Country
        • USA
        • Canada
        • Mexico
      • By Technology
      • By Modality
      • By End Users
    • Market Attractiveness Analysis
      • By Country
      • By Technology
      • By Modality
      • By End Users
    • Key Takeaways
  11. Latin America Market Analysis 2020 to 2024 and Forecast 2025 to 2035, By Country
    • Historical Market Size Value (USD Million) Trend Analysis By Market Taxonomy, 2020 to 2024
    • Market Size Value (USD Million) Forecast By Market Taxonomy, 2025 to 2035
      • By Country
        • Brazil
        • Chile
        • Rest of Latin America
      • By Technology
      • By Modality
      • By End Users
    • Market Attractiveness Analysis
      • By Country
      • By Technology
      • By Modality
      • By End Users
    • Key Takeaways
  12. Western Europe Market Analysis 2020 to 2024 and Forecast 2025 to 2035, By Country
    • Historical Market Size Value (USD Million) Trend Analysis By Market Taxonomy, 2020 to 2024
    • Market Size Value (USD Million) Forecast By Market Taxonomy, 2025 to 2035
      • By Country
        • Germany
        • UK
        • Italy
        • Spain
        • France
        • Nordic
        • BENELUX
        • Rest of Western Europe
      • By Technology
      • By Modality
      • By End Users
    • Market Attractiveness Analysis
      • By Country
      • By Technology
      • By Modality
      • By End Users
    • Key Takeaways
  13. Eastern Europe Market Analysis 2020 to 2024 and Forecast 2025 to 2035, By Country
    • Historical Market Size Value (USD Million) Trend Analysis By Market Taxonomy, 2020 to 2024
    • Market Size Value (USD Million) Forecast By Market Taxonomy, 2025 to 2035
      • By Country
        • Russia
        • Poland
        • Hungary
        • Balkan & Baltic
        • Rest of Eastern Europe
      • By Technology
      • By Modality
      • By End Users
    • Market Attractiveness Analysis
      • By Country
      • By Technology
      • By Modality
      • By End Users
    • Key Takeaways
  14. East Asia Market Analysis 2020 to 2024 and Forecast 2025 to 2035, By Country
    • Historical Market Size Value (USD Million) Trend Analysis By Market Taxonomy, 2020 to 2024
    • Market Size Value (USD Million) Forecast By Market Taxonomy, 2025 to 2035
      • By Country
        • China
        • Japan
        • South Korea
      • By Technology
      • By Modality
      • By End Users
    • Market Attractiveness Analysis
      • By Country
      • By Technology
      • By Modality
      • By End Users
    • Key Takeaways
  15. South Asia and Pacific Market Analysis 2020 to 2024 and Forecast 2025 to 2035, By Country
    • Historical Market Size Value (USD Million) Trend Analysis By Market Taxonomy, 2020 to 2024
    • Market Size Value (USD Million) Forecast By Market Taxonomy, 2025 to 2035
      • By Country
        • India
        • ASEAN
        • Australia & New Zealand
        • Rest of South Asia and Pacific
      • By Technology
      • By Modality
      • By End Users
    • Market Attractiveness Analysis
      • By Country
      • By Technology
      • By Modality
      • By End Users
    • Key Takeaways
  16. Middle East & Africa Market Analysis 2020 to 2024 and Forecast 2025 to 2035, By Country
    • Historical Market Size Value (USD Million) Trend Analysis By Market Taxonomy, 2020 to 2024
    • Market Size Value (USD Million) Forecast By Market Taxonomy, 2025 to 2035
      • By Country
        • Kingdom of Saudi Arabia
        • Other GCC Countries
        • Turkiye
        • South Africa
        • Other African Union
        • Rest of Middle East & Africa
      • By Technology
      • By Modality
      • By End Users
    • Market Attractiveness Analysis
      • By Country
      • By Technology
      • By Modality
      • By End Users
    • Key Takeaways
  17. Key Countries Market Analysis
    • USA
      • Pricing Analysis
      • Market Share Analysis, 2024
        • By Technology
        • By Modality
        • By End Users
    • Canada
      • Pricing Analysis
      • Market Share Analysis, 2024
        • By Technology
        • By Modality
        • By End Users
    • Mexico
      • Pricing Analysis
      • Market Share Analysis, 2024
        • By Technology
        • By Modality
        • By End Users
    • Brazil
      • Pricing Analysis
      • Market Share Analysis, 2024
        • By Technology
        • By Modality
        • By End Users
    • Chile
      • Pricing Analysis
      • Market Share Analysis, 2024
        • By Technology
        • By Modality
        • By End Users
    • Germany
      • Pricing Analysis
      • Market Share Analysis, 2024
        • By Technology
        • By Modality
        • By End Users
    • UK
      • Pricing Analysis
      • Market Share Analysis, 2024
        • By Technology
        • By Modality
        • By End Users
    • Italy
      • Pricing Analysis
      • Market Share Analysis, 2024
        • By Technology
        • By Modality
        • By End Users
    • Spain
      • Pricing Analysis
      • Market Share Analysis, 2024
        • By Technology
        • By Modality
        • By End Users
    • France
      • Pricing Analysis
      • Market Share Analysis, 2024
        • By Technology
        • By Modality
        • By End Users
    • India
      • Pricing Analysis
      • Market Share Analysis, 2024
        • By Technology
        • By Modality
        • By End Users
    • ASEAN
      • Pricing Analysis
      • Market Share Analysis, 2024
        • By Technology
        • By Modality
        • By End Users
    • Australia & New Zealand
      • Pricing Analysis
      • Market Share Analysis, 2024
        • By Technology
        • By Modality
        • By End Users
    • China
      • Pricing Analysis
      • Market Share Analysis, 2024
        • By Technology
        • By Modality
        • By End Users
    • Japan
      • Pricing Analysis
      • Market Share Analysis, 2024
        • By Technology
        • By Modality
        • By End Users
    • South Korea
      • Pricing Analysis
      • Market Share Analysis, 2024
        • By Technology
        • By Modality
        • By End Users
    • Russia
      • Pricing Analysis
      • Market Share Analysis, 2024
        • By Technology
        • By Modality
        • By End Users
    • Poland
      • Pricing Analysis
      • Market Share Analysis, 2024
        • By Technology
        • By Modality
        • By End Users
    • Hungary
      • Pricing Analysis
      • Market Share Analysis, 2024
        • By Technology
        • By Modality
        • By End Users
    • Kingdom of Saudi Arabia
      • Pricing Analysis
      • Market Share Analysis, 2024
        • By Technology
        • By Modality
        • By End Users
    • Turkiye
      • Pricing Analysis
      • Market Share Analysis, 2024
        • By Technology
        • By Modality
        • By End Users
    • South Africa
      • Pricing Analysis
      • Market Share Analysis, 2024
        • By Technology
        • By Modality
        • By End Users
  18. Market Structure Analysis
    • Competition Dashboard
    • Competition Benchmarking
    • Market Share Analysis of Top Players
      • By Regional
      • By Technology
      • By Modality
      • By End Users
  19. Competition Analysis
    • Competition Deep Dive
      • Echosens
        • Overview
        • Product Portfolio
        • Profitability by Market Segments (Product/Age /Sales Channel/Region)
        • Sales Footprint
        • Strategy Overview
          • Marketing Strategy
          • Product Strategy
          • Channel Strategy
      • VCTE-Vibration Controlled Transient Elastographies
      • CAP-Controlled Attenuation Parameters
      • Sandhill Scientific
  20. Assumptions & Acronyms Used
  21. Research Methodology

List of Tables

  • Table 1: Global Market Value (USD Million) Forecast by Region, 2020 to 2035
  • Table 2: Global Market Value (USD Million) Forecast by Technology , 2020 to 2035
  • Table 3: Global Market Value (USD Million) Forecast by Modality, 2020 to 2035
  • Table 4: Global Market Value (USD Million) Forecast by End Users, 2020 to 2035
  • Table 5: North America Market Value (USD Million) Forecast by Country, 2020 to 2035
  • Table 6: North America Market Value (USD Million) Forecast by Technology , 2020 to 2035
  • Table 7: North America Market Value (USD Million) Forecast by Modality, 2020 to 2035
  • Table 8: North America Market Value (USD Million) Forecast by End Users, 2020 to 2035
  • Table 9: Latin America Market Value (USD Million) Forecast by Country, 2020 to 2035
  • Table 10: Latin America Market Value (USD Million) Forecast by Technology , 2020 to 2035
  • Table 11: Latin America Market Value (USD Million) Forecast by Modality, 2020 to 2035
  • Table 12: Latin America Market Value (USD Million) Forecast by End Users, 2020 to 2035
  • Table 13: Western Europe Market Value (USD Million) Forecast by Country, 2020 to 2035
  • Table 14: Western Europe Market Value (USD Million) Forecast by Technology , 2020 to 2035
  • Table 15: Western Europe Market Value (USD Million) Forecast by Modality, 2020 to 2035
  • Table 16: Western Europe Market Value (USD Million) Forecast by End Users, 2020 to 2035
  • Table 17: Eastern Europe Market Value (USD Million) Forecast by Country, 2020 to 2035
  • Table 18: Eastern Europe Market Value (USD Million) Forecast by Technology , 2020 to 2035
  • Table 19: Eastern Europe Market Value (USD Million) Forecast by Modality, 2020 to 2035
  • Table 20: Eastern Europe Market Value (USD Million) Forecast by End Users, 2020 to 2035
  • Table 21: East Asia Market Value (USD Million) Forecast by Country, 2020 to 2035
  • Table 22: East Asia Market Value (USD Million) Forecast by Technology , 2020 to 2035
  • Table 23: East Asia Market Value (USD Million) Forecast by Modality, 2020 to 2035
  • Table 24: East Asia Market Value (USD Million) Forecast by End Users, 2020 to 2035
  • Table 25: South Asia and Pacific Market Value (USD Million) Forecast by Country, 2020 to 2035
  • Table 26: South Asia and Pacific Market Value (USD Million) Forecast by Technology , 2020 to 2035
  • Table 27: South Asia and Pacific Market Value (USD Million) Forecast by Modality, 2020 to 2035
  • Table 28: South Asia and Pacific Market Value (USD Million) Forecast by End Users, 2020 to 2035
  • Table 29: Middle East & Africa Market Value (USD Million) Forecast by Country, 2020 to 2035
  • Table 30: Middle East & Africa Market Value (USD Million) Forecast by Technology , 2020 to 2035
  • Table 31: Middle East & Africa Market Value (USD Million) Forecast by Modality, 2020 to 2035
  • Table 32: Middle East & Africa Market Value (USD Million) Forecast by End Users, 2020 to 2035

List of Figures

  • Figure 1: Global Market Pricing Analysis
  • Figure 2: Global Market Value (USD Million) Forecast 2020-2035
  • Figure 3: Global Market Value Share and BPS Analysis by Technology , 2025 and 2035
  • Figure 4: Global Market Y-o-Y Growth Comparison by Technology , 2025-2035
  • Figure 5: Global Market Attractiveness Analysis by Technology
  • Figure 6: Global Market Value Share and BPS Analysis by Modality, 2025 and 2035
  • Figure 7: Global Market Y-o-Y Growth Comparison by Modality, 2025-2035
  • Figure 8: Global Market Attractiveness Analysis by Modality
  • Figure 9: Global Market Value Share and BPS Analysis by End Users, 2025 and 2035
  • Figure 10: Global Market Y-o-Y Growth Comparison by End Users, 2025-2035
  • Figure 11: Global Market Attractiveness Analysis by End Users
  • Figure 12: Global Market Value (USD Million) Share and BPS Analysis by Region, 2025 and 2035
  • Figure 13: Global Market Y-o-Y Growth Comparison by Region, 2025-2035
  • Figure 14: Global Market Attractiveness Analysis by Region
  • Figure 15: North America Market Incremental Dollar Opportunity, 2025-2035
  • Figure 16: Latin America Market Incremental Dollar Opportunity, 2025-2035
  • Figure 17: Western Europe Market Incremental Dollar Opportunity, 2025-2035
  • Figure 18: Eastern Europe Market Incremental Dollar Opportunity, 2025-2035
  • Figure 19: East Asia Market Incremental Dollar Opportunity, 2025-2035
  • Figure 20: South Asia and Pacific Market Incremental Dollar Opportunity, 2025-2035
  • Figure 21: Middle East & Africa Market Incremental Dollar Opportunity, 2025-2035
  • Figure 22: North America Market Value Share and BPS Analysis by Country, 2025 and 2035
  • Figure 23: North America Market Value Share and BPS Analysis by Technology , 2025 and 2035
  • Figure 24: North America Market Y-o-Y Growth Comparison by Technology , 2025-2035
  • Figure 25: North America Market Attractiveness Analysis by Technology
  • Figure 26: North America Market Value Share and BPS Analysis by Modality, 2025 and 2035
  • Figure 27: North America Market Y-o-Y Growth Comparison by Modality, 2025-2035
  • Figure 28: North America Market Attractiveness Analysis by Modality
  • Figure 29: North America Market Value Share and BPS Analysis by End Users, 2025 and 2035
  • Figure 30: North America Market Y-o-Y Growth Comparison by End Users, 2025-2035
  • Figure 31: North America Market Attractiveness Analysis by End Users
  • Figure 32: Latin America Market Value Share and BPS Analysis by Country, 2025 and 2035
  • Figure 33: Latin America Market Value Share and BPS Analysis by Technology , 2025 and 2035
  • Figure 34: Latin America Market Y-o-Y Growth Comparison by Technology , 2025-2035
  • Figure 35: Latin America Market Attractiveness Analysis by Technology
  • Figure 36: Latin America Market Value Share and BPS Analysis by Modality, 2025 and 2035
  • Figure 37: Latin America Market Y-o-Y Growth Comparison by Modality, 2025-2035
  • Figure 38: Latin America Market Attractiveness Analysis by Modality
  • Figure 39: Latin America Market Value Share and BPS Analysis by End Users, 2025 and 2035
  • Figure 40: Latin America Market Y-o-Y Growth Comparison by End Users, 2025-2035
  • Figure 41: Latin America Market Attractiveness Analysis by End Users
  • Figure 42: Western Europe Market Value Share and BPS Analysis by Country, 2025 and 2035
  • Figure 43: Western Europe Market Value Share and BPS Analysis by Technology , 2025 and 2035
  • Figure 44: Western Europe Market Y-o-Y Growth Comparison by Technology , 2025-2035
  • Figure 45: Western Europe Market Attractiveness Analysis by Technology
  • Figure 46: Western Europe Market Value Share and BPS Analysis by Modality, 2025 and 2035
  • Figure 47: Western Europe Market Y-o-Y Growth Comparison by Modality, 2025-2035
  • Figure 48: Western Europe Market Attractiveness Analysis by Modality
  • Figure 49: Western Europe Market Value Share and BPS Analysis by End Users, 2025 and 2035
  • Figure 50: Western Europe Market Y-o-Y Growth Comparison by End Users, 2025-2035
  • Figure 51: Western Europe Market Attractiveness Analysis by End Users
  • Figure 52: Eastern Europe Market Value Share and BPS Analysis by Country, 2025 and 2035
  • Figure 53: Eastern Europe Market Value Share and BPS Analysis by Technology , 2025 and 2035
  • Figure 54: Eastern Europe Market Y-o-Y Growth Comparison by Technology , 2025-2035
  • Figure 55: Eastern Europe Market Attractiveness Analysis by Technology
  • Figure 56: Eastern Europe Market Value Share and BPS Analysis by Modality, 2025 and 2035
  • Figure 57: Eastern Europe Market Y-o-Y Growth Comparison by Modality, 2025-2035
  • Figure 58: Eastern Europe Market Attractiveness Analysis by Modality
  • Figure 59: Eastern Europe Market Value Share and BPS Analysis by End Users, 2025 and 2035
  • Figure 60: Eastern Europe Market Y-o-Y Growth Comparison by End Users, 2025-2035
  • Figure 61: Eastern Europe Market Attractiveness Analysis by End Users
  • Figure 62: East Asia Market Value Share and BPS Analysis by Country, 2025 and 2035
  • Figure 63: East Asia Market Value Share and BPS Analysis by Technology , 2025 and 2035
  • Figure 64: East Asia Market Y-o-Y Growth Comparison by Technology , 2025-2035
  • Figure 65: East Asia Market Attractiveness Analysis by Technology
  • Figure 66: East Asia Market Value Share and BPS Analysis by Modality, 2025 and 2035
  • Figure 67: East Asia Market Y-o-Y Growth Comparison by Modality, 2025-2035
  • Figure 68: East Asia Market Attractiveness Analysis by Modality
  • Figure 69: East Asia Market Value Share and BPS Analysis by End Users, 2025 and 2035
  • Figure 70: East Asia Market Y-o-Y Growth Comparison by End Users, 2025-2035
  • Figure 71: East Asia Market Attractiveness Analysis by End Users
  • Figure 72: South Asia and Pacific Market Value Share and BPS Analysis by Country, 2025 and 2035
  • Figure 73: South Asia and Pacific Market Value Share and BPS Analysis by Technology , 2025 and 2035
  • Figure 74: South Asia and Pacific Market Y-o-Y Growth Comparison by Technology , 2025-2035
  • Figure 75: South Asia and Pacific Market Attractiveness Analysis by Technology
  • Figure 76: South Asia and Pacific Market Value Share and BPS Analysis by Modality, 2025 and 2035
  • Figure 77: South Asia and Pacific Market Y-o-Y Growth Comparison by Modality, 2025-2035
  • Figure 78: South Asia and Pacific Market Attractiveness Analysis by Modality
  • Figure 79: South Asia and Pacific Market Value Share and BPS Analysis by End Users, 2025 and 2035
  • Figure 80: South Asia and Pacific Market Y-o-Y Growth Comparison by End Users, 2025-2035
  • Figure 81: South Asia and Pacific Market Attractiveness Analysis by End Users
  • Figure 82: Middle East & Africa Market Value Share and BPS Analysis by Country, 2025 and 2035
  • Figure 83: Middle East & Africa Market Value Share and BPS Analysis by Technology , 2025 and 2035
  • Figure 84: Middle East & Africa Market Y-o-Y Growth Comparison by Technology , 2025-2035
  • Figure 85: Middle East & Africa Market Attractiveness Analysis by Technology
  • Figure 86: Middle East & Africa Market Value Share and BPS Analysis by Modality, 2025 and 2035
  • Figure 87: Middle East & Africa Market Y-o-Y Growth Comparison by Modality, 2025-2035
  • Figure 88: Middle East & Africa Market Attractiveness Analysis by Modality
  • Figure 89: Middle East & Africa Market Value Share and BPS Analysis by End Users, 2025 and 2035
  • Figure 90: Middle East & Africa Market Y-o-Y Growth Comparison by End Users, 2025-2035
  • Figure 91: Middle East & Africa Market Attractiveness Analysis by End Users
  • Figure 92: Global Market - Tier Structure Analysis
  • Figure 93: Global Market - Company Share Analysis

Frequently Asked Questions

How big is the transient elastography device market in 2025?

The global transient elastography device market is estimated to be valued at USD 483.8 million in 2025.

What will be the size of transient elastography device market in 2035?

The market size for the transient elastography device market is projected to reach USD 997.0 million by 2035.

How much will be the transient elastography device market growth between 2025 and 2035?

The transient elastography device market is expected to grow at a 7.5% CAGR between 2025 and 2035.

What are the key product types in the transient elastography device market?

The key product types in transient elastography device market are vcte – vibration controlled transient elastography and cap – controlled attenuation parameter.

Which modality segment to contribute significant share in the transient elastography device market in 2025?

In terms of modality, standalone devices segment to command 61.4% share in the transient elastography device market in 2025.

Explore Similar Insights

Future Market Insights

Transient Elastography Device Market

Chat With MaRIA

Chat With

MaRIA

Hi There, I am MaRIA, Your Market Research Intelligence Assistant. How may I help you?