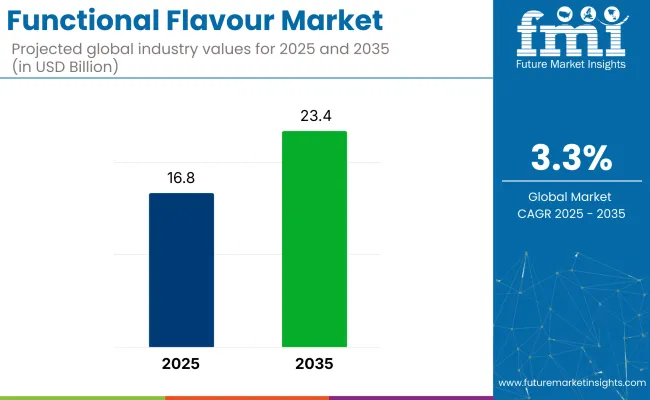
The functional flavour market is estimated to be valued at USD 16.8 billion in 2025 and is projected to reach USD 23.4 billion by 2035, expanding at a CAGR of 3.3% during the forecast period. This growth reflects the continued shift in consumer behavior toward food and beverage products that not only taste appealing but also offer physiological and health-related advantages.

| Attribute | Value |
|---|---|
| Industry Value (2025) | USD 16.8 billion |
| Industry Value (2035) | USD 23.4 billion |
| CAGR (2025 to 2035) | 3.3% |
Functional flavours, formulated with bioactive compounds, are being used to enhance sensory appeal while delivering added nutritional or therapeutic benefits. These include ingredients such as botanical extracts, probiotics, adaptogens, and antioxidants, which are increasingly embedded into everyday consumables.
The industry register varying proportions across its five parent markets. Within the functional food and beverage market, it represents an estimated 7-9% share, largely due to its integration in health-positioned snacks, beverages, and dairy. In the nutraceutical ingredients space, its contribution is lower, around 3-4%, as active compounds dominate formulations.
Within the broader food additives and ingredients market, functional flavours hold about 5-6% share, driven by demand for flavor systems with added physiological roles. In clean label ingredients, it constitutes 6-7%, due to alignment with transparency and wellness claims.
Within botanical extracts, share is modest at 2-3%, reflecting its use primarily for taste-masking and aroma enhancement rather than core therapeutic function. These shares highlight its hybrid identity across nutrition and sensory domains.
Flavor companies are now developing recipes that address taste and health benefits in a single step. Using AI tools, they map natural flavor molecules that naturally appear with active compounds in botanicals. This lets them use ingredients such as licorice glabridin or schisandralignans for both flavor and function, removing the need for extra masking agents.
Pilot runs in Poland and Japan show the approach can cut development time by roughly 22% and lower ingredient costs by 8-11%. As more firms adopt this combined method, flavor houses are shifting from basic taste suppliers to full-service partners that help food and beverage brands deliver both sensory appeal and proven bioactivity.
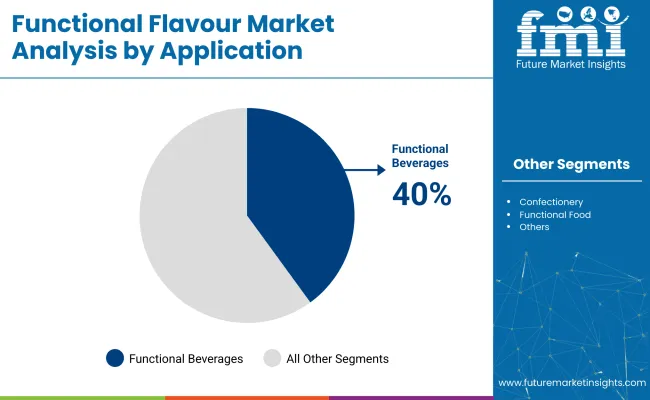
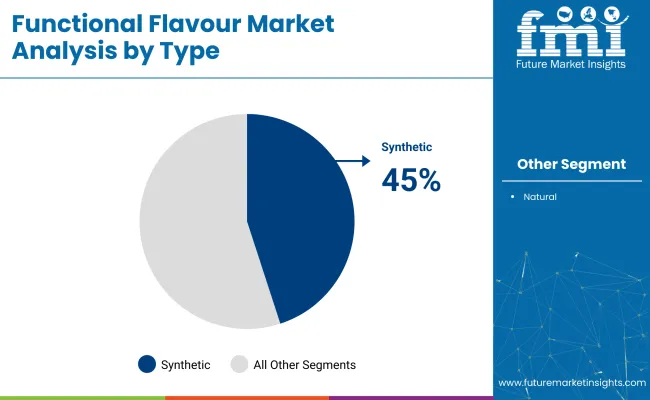
Functional beverages lead the application segment due to their everyday usability, portability, and compatibility with clean-label preferences. Synthetic flavours dominate by offering formulation stability, cost efficiency, and consistent taste across large-scale production, especially in fortified products.

Functional beverages are expected to account for 40% of the functional flavor market in 2025, driven by their alignment with existing consumer habits. Unlike supplements or fortified foods that may require new routines, drinks like vitamin waters, kombucha, and protein shakes are already embedded in daily consumption.
Younger consumers are fueling growth, seeking portable formats with natural ingredients and clean labels. Functional beverages also offer strong flexibility-whether carbonated, dairy-based, plant-based, or ready-to-drink-giving producers the ability to target a wide range of dietary and lifestyle needs. This adaptability has made the category a key outlet for flavor innovation and wellness positioning.

Synthetic flavors are projected to hold over 45% of the market share in 2025, supported by their cost control, precision, and reliability. Unlike natural options, which often face sourcing issues and flavor variation, synthetic compounds provide steady results and extended shelf stability.
This predictability is especially important for large-scale manufacturers where flavor consistency across batches builds brand loyalty. Synthetic options also withstand challenging formulation conditions involving temperature shifts, pH changes, or exposure to light, making them well suited for fortified or processed functional products that carry added formulation complexity.
Functional flavor development is undergoing a shift as health goals increasingly influence how taste is evaluated and applied in product formulations. Alongside this, synthetic flavors are gaining ground due to their reliability, especially in fortified and complex food systems.
Shifting Health Perceptions Redefining Flavor Expectations
Consumer expectations are moving beyond taste, with flavor now seen as part of the wellness equation. As people associate food and beverages with daily health management, flavorprofiles must support the function of added ingredients such as adaptogens, probiotics, or herbal compounds.
This shift is pressuring formulators to build flavors that not only taste good but also work well with these active components. As wellness becomes part of mainstream routines, flavor systems are being retooled to reflect these new preferences.
Supply Chain Stability Driving Synthetic Ingredient Dependence
Instability in the natural flavor supply chain-ranging from sourcing disruptions to inconsistent quality-has led to stronger use of synthetic alternatives. Synthetic flavors offer consistent results under varying conditions, including heat and pH shifts, making them essential in fortified and processed applications.
For global producers, batch-to-batch uniformity is critical, and synthetics deliver that reliability at scale. This shift is changing the conversation around natural versus synthetic, with many now seeing synthetics as a practical solution for ensuring product integrity and performance.

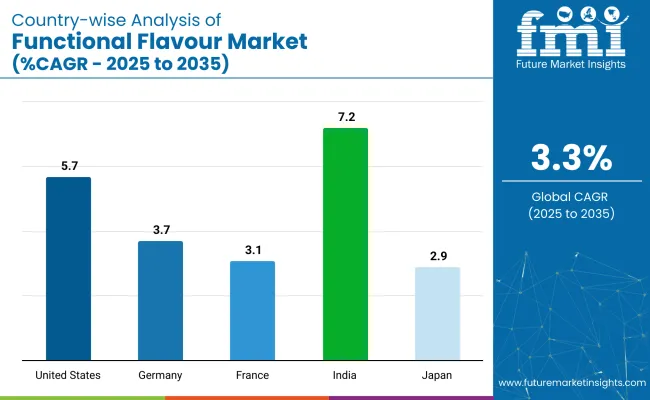
The report covers a detailed analysis of 40+ countries and the top five countries have been shared as a reference.
| Countries | CAGR (2025 to 2035) |
|---|---|
| United States | 3.1% |
| Germany | 3.7% |
| France | 2.5% |
| Japan | 2.5% |
| India | 7.2% |
India and the United States, both recording a 7.2% CAGR between 2025 and 2035, show rapid expansion in functional-flavour development, though driven by distinct factors. In India, growth is fueled by the rising use of Ayurvedic botanicals and plant-based formulations marketed through D2C platforms. USA growth is being shaped by high consumer uptake of performance-focused beverages featuring nootropics and immunity-supporting ingredients.
Germany’s 3.7% CAGR reflects a demand for scientifically validated functional profiles, particularly in dairy-based applications with probiotic flavour blends. France, growing at 2.5%, is witnessing around indulgent low-sugar formats using subtle botanical flavours in teas and bakery.
Japan, with a 2.5% CAGR, sees its market defined by ageing-related health needs, with matcha and yuzu-infused collagen beverages gaining popularity. While India belongs to BRICS, the USA, Germany, France, and Japan are part of the OECD, reflecting differences in both policy and nutritional drivers across these economies.
The USA functional flavour market is estimated to grow at 3.1% CAGR during the forecast period. The market is expanding due to strong consumer preference for functional beverages that support immune health, mental clarity, and digestive balance. USA food and beverage manufacturers are prioritizing R&D in functional formulations that deliver recognizable benefits without compromising flavor.
Clean-label movement has led to deeper integration of adaptogens, probiotics, and vitamin-enriched flavor blends, especially in sports drinks and wellness-focused RTD beverages. Major retailers now dedicate shelf space to functional lines across beverage, dairy, and snack categories, reinforcing their mainstream status. The rise of natural sweeteners and botanical infusions is also reshaping product design across age groups.
The Germany functional flavour market is projected to expand at 3.7% CAGR over the forecast period. Strong regulations around health claims and clean-label compliance are shaping the way products are developed and approved.
In Germany, functional product success is tightly linked to ingredient traceability, scientific backing, and perceived efficacy, especially in dairy and fermented beverages. Consumer trust plays a vital role, making transparency around sourcing and composition critical. German food innovators are focusing on flavors that support digestive and cognitive functions, often derived from botanicals and citrus combinations.
Traditional herbal wellness knowledge is also influencing the integration of elderflower, ginger, and chamomile in beverages and snacks. Functional flavour growth is further supported by established health food chains and premium supermarket formats.
The India functional flavour market is forecast to grow at a 7.2% CAGR during the forecast period. India’s demand surge is being driven by a health-aware urban consumer base increasingly turning to fortified drinks, flavored yogurts, and Ayurvedic-inspired functional foods. Flavor systems in India must adapt to regional preferences while still incorporating functional ingredients such as ashwagandha, tulsi, and amla.
The dominance of vegetarian diets has also prompted product reformulation where plant-based flavors with health claims find higher acceptance. E-commerce penetration and the rise of D2C wellness brands have expanded access to niche functional products featuring immunity-enhancing and energy-supporting attributes. The market’s responsiveness to natural and herbal flavors enables rapid product cycles tailored to preventive health themes.
The France functional flavour market is expected to register a CAGR of around 2.5% through the study period. Consumer affinity for premium food and beverage experiences, when combined with rising health awareness, is fueling demand for products that are both indulgent and beneficial. French manufacturers are focusing on flavors that combine mood-enhancing and gut-friendly ingredients, particularly in functional teas, dairy, and bakery products.
Regulatory emphasis on sugar and fat reduction has intensified the need for flavor that compensates for reformulated nutritional profiles. The French palate favors subtler botanical and floral notes, like lavender, hibiscus, and bergamot, which are now being fused with probiotics and nootropics to elevate everyday products. Artisanal positioning and origin-focused branding also play a strong role in functional product appeal.
The Japan functional flavour market is projected to expand at a 2.5% CAGR during the forecast timeline. Japan’s aging population and focus on longevity have made functional food and beverage development a national priority. The market is characterized by high consumer familiarity with nutraceutical concepts, allowing rapid adoption of fortified beverages and health-supporting confectionery.
Japanese consumers favor flavors that suggest balance, clarity, and freshness, such as yuzu, matcha, and mint, frequently enhanced with functional agents like collagen, hyaluronic acid, and dietary fiber. RTD teas, flavored waters, and vitamin jellies dominate pipelines. The cultural emphasis on umami also influences flavor pairing, allowing functional profiles to blend seamlessly into traditional dietary patterns.
Ungerer Limited, Frutarom Industries Ltd, and Wild Flavors and Specialty Ingredients focus on application-specific blends suited to regional consumer preferences. Firmenich SA and Symrise AG are refining flavor systems enhanced with botanical and functional actives, while Excellentia International is expanding its reach through clean-label formulations. Takasago International Corporation and Sensient Technologies Corporation are investing in both synthetic and nature-derived solutions that adapt to different product formats.
Smaller firms continue to add competitive pressure through regionally tailored R&D. In 2025, synthetic flavors accounted for over 45% of market share due to their consistency, thermal stability, and reliable behavior alongside active ingredients. This makes them the preferred choice for manufacturers of fortified drinks, supplements, and functional snacks aiming for scalable, stable, and compliant formulation
Recent Functional Flavour Industry News
| Report Attributes | Details |
|---|---|
| Market Size (2025) | USD 16.8 billion |
| Projected Market Size (2035) | USD 23.4 billion |
| CAGR (2025 to 2035) | 3.3% |
| Base Year for Estimation | 2024 |
| Historical Period | 2020 to 2024 |
| Projections Period | 2025 to 2035 |
| Quantitative Units | USD billion for value |
| Application Analyzed (Segment 1) | Functional Beverages, Confectionery, Functional Food, Bakery, Dairy Product, aAnd Others (Soups, Condiments, Sauces, and Dressings). |
| Type Analyzed (Segment 2) | Synthetic Flavours (Citrus Flavour, Savoury Flavour, Fruit Flavour, and Others), and Natural Flavours (Essential Oils, Aroma Chemical, and Botanical Extract). |
| Regions Covered | North America, Europe, Asia Pacific, Middle East & Africa, Latin America |
| Countries Covered | United States, Canada, Germany, United Kingdom, France, Italy, Spain, China, Japan, South Korea, India, Australia, Brazil, Mexico, Argentina, Saudi Arabia, UAE, South Africa |
| Key Players | Ungerer Limited, Frutarom Industries Ltd, Wild Flavors and Specialty Ingredients, Excellentia International, Firmenich SA, Symrise AG, Takasago International Corporation, Sensient Technologies Corporation. |
| Additional Attributes | Dollar sales, share, application-wise demand, regional growth hotspots, emerging functional ingredients, consumer taste trends, pricing benchmarks, regulatory shifts, supply chain risks, competitive positioning, R&D focus areas, channel performance. |
The industry finds applications in Functional beverages, confectionery, functional food, bakery, dairy product, and others (soups, condiments, sauces, and dressings).
The industry is segmented into synthetic flavours (citrus flavour, savoury flavour, fruit flavour, and others), and natural flavours (essential oils, aroma chemical, and botanical extract).
The industry covers regions including North America, Europe, Asia Pacific, Latin America, and the Middle East & Africa.
The industry is valued at USD 16.8 billion in 2025.
It is forecasted to reach USD 23.4 billion by 2035.
The industry is anticipated to grow at a CAGR of 3.3% during this period.
Synthetic Flavours are projected to lead the market with a 45% share in 2025.
Asia Pacific, particularly India, is expected to be the key growth region with a projected growth rate of 7.2%.


Our Research Products

The "Full Research Suite" delivers actionable market intel, deep dives on markets or technologies, so clients act faster, cut risk, and unlock growth.

The Leaderboard benchmarks and ranks top vendors, classifying them as Established Leaders, Leading Challengers, or Disruptors & Challengers.

Locates where complements amplify value and substitutes erode it, forecasting net impact by horizon

We deliver granular, decision-grade intel: market sizing, 5-year forecasts, pricing, adoption, usage, revenue, and operational KPIs—plus competitor tracking, regulation, and value chains—across 60 countries broadly.

Spot the shifts before they hit your P&L. We track inflection points, adoption curves, pricing moves, and ecosystem plays to show where demand is heading, why it is changing, and what to do next across high-growth markets and disruptive tech

Real-time reads of user behavior. We track shifting priorities, perceptions of today’s and next-gen services, and provider experience, then pace how fast tech moves from trial to adoption, blending buyer, consumer, and channel inputs with social signals (#WhySwitch, #UX).

Partner with our analyst team to build a custom report designed around your business priorities. From analysing market trends to assessing competitors or crafting bespoke datasets, we tailor insights to your needs.
Supplier Intelligence
Discovery & Profiling
Capacity & Footprint
Performance & Risk
Compliance & Governance
Commercial Readiness
Who Supplies Whom
Scorecards & Shortlists
Playbooks & Docs
Category Intelligence
Definition & Scope
Demand & Use Cases
Cost Drivers
Market Structure
Supply Chain Map
Trade & Policy
Operating Norms
Deliverables
Buyer Intelligence
Account Basics
Spend & Scope
Procurement Model
Vendor Requirements
Terms & Policies
Entry Strategy
Pain Points & Triggers
Outputs
Pricing Analysis
Benchmarks
Trends
Should-Cost
Indexation
Landed Cost
Commercial Terms
Deliverables
Brand Analysis
Positioning & Value Prop
Share & Presence
Customer Evidence
Go-to-Market
Digital & Reputation
Compliance & Trust
KPIs & Gaps
Outputs
Full Research Suite comprises of:
Market outlook & trends analysis
Interviews & case studies
Strategic recommendations
Vendor profiles & capabilities analysis
5-year forecasts
8 regions and 60+ country-level data splits
Market segment data splits
12 months of continuous data updates
DELIVERED AS:
PDF EXCEL ONLINE
Demand for Functional Flavour in USA Size and Share Forecast Outlook 2025 to 2035
Demand for Functional Flavour in Japan Size and Share Forecast Outlook 2025 to 2035
Functional Multi-Layer Coextruded Film Market Size and Share Forecast Outlook 2025 to 2035
Functional Plating Chemicals Market Size and Share Forecast Outlook 2025 to 2035
Functional Flours Market Size and Share Forecast Outlook 2025 to 2035
Functional Flour Market Size and Share Forecast Outlook 2025 to 2035
Functional Endoscopic Sinus Surgery Systems Market Size and Share Forecast Outlook 2025 to 2035
Functional Foods Market Size and Share Forecast Outlook 2025 to 2035
Functional Safety Market Size and Share Forecast Outlook 2025 to 2035
Functional Printing Market Size and Share Forecast Outlook 2025 to 2035
Functional Seafood Market Size and Share Forecast Outlook 2025 to 2035
Functional Textile Finishing Agents Market Size and Share Forecast Outlook 2025 to 2035
Functional Water Market Size and Share Forecast Outlook 2025 to 2035
Functional Pet Ingredients Market Analysis - Size, Share, and Forecast Outlook 2025 to 2035
Functional Cosmetic Ingredients Market Size and Share Forecast Outlook 2025 to 2035
Functional Food Ingredients Market Analysis – Size, Share, and Forecast Outlook 2025 to 2035
Functional Extracts Market Analysis – Size, Share, & Forecast Outlook 2025 to 2035
Functional Chewing Gum Market Analysis - Size, Share, & Forecast Outlook 2025 to 2035
Functional Carbohydrate Market Analysis -Size, Share, & Forecast Outlook 2025 to 2035
Functional Mushroom Market Size, Growth, and Forecast for 2025 to 2035

Thank you!
You will receive an email from our Business Development Manager. Please be sure to check your SPAM/JUNK folder too.
Chat With
MaRIA