Functional Extracts Market Size and Share Forecast Outlook 2025 to 2035

The functional extracts market is valued at USD 86.9 billion in 2025 and is projected to reach USD 174.2 billion by 2035. This market is expected to grow at a CAGR of 7.2% across the period.
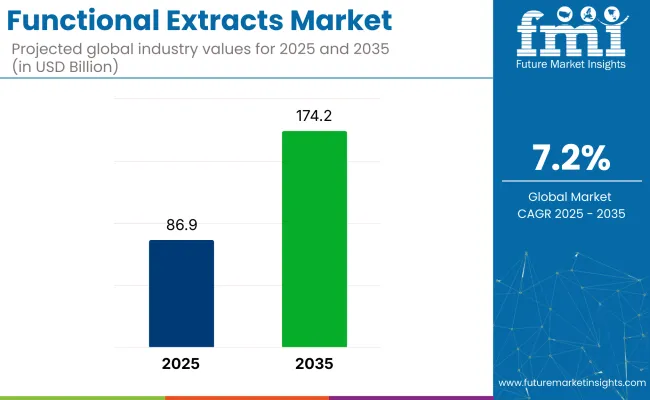
Quick Stats of Functional Extracts Market

  • Market Value (2025): USD 86.9 billion
  • Forecast Value (2035): USD 174.2 billion
  • Forecast CAGR (2025 to 2035): 7.2%
  • Leading Segment in 2025: Plant-based (58.3% share)
  • Key Growth Region: Asia Pacific (India is the fastest growing market with 8.2% CAGR)
  • Key Players: Archer Daniels Midland Company (ADM), Cargill, Incorporated, Kerry Group, Ingredion Incorporated, Givaudan SA, Ashland Global Holdings Inc., BASF SE, Kemin Industries, Inc., Dupont de Nemours, Inc., Sensient Technologies Corporation, Novonesis, Synthite Industries Pvt Ltd, Corbion N.V., International Flavors & Fragrances (IFF), Lonza Group AG, and others.

Functional Extracts Market

Attribute Value
Industry Value (2025) USD 86.9 billion
Industry Value (2035) USD 174.2 billion
CAGR (2025 to 2035) 7.2%

Growth has been observed within nutraceuticals, food and beverage formulations, personal care products, and veterinary nutrition, where botanical, animal, and microbial derivatives are being adopted for targeted physiological effects.

Global trade patterns, supply-chain integration, and contract extraction services have been reorganized to match expanding application sets and evolving regulatory oversight. Investment has been directed toward scalable bioprocessing and solvent-free techniques to meet rising safety and purity benchmarks.

The functional extracts market register 32% of the functional food ingredients market, 28% of the nutraceutical ingredients market, and 24% of the herbal and botanical extracts market in 2025. Within the pharmaceutical excipients segment, functional extracts held a smaller 11% share due to strict compliance demands. In the specialty chemicals category, it represented close to 6%, limited by its niche positioning relative to broader industrial applications.

This distribution reflects the convergence of products across multiple application domains, driven by rising demand for bioactive, natural, and health-targeted ingredients. As multifunctional roles of extracts expand in foods, supplements, and therapeutics, their cross-category presence is expected to strengthen, particularly in markets aligned with wellness, clean label preferences, and plant-derived formulations.

Biorefineries that once focused on oleoresin spice concentrates are now leasing night-shift capacity to cannabidiol processors, allowing the same supercritical CO₂ compressors to run close to 22-hour duty cycles.

This cross-category asset pooling has lifted utilization from 54% to 88% and cut per-kilogram extraction energy costs for curcumin, lutein, and rosmarinic-acid fractions by 17%. Spent hemp biomass left after cannabinoid stripping is being pyro-activated onsite and repurposed as a low-ash filtration aid that replaces imported diatomaceous earth in downstream clarifiers.

Analysis of Functional Extracts Market by Top Investment Segments 

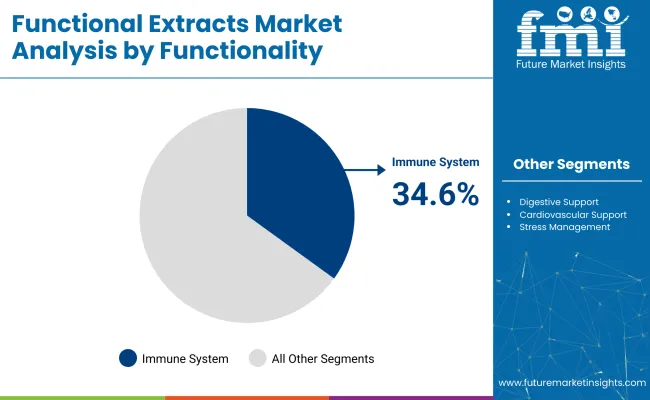
Plant-based extracts captured 58.3% of 2025 functional-extract sales, with immune-support formulations accounting for 34.6%. Solvent extraction supplied 41.2% of output, and food-and-beverage lines absorbed 36.8%, showing consumer preference for clean-label botanicals and the cost efficiency of established production methods.
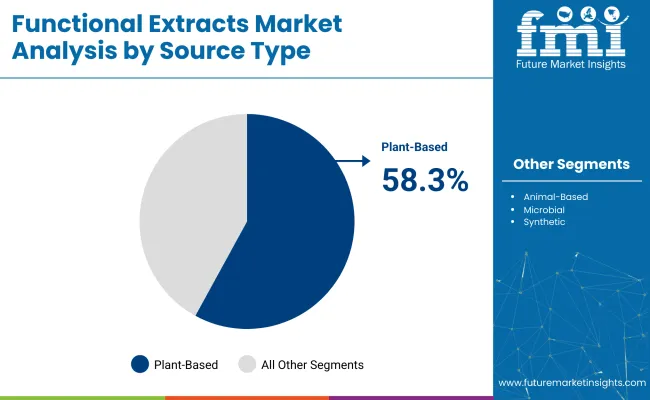
By Source Type, Plant-based Segment Accounts for Over 58.3% Share

Functional Extracts Market By Source Type

Plant-based extracts accounted for 58.3% of the functional extracts market in 2025, driven by their alignment with evolving consumer expectations, flexible regulatory acceptance, and ease of integration across food, supplement, and personal care formulations.
  • The demand increases for clean-label, minimally processed inputs, botanical extracts are being favored for their natural appeal and multi-functional efficacy.
  • The wide availability of plant-derived bioactives such as polyphenols, flavonoids, and terpenoids supports targeted applications in immunity, digestion, and inflammation.
  • Manufacturers continue to scale production using solvent-free extraction and membrane technologies, reinforcing supply chain reliability and product consistency while displacing reliance on synthetic and animal-derived alternatives.

Immune System to Lead the Functionality Segment with 34.6% Share

Functional Extracts Market By Functionality

Immune system support emerged as the leading functionality segment within the functional extracts market, holding a 34.6% share in 2025.

  • The segment's dominance is rooted in the sustained demand for immunity-boosting ingredients following the COVID-19 pandemic, which reshaped consumer health priorities globally.
  • A heightened awareness of long-term preventive care led both manufacturers and formulators to prioritize extracts such as echinacea, elderberry, and andrographis known for immunomodulatory properties.
  • The segment also benefited from accelerated clinical research, which validated the efficacy of certain plant-based actives in supporting innate and adaptive immune responses.

Solvent Extraction Dominate Extraction Method Segment

Solvent extraction held the leading position among extraction methods in the functional extracts market, accounting for 41.2% of total value. Its dominance stems from its long-standing industrial adoption, cost-efficiency, and compatibility with a wide range of plant, animal, and microbial sources.

  • Solvent extraction enables high-yield recovery of bioactive compounds, particularly polyphenols, alkaloids, and lipids, making it a preferred technique for mass-scale production.
  • While newer methods like supercritical fluid extraction offer cleaner profiles, their high capital costs and technical complexity have limited widespread adoption, especially among mid-sized manufacturers.
  • Solvent extraction remains especially prevalent in regions such as Asia and Latin America, where traditional herbal systems are industrialized and raw material sourcing is abundant, supporting steady output volumes at competitive price points.

Rising Product Demand in Food and Beverages with 36.8% Share

The food and beverage segment led the functional extracts market with a 36.8% share, driven by expanding integration of natural bioactives into mainstream consumer diets.

  • Functional extracts have been widely adopted in beverages, dairy, snacks, and meal replacements to deliver health benefits such as digestive support, immune enhancement, and metabolic balance without altering taste or texture.
  • Rising interest in everyday wellness has prompted brands to incorporate plant-based extracts like green tea, turmeric, and ginseng into ready-to-consumer products.
  • Regulatory approval of certain extracts as Generally Recognized as Safe (GRAS) has further encouraged adoption.

Top Functional Extracts Market Dynamics

Functional extracts are gaining momentum as validated health claims and clearer regulatory paths bring botanical ingredients into mainstream product lines. Improvements in extraction technologies are making supply more reliable by boosting yield and reducing cost, giving manufacturers better control over formulation inputs and output quality.

Botanical Ingredient Credibility Drives Consumer Uptake

Consumer confidence in botanical ingredients is rising, supported by peer-reviewed studies and growing regulatory approval. A 2024 study found that 300 mg of standardized ashwagandha reduced cortisol levels by 22% over eight weeks, reinforcing its use in stress management.

At the same time, GRAS approvals increased by 13% in 2025, helping ingredients like turmeric, elderberry, and ginseng move into global markets more easily. Large food and beverage companies have expanded their use of polyphenol-rich extracts, with product line extensions rising 19%. As a result, botanicals are now part of everyday functional foods, not just niche health items.

Extraction Method Shifts Reduce Production Volatility

Changes in extraction processes are making production more efficient and stable. In Vietnam, enzymatic methods recovered 16% more flavonoids from citrus peels and used 12% less energy than solvents. Cold-press hubs in Hungary cut processing time by 11% while improving oil quality.

BASF’s pilot using hybrid supercritical CO₂ showed a 23% increase in curcuminoid strength and cut post-processing needs by two-thirds. These advances are drawing interest from mid-size manufacturers looking to manage input costs and maintain consistent bioactive profiles without raising energy use.
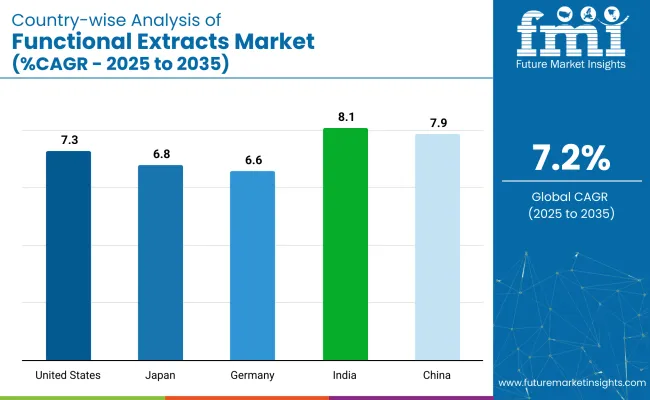
Analysis of Top Countries Manufacturing, Exporting and Supplying Functional Extracts Globally

Country Wise Analysis Of Functional Extracts Market

The report covers a detailed analysis of 40+ countries and the top five countries have been shared as a reference.

Countries CAGR (2025 to 2035)
United States 7.3%
China 7.9%
Germany 6.6%
Japan 6.8%
India 8.1%

Functional extracts markets across key economies are advancing at varied paces, shaped by unique regulatory models, cultural frameworks, and consumer behaviors. India, recording the highest CAGR at 8.1%, is leveraging its deep-rooted Ayurvedic heritage, where traditional botanicals like tulsi and ashwagandha are being reformulated into modern delivery systems under government-supported GMP protocols, positioning the country as both a BRICS demand center and a global exporter.

China, also in the BRICS group, follows closely with 7.9% growth, fueled by the modernization of Traditional Chinese Medicine and strong integration of extracts into e-commerce and performance nutrition. In OECD economies, the USA market is expanding at 7.3%, where clinical validation and regulatory clarity under GRAS are allowing functional extracts to scale in beverages, snacks, and supplements.

Japan, growing at 6.8%, continues to rely on its FOSHU certification model, favoring high-bioavailability extracts in meal-integrated formats. Germany, with a 6.6% CAGR, is focusing on standardized botanical purity, where pharmacy-based distribution dominates and consumer trust hinges on risk-assessed claims aligned with EFSA oversight.

Demand for Functional Extracts in the USA is set to record a CAGR of 7.3%

The USA functional extracts market is projected to expand at a CAGR of 7.3% from 2025 to 2035. This growth is being supported by a shift toward integrative health practices, where consumers increasingly seek natural alternatives to pharmaceuticals for chronic stress, fatigue, and immunity.

The USA Food and Drug Administration’s structured approach to GRAS certifications and dietary supplement regulation has made the country a reliable environment for clinical-grade botanical extract integration. Consumer awareness has also risen through direct-to-consumer brands leveraging transparent sourcing and formulation science. Functional extracts are now embedded in clean-label energy drinks, fortified snacks, and over-the-counter stress relief aids, creating volume across both mainstream retail and health-specialty outlets.

  • USA brands emphasize traceable sourcing, substantiated health claims, and clinically-backed dosages.
  • GRAS and DSHEA frameworks provide regulatory clarity for product launches.
  • Growing adoption across wellness beverages, mood support, and daily immunity applications.

China Functional Extracts Market Analysis

China’s functional extracts sector is forecast to grow at a CAGR of 7.9% through 2035. The surge is driven by a fusion of traditional Chinese medicine (TCM) principles with modern extraction science. Chinese consumers are increasingly demanding functional food formats featuring goji berry, ginseng, and cordyceps extracts, particularly for metabolic health, anti-fatigue, and circulation.

Government policies have promoted the standardization of herbal raw materials under the National Administration of Traditional Chinese Medicine, enabling stable output for both domestic and international consumption. Cross-border e-commerce platforms and health apps have further popularized evidence-based herbal formulations among younger consumers seeking non-pharmaceutical interventions for performance and vitality.

  • Government-backed modernization of TCM enhances extract standardization.
  • Premium segments are being led by fatigue relief, beauty-from-within, and gut health SKUs.
  • Digital health platforms drive demand for convenient, functional formulations.

Functional Extracts Demand Analysis in Germany

Germany’s functional extracts market is expected to register a CAGR of 6.6% during the analysis period. Local demand is rising from nutraceutical and personal care sectors that are increasingly using standardized botanical ingredients with proven health outcomes. Germany’s Federal Institute for Risk Assessment (BfR) and EFSA guidelines have prompted a shift toward clinically substantiated, pure-extract-based products, especially in sleep, digestion, and cognitive segments.

The domestic population is favoring preventive approaches to aging and chronic inflammation, driving incorporation of polyphenol-rich extracts in everyday foods and functional cosmetics. German pharmacies and apothecaries are key distribution points, offering capsules, tonics, and powders formulated with adaptogens, nootropics, and flavonoid complexes.

  • Regulatory emphasis has pushed manufacturers toward high-purity, standardized botanicals.
  • Pharmacy-based distribution supports adoption among health-conscious seniors.
  • Extracts for skin health, memory, and digestion are experiencing strong retail turnover.

Sales of Functional Extracts in Japan are likely to grow at a CAGR of 6.8%

Japan’s functional extracts market is anticipated to rise at a CAGR of 6.8% through 2035. Growth is anchored by the nation’s structured Foods for Specified Health Use (FOSHU) system, which has cultivated consumer trust in functionally labeled products. Japanese companies have invested in precision extraction techniques such as enzymatic and supercritical methods to preserve the integrity of active ingredients like catechins, astaxanthin, and fucoidan.

Domestic consumers are highly receptive to plant-derived ingredients integrated into daily routines via fortified teas, soups, and wellness capsules. As lifestyle-related conditions such as fatigue, gut health, and stress remain top concerns, extract blends that promise multi-functional health outcomes are securing shelf space in convenience stores, pharmacies, and department stores.

  • Japan’s FOSHU system provides strong endorsement of scientifically validated health benefits.
  • Manufacturers prioritize ingredient synergy and bioavailability enhancement techniques.
  • Functional teas, shots, and meal additives serve as daily delivery vehicles for extracts.

Functional Extracts Sales Analysis in India

India’s functional extracts industry is estimated to grow at a CAGR of 8.1% between 2025 and 2035. This momentum is driven by the integration of Ayurvedic formulations into mass-market food and health products.

Consumer acceptance of herbal remedies has long been entrenched, but the shift toward modernized formats, such as sachets, capsules, and flavored drinks, is expanding the use of extracts like tulsi, ashwagandha, and giloy.

Backed by the Ministry of AYUSH and industry players investing in standardized extraction protocols, India is now a major export hub for botanical actives. Domestic demand is also surging due to rising middle-class incomes and increasing use of preventive health regimens across urban centers.

  • Traditional Ayurveda is being re-engineered into consumer-friendly functional formats.
  • Government incentives are supporting GMP-certified botanical extract facilities.
  • Urban consumers are embracing adaptogens for fatigue, sleep, and immunity solutions.

Leading Functional Extracts Suppliers

Archer Daniels Midland Company (ADM), Cargill, Incorporated, Kerry Group, Ingredion Incorporated, Givaudan SA, Ashland Global Holdings Inc., BASF SE, Kemin Industries, Inc., Dupont de Nemours, Inc., Sensient Technologies Corporation, Novonesis, Synthite Industries Pvt Ltd, Corbion N.V., International Flavors & Fragrances (IFF), Lonza Group AG, and others.

ADM, Kerry Group, and Givaudan are among the leading players, leveraging vertical integration and advanced extraction capabilities to serve global nutraceutical, food, and personal care industries. These firms focus on standardized botanical compounds, regulatory-compliant formulations, and clinical substantiation to meet rising demand. In cold-pressed and supercritical CO₂ extraction, combined with strategic partnerships for clean-label product development, has enabled these companies to strengthen their foothold across both developed and emerging markets.

Recent Functional Extracts Industry News

  • In April 2025, ADM announced targeted actions to deliver USD 500-750 million in cost savings over the next several years as part of a broader strategy to improve operational performance and simplify its portfolio.

Leading Players

  • Archer Daniels Midland Company (ADM)
  • Cargill, Incorporated
  • Kerry Group
  • Ingredion Incorporated
  • Givaudan SA
  • Ashland Global Holdings Inc.
  • BASF SE
  • Kemin Industries, Inc.
  • Dupont de Nemours, Inc.
  • Sensient Technologies Corporation
  • Novonesis
  • Synthite Industries Pvt Ltd
  • Corbion N.V.
  • International Flavors & Fragrances (IFF)
  • Lonza Group AG

Report Coverage and Scope Summary

Report Attributes Details
Market Size (2025) USD 86.9 billion
Projected Market Size (2035) USD 174.2 billion
CAGR (2025 to 2035) 7.2%
Base Year for Estimation 2024
Historical Period 2020 to 2024
Projections Period 2025 to 2035
Quantitative Units USD billion for value
Source Type Analyzed (Segment 1) Plant-Based, Animal-Based, Microbial, Synthetic
Functionality Analyzed (Segment 2) Immune System Support, Digestive Support, Energy And Metabolism Support, Cardiovascular Support, Stress Management.
Extraction Method Analyzed (Segment 3) Solvent Extraction, Supercritical Fluid Extraction, Steam Distillation, Cold Pressing, Enzymatic Extraction.
Application Analyzed (Segment 4) Food and Beverage, Nutraceuticals, Pharmaceuticals, Cosmetics and Personal Care, Agriculture and Animal Feed.
Regions Covered North America, Europe, Asia Pacific, Middle East & Africa, Latin America
Countries Covered United States, Canada, Germany, United Kingdom, France, Italy, Spain, China, Japan, South Korea, India, Australia, Brazil, Mexico, Argentina, Saudi Arabia, UAE, South Africa
Key Players Archer Daniels Midland Company (ADM), Cargill, Incorporated, Kerry Group, Ingredion Incorporated, Givaudan SA, Ashland Global Holdings Inc., BASF SE, Kemin Industries, Inc., Dupont de Nemours, Inc., Sensient Technologies Corporation, Novonesis, Synthite Industries Pvt Ltd, Corbion N.V., International Flavors & Fragrances (IFF), Lonza Group AG, and others.
Additional Attributes Dollar sales, share by type and end user, rising demand in post-surgery recovery, growth in sports medicine and physiotherapy sectors, development of eco-friendly and biodegradable cold packs, regional usage variations

Key Segments

By Source Type:

The industry is segmented into plant-based, animal-based, microbial, and synthetic.

By Functionality:

The industry is segmented into immune system support, digestive support, energy and metabolism support, cardiovascular support, and stress management.

By Extraction Method:

The industry finds solvent extraction, supercritical fluid extraction, steam distillation, cold pressing, and enzymatic extraction.

By Application:

The industry is segmented into food and beverage, nutraceuticals, pharmaceuticals, cosmetics and personal care, agriculture and animal feed.

By Region:

The industry covers regions including North America, Europe, Asia Pacific, Latin America, and the Middle East & Africa.

Table of Content

  1. Executive Summary
    • Global Market Outlook
    • Demand-side Trends
    • Supply-side Trends
    • Technology Roadmap Analysis
    • Analysis and Recommendations
  2. Market Overview
    • Market Coverage/Taxonomy
    • Market Definition/Scope/Limitations
  3. Market Background
    • Market Dynamics
      • Drivers
      • Restraints
      • Opportunity
      • Trends
    • Scenario Forecast
      • Demand in Optimistic Scenario
      • Demand in Likely Scenario
      • Demand in Conservative Scenario
    • Opportunity Map Analysis
    • Product Life Cycle Analysis
    • Supply Chain Analysis
      • Supply Side Participants and their Roles
        • Producers
        • Mid-Level Participants (Traders/ Agents/ Brokers)
        • Wholesalers and Distributors
      • Value Added and Value Created at Node in the Supply Chain
      • List of Raw Material Suppliers
      • List of Existing and Potential Buyer’s
    • Investment Feasibility Matrix
    • Value Chain Analysis
      • Profit Margin Analysis
      • Wholesalers and Distributors
      • Retailers
    • PESTLE and Porter’s Analysis
    • Regulatory Landscape
      • By Key Regions
      • By Key Countries
    • Regional Parent Market Outlook
    • Production and Consumption Statistics
    • Import and Export Statistics
  4. Global Market Analysis 2020 to 2024 and Forecast, 2025 to 2035
    • Historical Market Size Value (USD Billion) Analysis, 2020 to 2024
    • Current and Future Market Size Value (USD Billion) Projections, 2025 to 2035
      • Y-o-Y Growth Trend Analysis
      • Absolute $ Opportunity Analysis
  5. Global Market Pricing Analysis 2020 to 2024 and Forecast 2025 to 2035
  6. Global Market Analysis 2020 to 2024 and Forecast 2025 to 2035, By Source Type
    • Introduction/Key Findings
    • Historical Market Size Value (USD Billion) Analysis By Source Type, 2020 to 2024
    • Current and Future Market Size Value (USD Billion) Analysis and Forecast By Source Type, 2025 to 2035
      • Plant-based
      • Animal-based
      • Microbial
      • Synthetic
    • Y-o-Y Growth Trend Analysis By Source Type, 2020 to 2024
    • Absolute $ Opportunity Analysis By Source Type, 2025 to 2035
  7. Global Market Analysis 2020 to 2024 and Forecast 2025 to 2035, By Functionality
    • Introduction/Key Findings
    • Historical Market Size Value (USD Billion) Analysis By Functionality, 2020 to 2024
    • Current and Future Market Size Value (USD Billion) Analysis and Forecast By Functionality, 2025 to 2035
      • Immune System Support
      • Digestive Support
      • Energy & Metabolism Support
      • Cardiovascular Support
      • Stress Management
    • Y-o-Y Growth Trend Analysis By Functionality, 2020 to 2024
    • Absolute $ Opportunity Analysis By Functionality, 2025 to 2035
  8. Global Market Analysis 2020 to 2024 and Forecast 2025 to 2035, By Extraction Method
    • Introduction/Key Findings
    • Historical Market Size Value (USD Billion) Analysis By Extraction Method, 2020 to 2024
    • Current and Future Market Size Value (USD Billion) Analysis and Forecast By Extraction Method, 2025 to 2035
      • Solvent Extraction
      • Supercritical Fluid Extraction
      • Steam Distillation
      • Cold Pressing
      • Enzymatic Extraction
    • Y-o-Y Growth Trend Analysis By Extraction Method, 2020 to 2024
    • Absolute $ Opportunity Analysis By Extraction Method, 2025 to 2035
  9. Global Market Analysis 2020 to 2024 and Forecast 2025 to 2035, By Application
    • Introduction/Key Findings
    • Historical Market Size Value (USD Billion) Analysis By Application, 2020 to 2024
    • Current and Future Market Size Value (USD Billion) Analysis and Forecast By Application, 2025 to 2035
      • Food & Beverage
      • Nutraceuticals
      • Pharmaceuticals
      • Cosmetics & Personal Care
      • Agriculture & Animal Feed
    • Y-o-Y Growth Trend Analysis By Application, 2020 to 2024
    • Absolute $ Opportunity Analysis By Application, 2025 to 2035
  10. Global Market Analysis 2020 to 2024 and Forecast 2025 to 2035, By Region
    • Introduction
    • Historical Market Size Value (USD Billion) Analysis By Region, 2020 to 2024
    • Current Market Size Value (USD Billion) Analysis and Forecast By Region, 2025 to 2035
      • North America
      • Latin America
      • Western Europe
      • Eastern Europe
      • East Asia
      • South Asia & Pacific
      • Middle East and Africa
    • Market Attractiveness Analysis By Region
  11. North America Market Analysis 2020 to 2024 and Forecast 2025 to 2035, By Country
    • Historical Market Size Value (USD Billion) Trend Analysis By Market Taxonomy, 2020 to 2024
    • Market Size Value (USD Billion) Forecast By Market Taxonomy, 2025 to 2035
      • By Country
        • USA
        • Canada
        • Mexico
      • By Source Type
      • By Functionality
      • By Extraction Method
      • By Application
    • Market Attractiveness Analysis
      • By Country
      • By Source Type
      • By Functionality
      • By Extraction Method
      • By Application
    • Key Takeaways
  12. Latin America Market Analysis 2020 to 2024 and Forecast 2025 to 2035, By Country
    • Historical Market Size Value (USD Billion) Trend Analysis By Market Taxonomy, 2020 to 2024
    • Market Size Value (USD Billion) Forecast By Market Taxonomy, 2025 to 2035
      • By Country
        • Brazil
        • Argentina
        • Rest of LATAM
      • By Source Type
      • By Functionality
      • By Extraction Method
      • By Application
    • Market Attractiveness Analysis
      • By Country
      • By Source Type
      • By Functionality
      • By Extraction Method
      • By Application
    • Key Takeaways
  13. Western Europe Market Analysis 2020 to 2024 and Forecast 2025 to 2035, By Country
    • Historical Market Size Value (USD Billion) Trend Analysis By Market Taxonomy, 2020 to 2024
    • Market Size Value (USD Billion) Forecast By Market Taxonomy, 2025 to 2035
      • By Country
        • Germany
        • Italy
        • France
        • UK
        • Spain
        • BENELUX
        • Nordic
        • Rest of W.Europe
      • By Source Type
      • By Functionality
      • By Extraction Method
      • By Application
    • Market Attractiveness Analysis
      • By Country
      • By Source Type
      • By Functionality
      • By Extraction Method
      • By Application
    • Key Takeaways
  14. Eastern Europe Market Analysis 2020 to 2024 and Forecast 2025 to 2035, By Country
    • Historical Market Size Value (USD Billion) Trend Analysis By Market Taxonomy, 2020 to 2024
    • Market Size Value (USD Billion) Forecast By Market Taxonomy, 2025 to 2035
      • By Country
        • Russia
        • Hungary
        • Poland
        • Balkan & Baltics
        • Rest of E. Europe
      • By Source Type
      • By Functionality
      • By Extraction Method
      • By Application
    • Market Attractiveness Analysis
      • By Country
      • By Source Type
      • By Functionality
      • By Extraction Method
      • By Application
    • Key Takeaways
  15. East Asia Market Analysis 2020 to 2024 and Forecast 2025 to 2035, By Country
    • Historical Market Size Value (USD Billion) Trend Analysis By Market Taxonomy, 2020 to 2024
    • Market Size Value (USD Billion) Forecast By Market Taxonomy, 2025 to 2035
      • By Country
        • China
        • Japan
        • South Korea
      • By Source Type
      • By Functionality
      • By Extraction Method
      • By Application
    • Market Attractiveness Analysis
      • By Country
      • By Source Type
      • By Functionality
      • By Extraction Method
      • By Application
    • Key Takeaways
  16. South Asia & Pacific Market Analysis 2020 to 2024 and Forecast 2025 to 2035, By Country
    • Historical Market Size Value (USD Billion) Trend Analysis By Market Taxonomy, 2020 to 2024
    • Market Size Value (USD Billion) Forecast By Market Taxonomy, 2025 to 2035
      • By Country
        • India
        • Australia & New Zealand
        • ASEAN
        • Rest of SAP
      • By Source Type
      • By Functionality
      • By Extraction Method
      • By Application
    • Market Attractiveness Analysis
      • By Country
      • By Source Type
      • By Functionality
      • By Extraction Method
      • By Application
    • Key Takeaways
  17. Middle East and Africa Market Analysis 2020 to 2024 and Forecast 2025 to 2035, By Country
    • Historical Market Size Value (USD Billion) Trend Analysis By Market Taxonomy, 2020 to 2024
    • Market Size Value (USD Billion) Forecast By Market Taxonomy, 2025 to 2035
      • By Country
        • GCC Countries
        • Northern Africa
        • South Africa
        • Turkiye
        • Rest of MEA
      • By Source Type
      • By Functionality
      • By Extraction Method
      • By Application
    • Market Attractiveness Analysis
      • By Country
      • By Source Type
      • By Functionality
      • By Extraction Method
      • By Application
    • Key Takeaways
  18. Key Countries Market Analysis
    • USA
      • Pricing Analysis
      • Market Share Analysis, 2024
        • By Source Type
        • By Functionality
        • By Extraction Method
        • By Application
    • Canada
      • Pricing Analysis
      • Market Share Analysis, 2024
        • By Source Type
        • By Functionality
        • By Extraction Method
        • By Application
    • Brazil
      • Pricing Analysis
      • Market Share Analysis, 2024
        • By Source Type
        • By Functionality
        • By Extraction Method
        • By Application
    • Mexico
      • Pricing Analysis
      • Market Share Analysis, 2024
        • By Source Type
        • By Functionality
        • By Extraction Method
        • By Application
    • Argentina
      • Pricing Analysis
      • Market Share Analysis, 2024
        • By Source Type
        • By Functionality
        • By Extraction Method
        • By Application
  19. Market Structure Analysis
    • Competition Dashboard
    • Competition Benchmarking
    • Market Share Analysis of Top Players
      • By Regional
      • By Source Type
      • By Functionality
      • By Extraction Method
      • By Application
  20. Competition Analysis
    • Competition Deep Dive
      • Archer Daniels Midland Company (ADM)
        • Overview
        • Product Portfolio
        • Profitability by Market Segments (Product/Age /Sales Channel/Region)
        • Sales Footprint
        • Strategy Overview
          • Marketing Strategy
          • Product Strategy
          • Channel Strategy
      • Cargill, Incorporated
        • Overview
        • Product Portfolio
        • Profitability by Market Segments (Product/Age /Sales Channel/Region)
        • Sales Footprint
        • Strategy Overview
          • Marketing Strategy
          • Product Strategy
          • Channel Strategy
      • Kerry Group
        • Overview
        • Product Portfolio
        • Profitability by Market Segments (Product/Age /Sales Channel/Region)
        • Sales Footprint
        • Strategy Overview
          • Marketing Strategy
          • Product Strategy
          • Channel Strategy
      • Ingredion Incorporated
        • Overview
        • Product Portfolio
        • Profitability by Market Segments (Product/Age /Sales Channel/Region)
        • Sales Footprint
        • Strategy Overview
          • Marketing Strategy
          • Product Strategy
          • Channel Strategy
      • Givaudan SA
        • Overview
        • Product Portfolio
        • Profitability by Market Segments (Product/Age /Sales Channel/Region)
        • Sales Footprint
        • Strategy Overview
          • Marketing Strategy
          • Product Strategy
          • Channel Strategy
      • Ashland Global Holdings Inc.
        • Overview
        • Product Portfolio
        • Profitability by Market Segments (Product/Age /Sales Channel/Region)
        • Sales Footprint
        • Strategy Overview
          • Marketing Strategy
          • Product Strategy
          • Channel Strategy
      • BASF SE
        • Overview
        • Product Portfolio
        • Profitability by Market Segments (Product/Age /Sales Channel/Region)
        • Sales Footprint
        • Strategy Overview
          • Marketing Strategy
          • Product Strategy
          • Channel Strategy
      • Kemin Industries, Inc.
        • Overview
        • Product Portfolio
        • Profitability by Market Segments (Product/Age /Sales Channel/Region)
        • Sales Footprint
        • Strategy Overview
          • Marketing Strategy
          • Product Strategy
          • Channel Strategy
      • Dupont de Nemours, Inc.
        • Overview
        • Product Portfolio
        • Profitability by Market Segments (Product/Age /Sales Channel/Region)
        • Sales Footprint
        • Strategy Overview
          • Marketing Strategy
          • Product Strategy
          • Channel Strategy
      • Sensient Technologies Corporation
        • Overview
        • Product Portfolio
        • Profitability by Market Segments (Product/Age /Sales Channel/Region)
        • Sales Footprint
        • Strategy Overview
          • Marketing Strategy
          • Product Strategy
          • Channel Strategy
      • Novonesis
        • Overview
        • Product Portfolio
        • Profitability by Market Segments (Product/Age /Sales Channel/Region)
        • Sales Footprint
        • Strategy Overview
          • Marketing Strategy
          • Product Strategy
          • Channel Strategy
      • Synthite Industries Pvt Ltd
        • Overview
        • Product Portfolio
        • Profitability by Market Segments (Product/Age /Sales Channel/Region)
        • Sales Footprint
        • Strategy Overview
          • Marketing Strategy
          • Product Strategy
          • Channel Strategy
      • Corbion N.V.
        • Overview
        • Product Portfolio
        • Profitability by Market Segments (Product/Age /Sales Channel/Region)
        • Sales Footprint
        • Strategy Overview
          • Marketing Strategy
          • Product Strategy
          • Channel Strategy
      • International Flavors & Fragrances (IFF)
        • Overview
        • Product Portfolio
        • Profitability by Market Segments (Product/Age /Sales Channel/Region)
        • Sales Footprint
        • Strategy Overview
          • Marketing Strategy
          • Product Strategy
          • Channel Strategy
      • Lonza Group AG
        • Overview
        • Product Portfolio
        • Profitability by Market Segments (Product/Age /Sales Channel/Region)
        • Sales Footprint
        • Strategy Overview
          • Marketing Strategy
          • Product Strategy
          • Channel Strategy
      • Others
        • Overview
        • Product Portfolio
        • Profitability by Market Segments (Product/Age /Sales Channel/Region)
        • Sales Footprint
        • Strategy Overview
          • Marketing Strategy
          • Product Strategy
          • Channel Strategy
  21. Assumptions & Acronyms Used
  22. Research Methodology

List of Tables

  • Table 1: Global Market Value (USD Billion) Forecast by Region, 2020-2035
  • Table 2: Global Market Value (USD Billion) Forecast by Source Type, 2020-2035
  • Table 3: Global Market Value (USD Billion) Forecast by Functionality, 2020-2035
  • Table 4: Global Market Value (USD Billion) Forecast by Extraction Method, 2020-2035
  • Table 5: Global Market Value (USD Billion) Forecast by Application, 2020-2035
  • Table 6: North America Market Value (USD Billion) Forecast by Country, 2020-2035
  • Table 7: North America Market Value (USD Billion) Forecast by Source Type, 2020-2035
  • Table 8: North America Market Value (USD Billion) Forecast by Functionality, 2020-2035
  • Table 9: North America Market Value (USD Billion) Forecast by Extraction Method, 2020-2035
  • Table 10: North America Market Value (USD Billion) Forecast by Application, 2020-2035
  • Table 11: Latin America Market Value (USD Billion) Forecast by Country, 2020-2035
  • Table 12: Latin America Market Value (USD Billion) Forecast by Source Type, 2020-2035
  • Table 13: Latin America Market Value (USD Billion) Forecast by Functionality, 2020-2035
  • Table 14: Latin America Market Value (USD Billion) Forecast by Extraction Method, 2020-2035
  • Table 15: Latin America Market Value (USD Billion) Forecast by Application, 2020-2035
  • Table 16: Western Europe Market Value (USD Billion) Forecast by Country, 2020-2035
  • Table 17: Western Europe Market Value (USD Billion) Forecast by Source Type, 2020-2035
  • Table 18: Western Europe Market Value (USD Billion) Forecast by Functionality, 2020-2035
  • Table 19: Western Europe Market Value (USD Billion) Forecast by Extraction Method, 2020-2035
  • Table 20: Western Europe Market Value (USD Billion) Forecast by Application, 2020-2035
  • Table 21: Eastern Europe Market Value (USD Billion) Forecast by Country, 2020-2035
  • Table 22: Eastern Europe Market Value (USD Billion) Forecast by Source Type, 2020-2035
  • Table 23: Eastern Europe Market Value (USD Billion) Forecast by Functionality, 2020-2035
  • Table 24: Eastern Europe Market Value (USD Billion) Forecast by Extraction Method, 2020-2035
  • Table 25: Eastern Europe Market Value (USD Billion) Forecast by Application, 2020-2035
  • Table 26: East Asia Market Value (USD Billion) Forecast by Country, 2020-2035
  • Table 27: East Asia Market Value (USD Billion) Forecast by Source Type, 2020-2035
  • Table 28: East Asia Market Value (USD Billion) Forecast by Functionality, 2020-2035
  • Table 29: East Asia Market Value (USD Billion) Forecast by Extraction Method, 2020-2035
  • Table 30: East Asia Market Value (USD Billion) Forecast by Application, 2020-2035
  • Table 31: South Asia & Pacific Market Value (USD Billion) Forecast by Country, 2020-2035
  • Table 32: South Asia & Pacific Market Value (USD Billion) Forecast by Source Type, 2020-2035
  • Table 33: South Asia & Pacific Market Value (USD Billion) Forecast by Functionality, 2020-2035
  • Table 34: South Asia & Pacific Market Value (USD Billion) Forecast by Extraction Method, 2020-2035
  • Table 35: South Asia & Pacific Market Value (USD Billion) Forecast by Application, 2020-2035
  • Table 36: Middle East and Africa Market Value (USD Billion) Forecast by Country, 2020-2035
  • Table 37: Middle East and Africa Market Value (USD Billion) Forecast by Source Type, 2020-2035
  • Table 38: Middle East and Africa Market Value (USD Billion) Forecast by Functionality, 2020-2035
  • Table 39: Middle East and Africa Market Value (USD Billion) Forecast by Extraction Method, 2020-2035
  • Table 40: Middle East and Africa Market Value (USD Billion) Forecast by Application, 2020-2035

List of Figures

  • Figure 1: Global Market Pricing Analysis
  • Figure 2: Global Market Value (USD Billion) Forecast 2020-2035
  • Figure 3: Global Market Value Share and BPS Analysis by Source Type, 2025 and 2035
  • Figure 4: Global Market Y-o-Y Growth Comparison by Source Type, 2025-2035
  • Figure 5: Global Market Attractiveness Analysis by Source Type
  • Figure 6: Global Market Value Share and BPS Analysis by Functionality, 2025 and 2035
  • Figure 7: Global Market Y-o-Y Growth Comparison by Functionality, 2025-2035
  • Figure 8: Global Market Attractiveness Analysis by Functionality
  • Figure 9: Global Market Value Share and BPS Analysis by Extraction Method, 2025 and 2035
  • Figure 10: Global Market Y-o-Y Growth Comparison by Extraction Method, 2025-2035
  • Figure 11: Global Market Attractiveness Analysis by Extraction Method
  • Figure 12: Global Market Value Share and BPS Analysis by Application, 2025 and 2035
  • Figure 13: Global Market Y-o-Y Growth Comparison by Application, 2025-2035
  • Figure 14: Global Market Attractiveness Analysis by Application
  • Figure 15: Global Market Value (USD Billion) Share and BPS Analysis by Region, 2025 and 2035
  • Figure 16: Global Market Y-o-Y Growth Comparison by Region, 2025-2035
  • Figure 17: Global Market Attractiveness Analysis by Region
  • Figure 18: North America Market Incremental $ Opportunity, 2025-2035
  • Figure 19: Latin America Market Incremental $ Opportunity, 2025-2035
  • Figure 20: Western Europe Market Incremental $ Opportunity, 2025-2035
  • Figure 21: Eastern Europe Market Incremental $ Opportunity, 2025-2035
  • Figure 22: East Asia Market Incremental $ Opportunity, 2025-2035
  • Figure 23: South Asia & Pacific Market Incremental $ Opportunity, 2025-2035
  • Figure 24: Middle East and Africa Market Incremental $ Opportunity, 2025-2035
  • Figure 25: North America Market Value Share and BPS Analysis by Country, 2025 and 2035
  • Figure 26: North America Market Value Share and BPS Analysis by Source Type, 2025 and 2035
  • Figure 27: North America Market Y-o-Y Growth Comparison by Source Type, 2025-2035
  • Figure 28: North America Market Attractiveness Analysis by Source Type
  • Figure 29: North America Market Value Share and BPS Analysis by Functionality, 2025 and 2035
  • Figure 30: North America Market Y-o-Y Growth Comparison by Functionality, 2025-2035
  • Figure 31: North America Market Attractiveness Analysis by Functionality
  • Figure 32: North America Market Value Share and BPS Analysis by Extraction Method, 2025 and 2035
  • Figure 33: North America Market Y-o-Y Growth Comparison by Extraction Method, 2025-2035
  • Figure 34: North America Market Attractiveness Analysis by Extraction Method
  • Figure 35: North America Market Value Share and BPS Analysis by Application, 2025 and 2035
  • Figure 36: North America Market Y-o-Y Growth Comparison by Application, 2025-2035
  • Figure 37: North America Market Attractiveness Analysis by Application
  • Figure 38: Latin America Market Value Share and BPS Analysis by Country, 2025 and 2035
  • Figure 39: Latin America Market Value Share and BPS Analysis by Source Type, 2025 and 2035
  • Figure 40: Latin America Market Y-o-Y Growth Comparison by Source Type, 2025-2035
  • Figure 41: Latin America Market Attractiveness Analysis by Source Type
  • Figure 42: Latin America Market Value Share and BPS Analysis by Functionality, 2025 and 2035
  • Figure 43: Latin America Market Y-o-Y Growth Comparison by Functionality, 2025-2035
  • Figure 44: Latin America Market Attractiveness Analysis by Functionality
  • Figure 45: Latin America Market Value Share and BPS Analysis by Extraction Method, 2025 and 2035
  • Figure 46: Latin America Market Y-o-Y Growth Comparison by Extraction Method, 2025-2035
  • Figure 47: Latin America Market Attractiveness Analysis by Extraction Method
  • Figure 48: Latin America Market Value Share and BPS Analysis by Application, 2025 and 2035
  • Figure 49: Latin America Market Y-o-Y Growth Comparison by Application, 2025-2035
  • Figure 50: Latin America Market Attractiveness Analysis by Application
  • Figure 51: Western Europe Market Value Share and BPS Analysis by Country, 2025 and 2035
  • Figure 52: Western Europe Market Value Share and BPS Analysis by Source Type, 2025 and 2035
  • Figure 53: Western Europe Market Y-o-Y Growth Comparison by Source Type, 2025-2035
  • Figure 54: Western Europe Market Attractiveness Analysis by Source Type
  • Figure 55: Western Europe Market Value Share and BPS Analysis by Functionality, 2025 and 2035
  • Figure 56: Western Europe Market Y-o-Y Growth Comparison by Functionality, 2025-2035
  • Figure 57: Western Europe Market Attractiveness Analysis by Functionality
  • Figure 58: Western Europe Market Value Share and BPS Analysis by Extraction Method, 2025 and 2035
  • Figure 59: Western Europe Market Y-o-Y Growth Comparison by Extraction Method, 2025-2035
  • Figure 60: Western Europe Market Attractiveness Analysis by Extraction Method
  • Figure 61: Western Europe Market Value Share and BPS Analysis by Application, 2025 and 2035
  • Figure 62: Western Europe Market Y-o-Y Growth Comparison by Application, 2025-2035
  • Figure 63: Western Europe Market Attractiveness Analysis by Application
  • Figure 64: Eastern Europe Market Value Share and BPS Analysis by Country, 2025 and 2035
  • Figure 65: Eastern Europe Market Value Share and BPS Analysis by Source Type, 2025 and 2035
  • Figure 66: Eastern Europe Market Y-o-Y Growth Comparison by Source Type, 2025-2035
  • Figure 67: Eastern Europe Market Attractiveness Analysis by Source Type
  • Figure 68: Eastern Europe Market Value Share and BPS Analysis by Functionality, 2025 and 2035
  • Figure 69: Eastern Europe Market Y-o-Y Growth Comparison by Functionality, 2025-2035
  • Figure 70: Eastern Europe Market Attractiveness Analysis by Functionality
  • Figure 71: Eastern Europe Market Value Share and BPS Analysis by Extraction Method, 2025 and 2035
  • Figure 72: Eastern Europe Market Y-o-Y Growth Comparison by Extraction Method, 2025-2035
  • Figure 73: Eastern Europe Market Attractiveness Analysis by Extraction Method
  • Figure 74: Eastern Europe Market Value Share and BPS Analysis by Application, 2025 and 2035
  • Figure 75: Eastern Europe Market Y-o-Y Growth Comparison by Application, 2025-2035
  • Figure 76: Eastern Europe Market Attractiveness Analysis by Application
  • Figure 77: East Asia Market Value Share and BPS Analysis by Country, 2025 and 2035
  • Figure 78: East Asia Market Value Share and BPS Analysis by Source Type, 2025 and 2035
  • Figure 79: East Asia Market Y-o-Y Growth Comparison by Source Type, 2025-2035
  • Figure 80: East Asia Market Attractiveness Analysis by Source Type
  • Figure 81: East Asia Market Value Share and BPS Analysis by Functionality, 2025 and 2035
  • Figure 82: East Asia Market Y-o-Y Growth Comparison by Functionality, 2025-2035
  • Figure 83: East Asia Market Attractiveness Analysis by Functionality
  • Figure 84: East Asia Market Value Share and BPS Analysis by Extraction Method, 2025 and 2035
  • Figure 85: East Asia Market Y-o-Y Growth Comparison by Extraction Method, 2025-2035
  • Figure 86: East Asia Market Attractiveness Analysis by Extraction Method
  • Figure 87: East Asia Market Value Share and BPS Analysis by Application, 2025 and 2035
  • Figure 88: East Asia Market Y-o-Y Growth Comparison by Application, 2025-2035
  • Figure 89: East Asia Market Attractiveness Analysis by Application
  • Figure 90: South Asia & Pacific Market Value Share and BPS Analysis by Country, 2025 and 2035
  • Figure 91: South Asia & Pacific Market Value Share and BPS Analysis by Source Type, 2025 and 2035
  • Figure 92: South Asia & Pacific Market Y-o-Y Growth Comparison by Source Type, 2025-2035
  • Figure 93: South Asia & Pacific Market Attractiveness Analysis by Source Type
  • Figure 94: South Asia & Pacific Market Value Share and BPS Analysis by Functionality, 2025 and 2035
  • Figure 95: South Asia & Pacific Market Y-o-Y Growth Comparison by Functionality, 2025-2035
  • Figure 96: South Asia & Pacific Market Attractiveness Analysis by Functionality
  • Figure 97: South Asia & Pacific Market Value Share and BPS Analysis by Extraction Method, 2025 and 2035
  • Figure 98: South Asia & Pacific Market Y-o-Y Growth Comparison by Extraction Method, 2025-2035
  • Figure 99: South Asia & Pacific Market Attractiveness Analysis by Extraction Method
  • Figure 100: South Asia & Pacific Market Value Share and BPS Analysis by Application, 2025 and 2035
  • Figure 101: South Asia & Pacific Market Y-o-Y Growth Comparison by Application, 2025-2035
  • Figure 102: South Asia & Pacific Market Attractiveness Analysis by Application
  • Figure 103: Middle East and Africa Market Value Share and BPS Analysis by Country, 2025 and 2035
  • Figure 104: Middle East and Africa Market Value Share and BPS Analysis by Source Type, 2025 and 2035
  • Figure 105: Middle East and Africa Market Y-o-Y Growth Comparison by Source Type, 2025-2035
  • Figure 106: Middle East and Africa Market Attractiveness Analysis by Source Type
  • Figure 107: Middle East and Africa Market Value Share and BPS Analysis by Functionality, 2025 and 2035
  • Figure 108: Middle East and Africa Market Y-o-Y Growth Comparison by Functionality, 2025-2035
  • Figure 109: Middle East and Africa Market Attractiveness Analysis by Functionality
  • Figure 110: Middle East and Africa Market Value Share and BPS Analysis by Extraction Method, 2025 and 2035
  • Figure 111: Middle East and Africa Market Y-o-Y Growth Comparison by Extraction Method, 2025-2035
  • Figure 112: Middle East and Africa Market Attractiveness Analysis by Extraction Method
  • Figure 113: Middle East and Africa Market Value Share and BPS Analysis by Application, 2025 and 2035
  • Figure 114: Middle East and Africa Market Y-o-Y Growth Comparison by Application, 2025-2035
  • Figure 115: Middle East and Africa Market Attractiveness Analysis by Application
  • Figure 116: Global Market - Tier Structure Analysis
  • Figure 117: Global Market - Company Share Analysis

Frequently Asked Questions

What is the estimated market size of the functional extracts market in 2025?

The industry is valued at USD 86.9 billion in 2025.

What is the projected industry size of the functional extracts market by 2035?

It is forecasted to reach USD 174.2 billion by 2035.

What is the expected CAGR for the functional extracts market between 2025 and 2035?

The industry is anticipated to grow at a CAGR of 7.2% during this period.

Which segment is expected to lead the functional extracts market in 2025?

Plant-based are projected to lead the market with a 58.3% share in 2025.

Which region is expected to witness the highest growth in the functional extracts market?

Asia Pacific, particularly India, is expected to be the key growth region with a projected growth rate of 8.2%.

Explore Similar Insights

Future Market Insights

Functional Extracts Market