Functional Protein Market Outlook 2024 to 2034

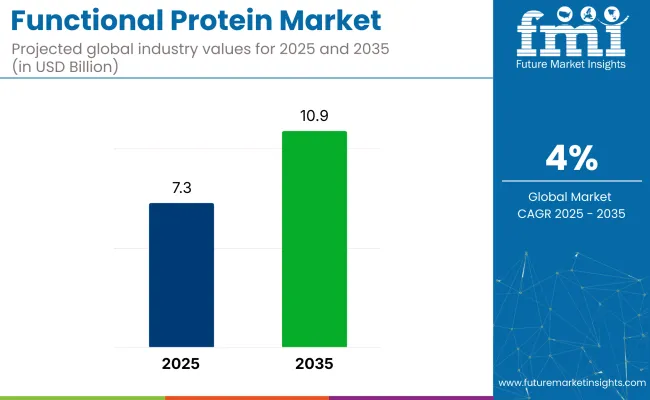
The projected valuation of the functional protein market is estimated to surpass USD 10,518.4 million by 2034. According to the research, the market is anticipated to clock a 4% CAGR until 2034. In 2024, the functional protein market stands at USD 7,255.2 million.

Attributes Details
Functional Protein Market Size, 2024 USD 7,255.2 million
Functional Protein Market Value, 2034 USD 10,518.4 million
Value CAGR (2024 to 2034) 4%

Key Market Highlights

Manufacturers Tap into Corporate Wellness Trends by B2B Collaborations

There are immense growth prospects for profiting from the trend of corporate wellness by providing protein-enriched foods for workplace wellness initiatives.

To create a positive work environment companies can partner-up and provide wholesome meals or snacks to staff, this calculated approach capitalizes on the expanding corporate wellness industry by positioning the brand as a proactive supporter of employee well-being. It cultivates favorable connections and possible business-to-business collaborations.

Businesses Embrace Hyper-personalization through Advanced AI Algorithms

To achieve increased levels of personalization companies in the functional protein industry are using artificial intelligence. Companies can make custom-made protein for a specific customer with the help of data analytics and machine learning, that suits the preference of that customer.

With the help of this customers’ level of satisfaction and engagement can be increased which ultimately builds brand loyalty. In today’s ever-changing world customized nutrition and hyper-personalization not only give the company a competitive advantage but also strengthen the position of the company in the market and stay ahead of changing customer preferences.

Businesses Explore Postbiotic Protein Integration Due to Growing Interests in Gut Health

Businesses in the functional protein market are analyzing the possibility of adding postbiotics in their formulations, as consumers are getting more aware of gut health. Some of the good bacteria produce byproducts that are great for the digestive system and they are called postbiotics.

Companies that have postbiotics included in their protein are setting themselves apart in the industry of functional foods by providing both gut-friendly components and protein content in a single product. By focusing on a particular health issue a company can set itself apart from competition by emphasizing more on holistic well-being and taking advantage of this calculated approach.

Historical Performance of the Functional Protein Market (2019 to 2023) Vs. Forecast Outlook (2024 to 2034)

Attributes Details
Functional Protein Market Size (2022) USD 6,600 million
Functional Protein Market Share (2023) USD 6,890 million

One of the main reasons behind the growth of the functional protein market is the rising awareness of consumers about health and wellness. Consumers around the world are becoming more health-conscious and are looking for things that provide nutritional benefits. This trend is supported by functional proteins, which provide specific health advantages, including weight loss, muscular growth, and general well-being.

The rise in flexitarianism and plant-based diets has propelled market expansion. Plant-based functional proteins are in greater demand as more people embrace vegetarian and vegan diets. This has triggered the companies to create new plant-based protein products, which helped the functional protein market to grow.

The booming sports and fitness industries are also the key drivers for this growth. Sportsperson and fitness enthusiast are always looking for protein rich products for muscle repair and to increase performance. Functional proteins, particularly those intended for specific fitness purposes, have grown increasingly popular among this group, adding to the growth of the functional proteins market.

A stimulating element has been an increased understanding of the nutritional advantages of proteins beyond their role in muscle building. Consumers value proteins due to their important role in general health which includes, supporting the immune system, weight control, and providing a state of fullness after a meal. Functional proteins are specially created to fulfill these health demands.

The coming years will most probably bring a rise in the growth of plant-based diets and sustainability. A growing proportion of consumers are embracing plant-forward and flexitarian lifestyles, which is expected to drive up demand for plant-based functional proteins due to ethical and environmental concerns.

The functional beverage industry is anticipated to expand with more protein-infused beverages hitting the market. Protein shakes and smoothies ready to drink, and other functional beverages will satisfy consumers' need for wholesome, convenient food.

Functional Protein Market Trends Analysis

Trends
  • Collagen is being included in functional protein products by companies, capitalizing on the anti-aging and aesthetics craze.
  • Businesses are reformulating protein products to highlight natural components and reduce additives, in line with the clean label trend.
  • Businesses are investing in proteins created in laboratories, leading the way in adopting cellular agriculture.
  • Companies are branching into functional protein snack solutions in response to the growing demand for quick, health-conscious snacking.
  • Businesses are creating protein products enhanced with immune-boosting components in response to the growing public interest in immunological health.
  • Businesses are adding nootropics to protein products to capitalize on the increased interest in cognitive improvement.
Opportunities
  • A strategic pricing approach uses dynamic pricing models that adjust based on market changes and customer behavior.
  • By using technologies like blockchain for transparency or smart packaging, firms can boost customer trust, product traceability, and overall brand credibility.
  • Personalized functional protein products can be developed more efficiently by analyzing consumer preferences with artificial intelligence (AI) and data analytics.
  • Businesses could boost customer engagement by considering integration with smart gadgets, including fitness trackers or health applications.
  • Providing functional proteins along with supplementary wellness goods in holistic health bundles is a smart diversification tactic.
Challenges
  • The pervasiveness of false information and health fads threatens the nutrition sector.
  • Obtaining patents for exclusive formulations or processing technology by rivals could hamper other market participants' innovation ability.
  • A potential obstacle could originate from consumers who don't believe functional proteins are necessary or valuable.

Category-wise Insights

Incorporation in Food and Beverage Products Boosts Demand for Hydrolysates

Segment Hydrolysates (Product Type)
Value Share (2024) 26%

Excellent formulation flexibility and solubility make hydrolysates ideal for incorporating into various food and beverage products. Because of their adaptability, manufacturers find them attractive when looking for functional proteins that can be easily integrated into different applications without sacrificing the quality of the final product.

As health and well-being become more important for consumers they start looking for things with useful features in health and well-being. Desired health results and quick absorption are the two unique benefits of hydrolysates that meet the changing consumer demands for purposeful and functional nutrition.

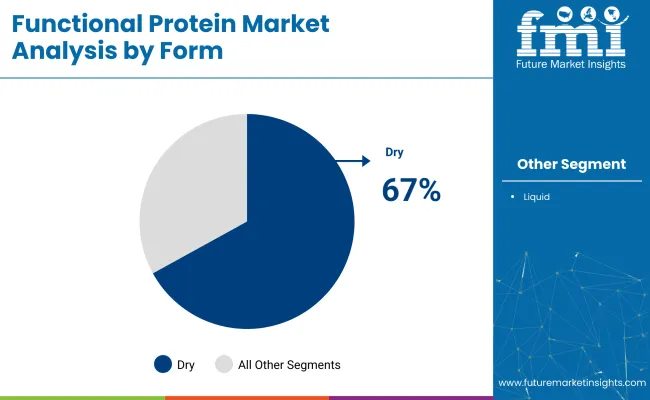
Ongoing Lifestyle Trends Surge Demand for Powdered Functional Protein

Segment Powder (Form)
Value Share (2024) 67%

The powder form fits great with today's lifestyle changes, such as the growing popularity of health and fitness regimens, meal replacement programs, and at-home workouts. Consumers can easily add powdered functional protein to their daily routine to help them achieve their targets.

Customers with busy schedules usually choose powdered from because of its convenience. Customers can easily and quickly add protein to their meals or drinks using the powder form, which satisfies the need for time-saving and simple nutrition solutions.

Country-wise Insights

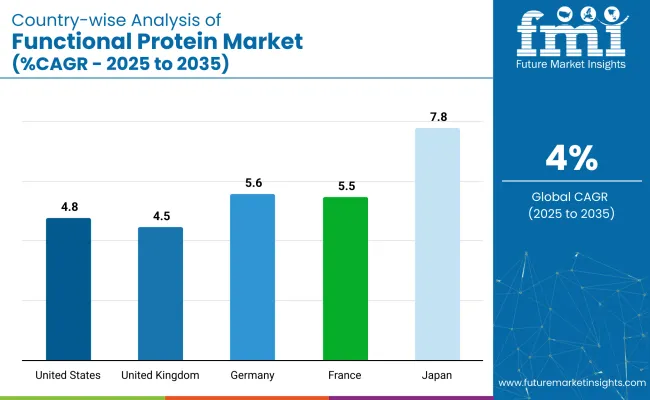
Countries Value CAGR (2024 to 2034)
United States 4.8%
Germany 5.6%
Japan 7.8%
Australia 6.0%
China 7.0%

Robust E-commerce Infrastructure Nurtures Growth in the United States

The functional proteins market size in the United States is projected to expand at a 4.8% CAGR through 2034. The e-commerce infrastructure in the United States is quite strong, offering a large online market for items containing functional proteins.

Online shopping's ease of use and compatibility with customer preferences fuel sales growth and market expansion. Businesses can reach to large audience and increase their profits by following the growing trend of online shopping in the nutrition and wellness industry, using digital marketing and e-commerce websites.

Innovations in Plant-based Proteins Foster Growth in Germany

The sales of the functional protein market in Germany are anticipated to rise at a 5.6% CAGR through 2034. Plant-based diets are becoming increasingly popular in Germany, driving demand for diverse plant-based functional protein products. Companies making plant-based functional proteins could profit from this trend by making different formulas that suit the preferences of regional consumers.

Showcasing the health benefits of plant-based solutions and sustainability meets the changing consumer tastes. The love of hiking and cycling that is deep rooted in German culture opens doors for functional protein companies.

Germany’s busy lifestyle is well suited for the marketing strategies that showcase items as perfect on-the-go food for outdoor activities. Companies could profit from this cultural affinity by joining athletic events, fitness challenges, or outdoor gatherings.

Cultural Embrace of Holistic Health Boosts Sales in Japan

The demand for functional proteins in Japan is predicted to surge at a 7.8% CAGR through 2034. Holistic health, which considers both physical and emotional well-being, is highly valued in Japanese society. There is room for innovation, given the rise in popularity of functional drinks in Japan.

Creating functional protein-infused drinks suited to Japanese palates meets the need for accessible and revitalizing dietary choices. Companies could consider forming alliances with beverage makers to capitalize on the beverage-centric culture to launch innovative functional protein beverages into the market.

Affluent Consumer Base Boosts Premiumization in Australia

The functional proteins market size in Australia is estimated to expand at a 6.0% CAGR through 2034. Australia's comparatively high disposable income levels create the demand for high-end functional protein products. Companies could gain from the wealthy clientele by providing superior alternatives and taking advantage of their propensity to spend money on wellness and health.

Marketing strategies that use influencers and celebrities for promotions works very well in Australia. The credibility of the product rises by collaborating with regional influencers or celebrities which attracts health-conscious consumers. Partnerships with influencers increase the trust of consumers and the market reach.

Government Initiatives for Healthy Living Create Growth Prospects in China

The demand for functional proteins in the Chinese market is expected to rise at a CAGR of 7.0% by the year 2034. The product positioning is built by working together with the national health efforts or aligning the advertisements with it.

The government of China is pushing for healthy living, which makes the atmosphere favorable for companies operating in the functional protein industry. Partnerships with regulatory agencies are made and this increases the impression of the brand in front of consumers.

Competitive Landscape

The functional protein industry is highly competitive, with leading companies fighting for market share and customer loyalty in fierce competition. Several different factors affect the competitive dynamics of this sector. The established industry leaders dominate because of their strong supply chain and wide distribution networks. These market leaders use economies of scale to reduce manufacturing costs and keep their pricing competitive.

Recent Developments

  • In September 2023, Kemin Industries (Des Moines, IA) launched its first production unit to produce the Proteus brand of clean-label functional proteins, which are intended to improve the texture and moisture retention of meat and poultry products, particularly during cooking. The manufacturing factory is in Verona, Missouri.
  • In June 2022, Roquette, a global leader in plant-based products and a plant protein pioneer, announced the launch of two rice proteins. Roquette provides consumers with a familiar, safe, and healthy alternative protein with premium quality and rigorous manufacturing standards with NUTRALYS rice protein.

Key Players in the Functional Protein Market

  • Glanbia plc
  • Archer Daniels Midland Company
  • Kerry Group
  • Fonterra Co-operative Group
  • DuPont de Nemours, Inc.
  • Cargill, Incorporated
  • FrieslandCampina
  • Herbalife Nutrition Ltd.
  • Hilmar Ingredients
  • Omega Protein Corporation
  • Amway Corporation
  • Arla Foods Ingredients Group P/S
  • NOW Foods
  • MusclePharm Corporation
  • Quest Nutrition, LLC

Functional Protein Market Segmentation

By Product Type:

  • Hydrolysates
  • Whey Protein Concentrates
  • Whey Protein Isolates
  • Casein and Caseinates
  • Soy Protein
  • Others

By Form:

  • Dry
  • Liquid

By Source:

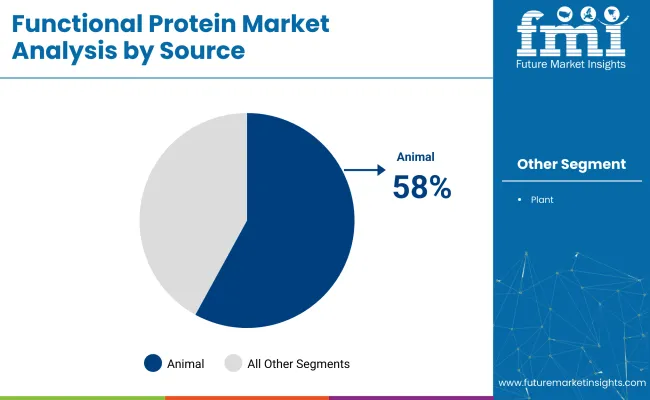
  • Animal
    • Dairy
    • Egg
    • Gelatin
  • Plant
    • Soy
    • Wheat
    • Vegetable

By Application:

  • Food
  • Beverages
  • Dietary Supplements
  • Animal Nutrition

By Distribution Channel:

  • Direct
  • Indirect
    • Pharmacy Stores
    • E-retailers
    • Specialty Stores
    • Supermarkets

By Region:

  • North America
  • Latin America
  • Western Europe
  • Eastern Europe
  • Asia Pacific (APAC)
  • The Middle East & Africa (MEA)
  • Japan

Table of Content

  • 1. Executive Summary
  • 2. Market Overview
  • 3. Market Background
  • 4. Global Market Analysis 2019 to 2023 and Forecast, 2024 to 2034
  • 5. Global Market Analysis 2019 to 2023 and Forecast 2024 to 2034, By Product Type
    • 5.1. Hydrolysates
    • 5.2. Whey Protein Concentrates
    • 5.3. Whey Protein Isolates
    • 5.4. Casein and Caseinates
    • 5.5. Soy Protein
    • 5.6. Others
  • 6. Global Market Analysis 2019 to 2023 and Forecast 2024 to 2034, By Form
    • 6.1. Dry
    • 6.2. Liquid
  • 7. Global Market Analysis 2019 to 2023 and Forecast 2024 to 2034, By Source
    • 7.1. Animal
      • 7.1.1. Dairy
      • 7.1.2. Egg
      • 7.1.3. Gelatin
    • 7.2. Plant
      • 7.2.1. Soy
      • 7.2.2. Wheat
      • 7.2.3. Vegetable
  • 8. Global Market Analysis 2019 to 2023 and Forecast 2024 to 2034, By Application
    • 8.1. Food
    • 8.2. Beverages
    • 8.3. Dietary Supplements
    • 8.4. Animal Nutrition
  • 9. Global Market Analysis 2019 to 2023 and Forecast 2024 to 2034, By Distribution Channel
    • 9.1. Direct
    • 9.2. Retail
      • 9.2.1. Pharmacy Stores
      • 9.2.2. E-retailers
      • 9.2.3. Specialty Stores
      • 9.2.4. Supermarkets
  • 10. Global Market Analysis 2019 to 2023 and Forecast 2024 to 2034, By Region
    • 10.1. North America
    • 10.2. Latin America
    • 10.3. Western Europe
    • 10.4. Eastern Europe
    • 10.5. South Asia and Pacific
    • 10.6. East Asia
    • 10.7. Middle East and Africa
  • 11. North America Market Analysis 2019 to 2023 and Forecast 2024 to 2034, By Country
  • 12. Latin America Market Analysis 2019 to 2023 and Forecast 2024 to 2034, By Country
  • 13. Western Europe Market Analysis 2019 to 2023 and Forecast 2024 to 2034, By Country
  • 14. Eastern Europe Market Analysis 2019 to 2023 and Forecast 2024 to 2034, By Country
  • 15. South Asia and Pacific Market Analysis 2019 to 2023 and Forecast 2024 to 2034, By Country
  • 16. East Asia Market Analysis 2019 to 2023 and Forecast 2024 to 2034, By Country
  • 17. Middle East and Africa Market Analysis 2019 to 2023 and Forecast 2024 to 2034, By Country
  • 18. Key Countries Market Analysis
  • 19. Market Structure Analysis
  • 20. Competition Analysis
    • 20.1. InVivo
    • 20.2. Cargill
    • 20.3. Roquette Frères
    • 20.4. Omega Protein Corporation
    • 20.5. DowDuPont
    • 20.6. Amway
    • 20.7. AMCO Proteins
    • 20.8. Herbalife International Inc.
  • 21. Assumptions & Acronyms Used
  • 22. Research Methodology

List of Tables

Table 1: Global Market Value (US$ Million) Forecast by Region, 2019 to 2034

Table 2: Global Market Volume (Tons) Forecast by Region, 2019 to 2034

Table 3: Global Market Value (US$ Million) Forecast by Product Type, 2019 to 2034

Table 4: Global Market Volume (Tons) Forecast by Product Type, 2019 to 2034

Table 5: Global Market Value (US$ Million) Forecast by Form, 2019 to 2034

Table 6: Global Market Volume (Tons) Forecast by Form, 2019 to 2034

Table 7: Global Market Value (US$ Million) Forecast by Source, 2019 to 2034

Table 8: Global Market Volume (Tons) Forecast by Source, 2019 to 2034

Table 9: Global Market Value (US$ Million) Forecast by Application, 2019 to 2034

Table 10: Global Market Volume (Tons) Forecast by Application, 2019 to 2034

Table 11: Global Market Value (US$ Million) Forecast by Distribution Channel, 2019 to 2034

Table 12: Global Market Volume (Tons) Forecast by Distribution Channel, 2019 to 2034

Table 13: North America Market Value (US$ Million) Forecast by Country, 2019 to 2034

Table 14: North America Market Volume (Tons) Forecast by Country, 2019 to 2034

Table 15: North America Market Value (US$ Million) Forecast by Product Type, 2019 to 2034

Table 16: North America Market Volume (Tons) Forecast by Product Type, 2019 to 2034

Table 17: North America Market Value (US$ Million) Forecast by Form, 2019 to 2034

Table 18: North America Market Volume (Tons) Forecast by Form, 2019 to 2034

Table 19: North America Market Value (US$ Million) Forecast by Source, 2019 to 2034

Table 20: North America Market Volume (Tons) Forecast by Source, 2019 to 2034

Table 21: North America Market Value (US$ Million) Forecast by Application, 2019 to 2034

Table 22: North America Market Volume (Tons) Forecast by Application, 2019 to 2034

Table 23: North America Market Value (US$ Million) Forecast by Distribution Channel, 2019 to 2034

Table 24: North America Market Volume (Tons) Forecast by Distribution Channel, 2019 to 2034

Table 25: Latin America Market Value (US$ Million) Forecast by Country, 2019 to 2034

Table 26: Latin America Market Volume (Tons) Forecast by Country, 2019 to 2034

Table 27: Latin America Market Value (US$ Million) Forecast by Product Type, 2019 to 2034

Table 28: Latin America Market Volume (Tons) Forecast by Product Type, 2019 to 2034

Table 29: Latin America Market Value (US$ Million) Forecast by Form, 2019 to 2034

Table 30: Latin America Market Volume (Tons) Forecast by Form, 2019 to 2034

Table 31: Latin America Market Value (US$ Million) Forecast by Source, 2019 to 2034

Table 32: Latin America Market Volume (Tons) Forecast by Source, 2019 to 2034

Table 33: Latin America Market Value (US$ Million) Forecast by Application, 2019 to 2034

Table 34: Latin America Market Volume (Tons) Forecast by Application, 2019 to 2034

Table 35: Latin America Market Value (US$ Million) Forecast by Distribution Channel, 2019 to 2034

Table 36: Latin America Market Volume (Tons) Forecast by Distribution Channel, 2019 to 2034

Table 37: Western Europe Market Value (US$ Million) Forecast by Country, 2019 to 2034

Table 38: Western Europe Market Volume (Tons) Forecast by Country, 2019 to 2034

Table 39: Western Europe Market Value (US$ Million) Forecast by Product Type, 2019 to 2034

Table 40: Western Europe Market Volume (Tons) Forecast by Product Type, 2019 to 2034

Table 41: Western Europe Market Value (US$ Million) Forecast by Form, 2019 to 2034

Table 42: Western Europe Market Volume (Tons) Forecast by Form, 2019 to 2034

Table 43: Western Europe Market Value (US$ Million) Forecast by Source, 2019 to 2034

Table 44: Western Europe Market Volume (Tons) Forecast by Source, 2019 to 2034

Table 45: Western Europe Market Value (US$ Million) Forecast by Application, 2019 to 2034

Table 46: Western Europe Market Volume (Tons) Forecast by Application, 2019 to 2034

Table 47: Western Europe Market Value (US$ Million) Forecast by Distribution Channel, 2019 to 2034

Table 48: Western Europe Market Volume (Tons) Forecast by Distribution Channel, 2019 to 2034

Table 49: Eastern Europe Market Value (US$ Million) Forecast by Country, 2019 to 2034

Table 50: Eastern Europe Market Volume (Tons) Forecast by Country, 2019 to 2034

Table 51: Eastern Europe Market Value (US$ Million) Forecast by Product Type, 2019 to 2034

Table 52: Eastern Europe Market Volume (Tons) Forecast by Product Type, 2019 to 2034

Table 53: Eastern Europe Market Value (US$ Million) Forecast by Form, 2019 to 2034

Table 54: Eastern Europe Market Volume (Tons) Forecast by Form, 2019 to 2034

Table 55: Eastern Europe Market Value (US$ Million) Forecast by Source, 2019 to 2034

Table 56: Eastern Europe Market Volume (Tons) Forecast by Source, 2019 to 2034

Table 57: Eastern Europe Market Value (US$ Million) Forecast by Application, 2019 to 2034

Table 58: Eastern Europe Market Volume (Tons) Forecast by Application, 2019 to 2034

Table 59: Eastern Europe Market Value (US$ Million) Forecast by Distribution Channel, 2019 to 2034

Table 60: Eastern Europe Market Volume (Tons) Forecast by Distribution Channel, 2019 to 2034

Table 61: South Asia and Pacific Market Value (US$ Million) Forecast by Country, 2019 to 2034

Table 62: South Asia and Pacific Market Volume (Tons) Forecast by Country, 2019 to 2034

Table 63: South Asia and Pacific Market Value (US$ Million) Forecast by Product Type, 2019 to 2034

Table 64: South Asia and Pacific Market Volume (Tons) Forecast by Product Type, 2019 to 2034

Table 65: South Asia and Pacific Market Value (US$ Million) Forecast by Form, 2019 to 2034

Table 66: South Asia and Pacific Market Volume (Tons) Forecast by Form, 2019 to 2034

Table 67: South Asia and Pacific Market Value (US$ Million) Forecast by Source, 2019 to 2034

Table 68: South Asia and Pacific Market Volume (Tons) Forecast by Source, 2019 to 2034

Table 69: South Asia and Pacific Market Value (US$ Million) Forecast by Application, 2019 to 2034

Table 70: South Asia and Pacific Market Volume (Tons) Forecast by Application, 2019 to 2034

Table 71: South Asia and Pacific Market Value (US$ Million) Forecast by Distribution Channel, 2019 to 2034

Table 72: South Asia and Pacific Market Volume (Tons) Forecast by Distribution Channel, 2019 to 2034

Table 73: East Asia Market Value (US$ Million) Forecast by Country, 2019 to 2034

Table 74: East Asia Market Volume (Tons) Forecast by Country, 2019 to 2034

Table 75: East Asia Market Value (US$ Million) Forecast by Product Type, 2019 to 2034

Table 76: East Asia Market Volume (Tons) Forecast by Product Type, 2019 to 2034

Table 77: East Asia Market Value (US$ Million) Forecast by Form, 2019 to 2034

Table 78: East Asia Market Volume (Tons) Forecast by Form, 2019 to 2034

Table 79: East Asia Market Value (US$ Million) Forecast by Source, 2019 to 2034

Table 80: East Asia Market Volume (Tons) Forecast by Source, 2019 to 2034

Table 81: East Asia Market Value (US$ Million) Forecast by Application, 2019 to 2034

Table 82: East Asia Market Volume (Tons) Forecast by Application, 2019 to 2034

Table 83: East Asia Market Value (US$ Million) Forecast by Distribution Channel, 2019 to 2034

Table 84: East Asia Market Volume (Tons) Forecast by Distribution Channel, 2019 to 2034

Table 85: Middle East and Africa Market Value (US$ Million) Forecast by Country, 2019 to 2034

Table 86: Middle East and Africa Market Volume (Tons) Forecast by Country, 2019 to 2034

Table 87: Middle East and Africa Market Value (US$ Million) Forecast by Product Type, 2019 to 2034

Table 88: Middle East and Africa Market Volume (Tons) Forecast by Product Type, 2019 to 2034

Table 89: Middle East and Africa Market Value (US$ Million) Forecast by Form, 2019 to 2034

Table 90: Middle East and Africa Market Volume (Tons) Forecast by Form, 2019 to 2034

Table 91: Middle East and Africa Market Value (US$ Million) Forecast by Source, 2019 to 2034

Table 92: Middle East and Africa Market Volume (Tons) Forecast by Source, 2019 to 2034

Table 93: Middle East and Africa Market Value (US$ Million) Forecast by Application, 2019 to 2034

Table 94: Middle East and Africa Market Volume (Tons) Forecast by Application, 2019 to 2034

Table 95: Middle East and Africa Market Value (US$ Million) Forecast by Distribution Channel, 2019 to 2034

Table 96: Middle East and Africa Market Volume (Tons) Forecast by Distribution Channel, 2019 to 2034

List of Figures

Figure 1: Global Market Value (US$ Million) by Product Type, 2024 to 2034

Figure 2: Global Market Value (US$ Million) by Form, 2024 to 2034

Figure 3: Global Market Value (US$ Million) by Source, 2024 to 2034

Figure 4: Global Market Value (US$ Million) by Application, 2024 to 2034

Figure 5: Global Market Value (US$ Million) by Distribution Channel, 2024 to 2034

Figure 6: Global Market Value (US$ Million) by Region, 2024 to 2034

Figure 7: Global Market Value (US$ Million) Analysis by Region, 2019 to 2034

Figure 8: Global Market Volume (Tons) Analysis by Region, 2019 to 2034

Figure 9: Global Market Value Share (%) and BPS Analysis by Region, 2024 to 2034

Figure 10: Global Market Y-o-Y Growth (%) Projections by Region, 2024 to 2034

Figure 11: Global Market Value (US$ Million) Analysis by Product Type, 2019 to 2034

Figure 12: Global Market Volume (Tons) Analysis by Product Type, 2019 to 2034

Figure 13: Global Market Value Share (%) and BPS Analysis by Product Type, 2024 to 2034

Figure 14: Global Market Y-o-Y Growth (%) Projections by Product Type, 2024 to 2034

Figure 15: Global Market Value (US$ Million) Analysis by Form, 2019 to 2034

Figure 16: Global Market Volume (Tons) Analysis by Form, 2019 to 2034

Figure 17: Global Market Value Share (%) and BPS Analysis by Form, 2024 to 2034

Figure 18: Global Market Y-o-Y Growth (%) Projections by Form, 2024 to 2034

Figure 19: Global Market Value (US$ Million) Analysis by Source, 2019 to 2034

Figure 20: Global Market Volume (Tons) Analysis by Source, 2019 to 2034

Figure 21: Global Market Value Share (%) and BPS Analysis by Source, 2024 to 2034

Figure 22: Global Market Y-o-Y Growth (%) Projections by Source, 2024 to 2034

Figure 23: Global Market Value (US$ Million) Analysis by Application, 2019 to 2034

Figure 24: Global Market Volume (Tons) Analysis by Application, 2019 to 2034

Figure 25: Global Market Value Share (%) and BPS Analysis by Application, 2024 to 2034

Figure 26: Global Market Y-o-Y Growth (%) Projections by Application, 2024 to 2034

Figure 27: Global Market Value (US$ Million) Analysis by Distribution Channel, 2019 to 2034

Figure 28: Global Market Volume (Tons) Analysis by Distribution Channel, 2019 to 2034

Figure 29: Global Market Value Share (%) and BPS Analysis by Distribution Channel, 2024 to 2034

Figure 30: Global Market Y-o-Y Growth (%) Projections by Distribution Channel, 2024 to 2034

Figure 31: Global Market Attractiveness by Product Type, 2024 to 2034

Figure 32: Global Market Attractiveness by Form, 2024 to 2034

Figure 33: Global Market Attractiveness by Source, 2024 to 2034

Figure 34: Global Market Attractiveness by Application, 2024 to 2034

Figure 35: Global Market Attractiveness by Distribution Channel, 2024 to 2034

Figure 36: Global Market Attractiveness by Region, 2024 to 2034

Figure 37: North America Market Value (US$ Million) by Product Type, 2024 to 2034

Figure 38: North America Market Value (US$ Million) by Form, 2024 to 2034

Figure 39: North America Market Value (US$ Million) by Source, 2024 to 2034

Figure 40: North America Market Value (US$ Million) by Application, 2024 to 2034

Figure 41: North America Market Value (US$ Million) by Distribution Channel, 2024 to 2034

Figure 42: North America Market Value (US$ Million) by Country, 2024 to 2034

Figure 43: North America Market Value (US$ Million) Analysis by Country, 2019 to 2034

Figure 44: North America Market Volume (Tons) Analysis by Country, 2019 to 2034

Figure 45: North America Market Value Share (%) and BPS Analysis by Country, 2024 to 2034

Figure 46: North America Market Y-o-Y Growth (%) Projections by Country, 2024 to 2034

Figure 47: North America Market Value (US$ Million) Analysis by Product Type, 2019 to 2034

Figure 48: North America Market Volume (Tons) Analysis by Product Type, 2019 to 2034

Figure 49: North America Market Value Share (%) and BPS Analysis by Product Type, 2024 to 2034

Figure 50: North America Market Y-o-Y Growth (%) Projections by Product Type, 2024 to 2034

Figure 51: North America Market Value (US$ Million) Analysis by Form, 2019 to 2034

Figure 52: North America Market Volume (Tons) Analysis by Form, 2019 to 2034

Figure 53: North America Market Value Share (%) and BPS Analysis by Form, 2024 to 2034

Figure 54: North America Market Y-o-Y Growth (%) Projections by Form, 2024 to 2034

Figure 55: North America Market Value (US$ Million) Analysis by Source, 2019 to 2034

Figure 56: North America Market Volume (Tons) Analysis by Source, 2019 to 2034

Figure 57: North America Market Value Share (%) and BPS Analysis by Source, 2024 to 2034

Figure 58: North America Market Y-o-Y Growth (%) Projections by Source, 2024 to 2034

Figure 59: North America Market Value (US$ Million) Analysis by Application, 2019 to 2034

Figure 60: North America Market Volume (Tons) Analysis by Application, 2019 to 2034

Figure 61: North America Market Value Share (%) and BPS Analysis by Application, 2024 to 2034

Figure 62: North America Market Y-o-Y Growth (%) Projections by Application, 2024 to 2034

Figure 63: North America Market Value (US$ Million) Analysis by Distribution Channel, 2019 to 2034

Figure 64: North America Market Volume (Tons) Analysis by Distribution Channel, 2019 to 2034

Figure 65: North America Market Value Share (%) and BPS Analysis by Distribution Channel, 2024 to 2034

Figure 66: North America Market Y-o-Y Growth (%) Projections by Distribution Channel, 2024 to 2034

Figure 67: North America Market Attractiveness by Product Type, 2024 to 2034

Figure 68: North America Market Attractiveness by Form, 2024 to 2034

Figure 69: North America Market Attractiveness by Source, 2024 to 2034

Figure 70: North America Market Attractiveness by Application, 2024 to 2034

Figure 71: North America Market Attractiveness by Distribution Channel, 2024 to 2034

Figure 72: North America Market Attractiveness by Country, 2024 to 2034

Figure 73: Latin America Market Value (US$ Million) by Product Type, 2024 to 2034

Figure 74: Latin America Market Value (US$ Million) by Form, 2024 to 2034

Figure 75: Latin America Market Value (US$ Million) by Source, 2024 to 2034

Figure 76: Latin America Market Value (US$ Million) by Application, 2024 to 2034

Figure 77: Latin America Market Value (US$ Million) by Distribution Channel, 2024 to 2034

Figure 78: Latin America Market Value (US$ Million) by Country, 2024 to 2034

Figure 79: Latin America Market Value (US$ Million) Analysis by Country, 2019 to 2034

Figure 80: Latin America Market Volume (Tons) Analysis by Country, 2019 to 2034

Figure 81: Latin America Market Value Share (%) and BPS Analysis by Country, 2024 to 2034

Figure 82: Latin America Market Y-o-Y Growth (%) Projections by Country, 2024 to 2034

Figure 83: Latin America Market Value (US$ Million) Analysis by Product Type, 2019 to 2034

Figure 84: Latin America Market Volume (Tons) Analysis by Product Type, 2019 to 2034

Figure 85: Latin America Market Value Share (%) and BPS Analysis by Product Type, 2024 to 2034

Figure 86: Latin America Market Y-o-Y Growth (%) Projections by Product Type, 2024 to 2034

Figure 87: Latin America Market Value (US$ Million) Analysis by Form, 2019 to 2034

Figure 88: Latin America Market Volume (Tons) Analysis by Form, 2019 to 2034

Figure 89: Latin America Market Value Share (%) and BPS Analysis by Form, 2024 to 2034

Figure 90: Latin America Market Y-o-Y Growth (%) Projections by Form, 2024 to 2034

Figure 91: Latin America Market Value (US$ Million) Analysis by Source, 2019 to 2034

Figure 92: Latin America Market Volume (Tons) Analysis by Source, 2019 to 2034

Figure 93: Latin America Market Value Share (%) and BPS Analysis by Source, 2024 to 2034

Figure 94: Latin America Market Y-o-Y Growth (%) Projections by Source, 2024 to 2034

Figure 95: Latin America Market Value (US$ Million) Analysis by Application, 2019 to 2034

Figure 96: Latin America Market Volume (Tons) Analysis by Application, 2019 to 2034

Figure 97: Latin America Market Value Share (%) and BPS Analysis by Application, 2024 to 2034

Figure 98: Latin America Market Y-o-Y Growth (%) Projections by Application, 2024 to 2034

Figure 99: Latin America Market Value (US$ Million) Analysis by Distribution Channel, 2019 to 2034

Figure 100: Latin America Market Volume (Tons) Analysis by Distribution Channel, 2019 to 2034

Figure 101: Latin America Market Value Share (%) and BPS Analysis by Distribution Channel, 2024 to 2034

Figure 102: Latin America Market Y-o-Y Growth (%) Projections by Distribution Channel, 2024 to 2034

Figure 103: Latin America Market Attractiveness by Product Type, 2024 to 2034

Figure 104: Latin America Market Attractiveness by Form, 2024 to 2034

Figure 105: Latin America Market Attractiveness by Source, 2024 to 2034

Figure 106: Latin America Market Attractiveness by Application, 2024 to 2034

Figure 107: Latin America Market Attractiveness by Distribution Channel, 2024 to 2034

Figure 108: Latin America Market Attractiveness by Country, 2024 to 2034

Figure 109: Western Europe Market Value (US$ Million) by Product Type, 2024 to 2034

Figure 110: Western Europe Market Value (US$ Million) by Form, 2024 to 2034

Figure 111: Western Europe Market Value (US$ Million) by Source, 2024 to 2034

Figure 112: Western Europe Market Value (US$ Million) by Application, 2024 to 2034

Figure 113: Western Europe Market Value (US$ Million) by Distribution Channel, 2024 to 2034

Figure 114: Western Europe Market Value (US$ Million) by Country, 2024 to 2034

Figure 115: Western Europe Market Value (US$ Million) Analysis by Country, 2019 to 2034

Figure 116: Western Europe Market Volume (Tons) Analysis by Country, 2019 to 2034

Figure 117: Western Europe Market Value Share (%) and BPS Analysis by Country, 2024 to 2034

Figure 118: Western Europe Market Y-o-Y Growth (%) Projections by Country, 2024 to 2034

Figure 119: Western Europe Market Value (US$ Million) Analysis by Product Type, 2019 to 2034

Figure 120: Western Europe Market Volume (Tons) Analysis by Product Type, 2019 to 2034

Figure 121: Western Europe Market Value Share (%) and BPS Analysis by Product Type, 2024 to 2034

Figure 122: Western Europe Market Y-o-Y Growth (%) Projections by Product Type, 2024 to 2034

Figure 123: Western Europe Market Value (US$ Million) Analysis by Form, 2019 to 2034

Figure 124: Western Europe Market Volume (Tons) Analysis by Form, 2019 to 2034

Figure 125: Western Europe Market Value Share (%) and BPS Analysis by Form, 2024 to 2034

Figure 126: Western Europe Market Y-o-Y Growth (%) Projections by Form, 2024 to 2034

Figure 127: Western Europe Market Value (US$ Million) Analysis by Source, 2019 to 2034

Figure 128: Western Europe Market Volume (Tons) Analysis by Source, 2019 to 2034

Figure 129: Western Europe Market Value Share (%) and BPS Analysis by Source, 2024 to 2034

Figure 130: Western Europe Market Y-o-Y Growth (%) Projections by Source, 2024 to 2034

Figure 131: Western Europe Market Value (US$ Million) Analysis by Application, 2019 to 2034

Figure 132: Western Europe Market Volume (Tons) Analysis by Application, 2019 to 2034

Figure 133: Western Europe Market Value Share (%) and BPS Analysis by Application, 2024 to 2034

Figure 134: Western Europe Market Y-o-Y Growth (%) Projections by Application, 2024 to 2034

Figure 135: Western Europe Market Value (US$ Million) Analysis by Distribution Channel, 2019 to 2034

Figure 136: Western Europe Market Volume (Tons) Analysis by Distribution Channel, 2019 to 2034

Figure 137: Western Europe Market Value Share (%) and BPS Analysis by Distribution Channel, 2024 to 2034

Figure 138: Western Europe Market Y-o-Y Growth (%) Projections by Distribution Channel, 2024 to 2034

Figure 139: Western Europe Market Attractiveness by Product Type, 2024 to 2034

Figure 140: Western Europe Market Attractiveness by Form, 2024 to 2034

Figure 141: Western Europe Market Attractiveness by Source, 2024 to 2034

Figure 142: Western Europe Market Attractiveness by Application, 2024 to 2034

Figure 143: Western Europe Market Attractiveness by Distribution Channel, 2024 to 2034

Figure 144: Western Europe Market Attractiveness by Country, 2024 to 2034

Figure 145: Eastern Europe Market Value (US$ Million) by Product Type, 2024 to 2034

Figure 146: Eastern Europe Market Value (US$ Million) by Form, 2024 to 2034

Figure 147: Eastern Europe Market Value (US$ Million) by Source, 2024 to 2034

Figure 148: Eastern Europe Market Value (US$ Million) by Application, 2024 to 2034

Figure 149: Eastern Europe Market Value (US$ Million) by Distribution Channel, 2024 to 2034

Figure 150: Eastern Europe Market Value (US$ Million) by Country, 2024 to 2034

Figure 151: Eastern Europe Market Value (US$ Million) Analysis by Country, 2019 to 2034

Figure 152: Eastern Europe Market Volume (Tons) Analysis by Country, 2019 to 2034

Figure 153: Eastern Europe Market Value Share (%) and BPS Analysis by Country, 2024 to 2034

Figure 154: Eastern Europe Market Y-o-Y Growth (%) Projections by Country, 2024 to 2034

Figure 155: Eastern Europe Market Value (US$ Million) Analysis by Product Type, 2019 to 2034

Figure 156: Eastern Europe Market Volume (Tons) Analysis by Product Type, 2019 to 2034

Figure 157: Eastern Europe Market Value Share (%) and BPS Analysis by Product Type, 2024 to 2034

Figure 158: Eastern Europe Market Y-o-Y Growth (%) Projections by Product Type, 2024 to 2034

Figure 159: Eastern Europe Market Value (US$ Million) Analysis by Form, 2019 to 2034

Figure 160: Eastern Europe Market Volume (Tons) Analysis by Form, 2019 to 2034

Figure 161: Eastern Europe Market Value Share (%) and BPS Analysis by Form, 2024 to 2034

Figure 162: Eastern Europe Market Y-o-Y Growth (%) Projections by Form, 2024 to 2034

Figure 163: Eastern Europe Market Value (US$ Million) Analysis by Source, 2019 to 2034

Figure 164: Eastern Europe Market Volume (Tons) Analysis by Source, 2019 to 2034

Figure 165: Eastern Europe Market Value Share (%) and BPS Analysis by Source, 2024 to 2034

Figure 166: Eastern Europe Market Y-o-Y Growth (%) Projections by Source, 2024 to 2034

Figure 167: Eastern Europe Market Value (US$ Million) Analysis by Application, 2019 to 2034

Figure 168: Eastern Europe Market Volume (Tons) Analysis by Application, 2019 to 2034

Figure 169: Eastern Europe Market Value Share (%) and BPS Analysis by Application, 2024 to 2034

Figure 170: Eastern Europe Market Y-o-Y Growth (%) Projections by Application, 2024 to 2034

Figure 171: Eastern Europe Market Value (US$ Million) Analysis by Distribution Channel, 2019 to 2034

Figure 172: Eastern Europe Market Volume (Tons) Analysis by Distribution Channel, 2019 to 2034

Figure 173: Eastern Europe Market Value Share (%) and BPS Analysis by Distribution Channel, 2024 to 2034

Figure 174: Eastern Europe Market Y-o-Y Growth (%) Projections by Distribution Channel, 2024 to 2034

Figure 175: Eastern Europe Market Attractiveness by Product Type, 2024 to 2034

Figure 176: Eastern Europe Market Attractiveness by Form, 2024 to 2034

Figure 177: Eastern Europe Market Attractiveness by Source, 2024 to 2034

Figure 178: Eastern Europe Market Attractiveness by Application, 2024 to 2034

Figure 179: Eastern Europe Market Attractiveness by Distribution Channel, 2024 to 2034

Figure 180: Eastern Europe Market Attractiveness by Country, 2024 to 2034

Figure 181: South Asia and Pacific Market Value (US$ Million) by Product Type, 2024 to 2034

Figure 182: South Asia and Pacific Market Value (US$ Million) by Form, 2024 to 2034

Figure 183: South Asia and Pacific Market Value (US$ Million) by Source, 2024 to 2034

Figure 184: South Asia and Pacific Market Value (US$ Million) by Application, 2024 to 2034

Figure 185: South Asia and Pacific Market Value (US$ Million) by Distribution Channel, 2024 to 2034

Figure 186: South Asia and Pacific Market Value (US$ Million) by Country, 2024 to 2034

Figure 187: South Asia and Pacific Market Value (US$ Million) Analysis by Country, 2019 to 2034

Figure 188: South Asia and Pacific Market Volume (Tons) Analysis by Country, 2019 to 2034

Figure 189: South Asia and Pacific Market Value Share (%) and BPS Analysis by Country, 2024 to 2034

Figure 190: South Asia and Pacific Market Y-o-Y Growth (%) Projections by Country, 2024 to 2034

Figure 191: South Asia and Pacific Market Value (US$ Million) Analysis by Product Type, 2019 to 2034

Figure 192: South Asia and Pacific Market Volume (Tons) Analysis by Product Type, 2019 to 2034

Figure 193: South Asia and Pacific Market Value Share (%) and BPS Analysis by Product Type, 2024 to 2034

Figure 194: South Asia and Pacific Market Y-o-Y Growth (%) Projections by Product Type, 2024 to 2034

Figure 195: South Asia and Pacific Market Value (US$ Million) Analysis by Form, 2019 to 2034

Figure 196: South Asia and Pacific Market Volume (Tons) Analysis by Form, 2019 to 2034

Figure 197: South Asia and Pacific Market Value Share (%) and BPS Analysis by Form, 2024 to 2034

Figure 198: South Asia and Pacific Market Y-o-Y Growth (%) Projections by Form, 2024 to 2034

Figure 199: South Asia and Pacific Market Value (US$ Million) Analysis by Source, 2019 to 2034

Figure 200: South Asia and Pacific Market Volume (Tons) Analysis by Source, 2019 to 2034

Figure 201: South Asia and Pacific Market Value Share (%) and BPS Analysis by Source, 2024 to 2034

Figure 202: South Asia and Pacific Market Y-o-Y Growth (%) Projections by Source, 2024 to 2034

Figure 203: South Asia and Pacific Market Value (US$ Million) Analysis by Application, 2019 to 2034

Figure 204: South Asia and Pacific Market Volume (Tons) Analysis by Application, 2019 to 2034

Figure 205: South Asia and Pacific Market Value Share (%) and BPS Analysis by Application, 2024 to 2034

Figure 206: South Asia and Pacific Market Y-o-Y Growth (%) Projections by Application, 2024 to 2034

Figure 207: South Asia and Pacific Market Value (US$ Million) Analysis by Distribution Channel, 2019 to 2034

Figure 208: South Asia and Pacific Market Volume (Tons) Analysis by Distribution Channel, 2019 to 2034

Figure 209: South Asia and Pacific Market Value Share (%) and BPS Analysis by Distribution Channel, 2024 to 2034

Figure 210: South Asia and Pacific Market Y-o-Y Growth (%) Projections by Distribution Channel, 2024 to 2034

Figure 211: South Asia and Pacific Market Attractiveness by Product Type, 2024 to 2034

Figure 212: South Asia and Pacific Market Attractiveness by Form, 2024 to 2034

Figure 213: South Asia and Pacific Market Attractiveness by Source, 2024 to 2034

Figure 214: South Asia and Pacific Market Attractiveness by Application, 2024 to 2034

Figure 215: South Asia and Pacific Market Attractiveness by Distribution Channel, 2024 to 2034

Figure 216: South Asia and Pacific Market Attractiveness by Country, 2024 to 2034

Figure 217: East Asia Market Value (US$ Million) by Product Type, 2024 to 2034

Figure 218: East Asia Market Value (US$ Million) by Form, 2024 to 2034

Figure 219: East Asia Market Value (US$ Million) by Source, 2024 to 2034

Figure 220: East Asia Market Value (US$ Million) by Application, 2024 to 2034

Figure 221: East Asia Market Value (US$ Million) by Distribution Channel, 2024 to 2034

Figure 222: East Asia Market Value (US$ Million) by Country, 2024 to 2034

Figure 223: East Asia Market Value (US$ Million) Analysis by Country, 2019 to 2034

Figure 224: East Asia Market Volume (Tons) Analysis by Country, 2019 to 2034

Figure 225: East Asia Market Value Share (%) and BPS Analysis by Country, 2024 to 2034

Figure 226: East Asia Market Y-o-Y Growth (%) Projections by Country, 2024 to 2034

Figure 227: East Asia Market Value (US$ Million) Analysis by Product Type, 2019 to 2034

Figure 228: East Asia Market Volume (Tons) Analysis by Product Type, 2019 to 2034

Figure 229: East Asia Market Value Share (%) and BPS Analysis by Product Type, 2024 to 2034

Figure 230: East Asia Market Y-o-Y Growth (%) Projections by Product Type, 2024 to 2034

Figure 231: East Asia Market Value (US$ Million) Analysis by Form, 2019 to 2034

Figure 232: East Asia Market Volume (Tons) Analysis by Form, 2019 to 2034

Figure 233: East Asia Market Value Share (%) and BPS Analysis by Form, 2024 to 2034

Figure 234: East Asia Market Y-o-Y Growth (%) Projections by Form, 2024 to 2034

Figure 235: East Asia Market Value (US$ Million) Analysis by Source, 2019 to 2034

Figure 236: East Asia Market Volume (Tons) Analysis by Source, 2019 to 2034

Figure 237: East Asia Market Value Share (%) and BPS Analysis by Source, 2024 to 2034

Figure 238: East Asia Market Y-o-Y Growth (%) Projections by Source, 2024 to 2034

Figure 239: East Asia Market Value (US$ Million) Analysis by Application, 2019 to 2034

Figure 240: East Asia Market Volume (Tons) Analysis by Application, 2019 to 2034

Figure 241: East Asia Market Value Share (%) and BPS Analysis by Application, 2024 to 2034

Figure 242: East Asia Market Y-o-Y Growth (%) Projections by Application, 2024 to 2034

Figure 243: East Asia Market Value (US$ Million) Analysis by Distribution Channel, 2019 to 2034

Figure 244: East Asia Market Volume (Tons) Analysis by Distribution Channel, 2019 to 2034

Figure 245: East Asia Market Value Share (%) and BPS Analysis by Distribution Channel, 2024 to 2034

Figure 246: East Asia Market Y-o-Y Growth (%) Projections by Distribution Channel, 2024 to 2034

Figure 247: East Asia Market Attractiveness by Product Type, 2024 to 2034

Figure 248: East Asia Market Attractiveness by Form, 2024 to 2034

Figure 249: East Asia Market Attractiveness by Source, 2024 to 2034

Figure 250: East Asia Market Attractiveness by Application, 2024 to 2034

Figure 251: East Asia Market Attractiveness by Distribution Channel, 2024 to 2034

Figure 252: East Asia Market Attractiveness by Country, 2024 to 2034

Figure 253: Middle East and Africa Market Value (US$ Million) by Product Type, 2024 to 2034

Figure 254: Middle East and Africa Market Value (US$ Million) by Form, 2024 to 2034

Figure 255: Middle East and Africa Market Value (US$ Million) by Source, 2024 to 2034

Figure 256: Middle East and Africa Market Value (US$ Million) by Application, 2024 to 2034

Figure 257: Middle East and Africa Market Value (US$ Million) by Distribution Channel, 2024 to 2034

Figure 258: Middle East and Africa Market Value (US$ Million) by Country, 2024 to 2034

Figure 259: Middle East and Africa Market Value (US$ Million) Analysis by Country, 2019 to 2034

Figure 260: Middle East and Africa Market Volume (Tons) Analysis by Country, 2019 to 2034

Figure 261: Middle East and Africa Market Value Share (%) and BPS Analysis by Country, 2024 to 2034

Figure 262: Middle East and Africa Market Y-o-Y Growth (%) Projections by Country, 2024 to 2034

Figure 263: Middle East and Africa Market Value (US$ Million) Analysis by Product Type, 2019 to 2034

Figure 264: Middle East and Africa Market Volume (Tons) Analysis by Product Type, 2019 to 2034

Figure 265: Middle East and Africa Market Value Share (%) and BPS Analysis by Product Type, 2024 to 2034

Figure 266: Middle East and Africa Market Y-o-Y Growth (%) Projections by Product Type, 2024 to 2034

Figure 267: Middle East and Africa Market Value (US$ Million) Analysis by Form, 2019 to 2034

Figure 268: Middle East and Africa Market Volume (Tons) Analysis by Form, 2019 to 2034

Figure 269: Middle East and Africa Market Value Share (%) and BPS Analysis by Form, 2024 to 2034

Figure 270: Middle East and Africa Market Y-o-Y Growth (%) Projections by Form, 2024 to 2034

Figure 271: Middle East and Africa Market Value (US$ Million) Analysis by Source, 2019 to 2034

Figure 272: Middle East and Africa Market Volume (Tons) Analysis by Source, 2019 to 2034

Figure 273: Middle East and Africa Market Value Share (%) and BPS Analysis by Source, 2024 to 2034

Figure 274: Middle East and Africa Market Y-o-Y Growth (%) Projections by Source, 2024 to 2034

Figure 275: Middle East and Africa Market Value (US$ Million) Analysis by Application, 2019 to 2034

Figure 276: Middle East and Africa Market Volume (Tons) Analysis by Application, 2019 to 2034

Figure 277: Middle East and Africa Market Value Share (%) and BPS Analysis by Application, 2024 to 2034

Figure 278: Middle East and Africa Market Y-o-Y Growth (%) Projections by Application, 2024 to 2034

Figure 279: Middle East and Africa Market Value (US$ Million) Analysis by Distribution Channel, 2019 to 2034

Figure 280: Middle East and Africa Market Volume (Tons) Analysis by Distribution Channel, 2019 to 2034

Figure 281: Middle East and Africa Market Value Share (%) and BPS Analysis by Distribution Channel, 2024 to 2034

Figure 282: Middle East and Africa Market Y-o-Y Growth (%) Projections by Distribution Channel, 2024 to 2034

Figure 283: Middle East and Africa Market Attractiveness by Product Type, 2024 to 2034

Figure 284: Middle East and Africa Market Attractiveness by Form, 2024 to 2034

Figure 285: Middle East and Africa Market Attractiveness by Source, 2024 to 2034

Figure 286: Middle East and Africa Market Attractiveness by Application, 2024 to 2034

Figure 287: Middle East and Africa Market Attractiveness by Distribution Channel, 2024 to 2034

Figure 288: Middle East and Africa Market Attractiveness by Country, 2024 to 2034

Frequently Asked Questions

How Big is the Functional Protein Market?

The functional protein market is valued at USD 7,255.2 million in 2024.

What is the Projected CAGR of the Functional Protein Market?

The functional protein market size is expected to rise at a 4% CAGR through 2034.

How Big Will the Functional Protein Market Be by 2034?

The functional protein market is likely to be worth USD 10,518.4 million by 2034.

Which is the Leading Product Type in the Functional Protein Market?

Hydrolysates witness high demand in the industry.

Which Country is Rising at a Higher CAGR in the Functional Protein Market?

The functional protein market in China is expected to rise at a 7.0% CAGR through 2034.

Explore Similar Insights

Future Market Insights

Functional Protein Market