Functional Pet Ingredients Market Size, Share, and Forecast Outlook 2025 to 2035

The functional pet ingredients market is projected to grow from USD 12.5 billion in 2025 to USD 19.6 billion by 2035, expanding at a CAGR of 4.6% over the assessment period. Annual growth rises steadily from USD 0.58 billion in 2026 to USD 0.86 billion by 2035.
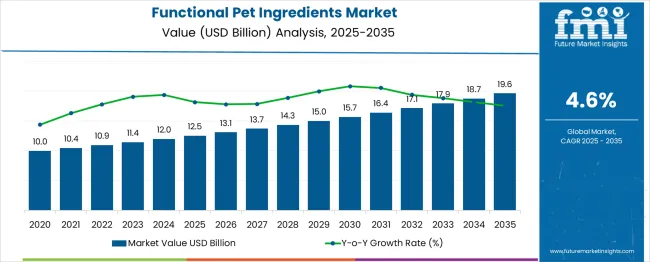
Quick Stats in Functional Pet Ingredients Market

  • Functional Pet Ingredients Market Size (2025): USD 12.5 billion
  • Projected Functional Pet Ingredients Market (2035): USD 19.6 billion
  • Forecast CAGR of Functional Pet Ingredients Market (2025 to 2035): 4.6%
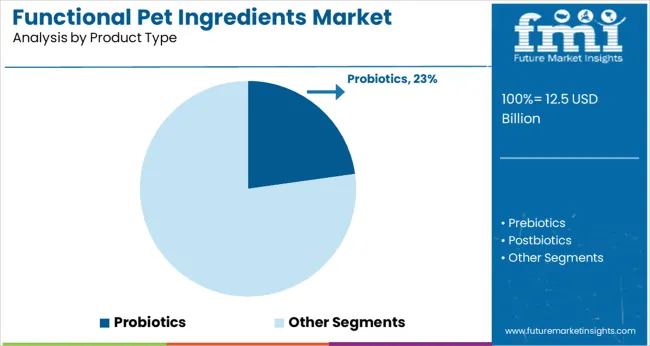
  • Leading Segment by Product Type of Functional Pet Ingredients Market (2025): Probiotics (23%)
  • Fastest Growing Countries in Functional Pet Ingredients Market (2025): Germany & Australia (3.3% CAGR each)
  • Top Key Players in Functional Pet Ingredients Market: DSM-Firmenich, Kemin Industries, Symrise (Nutrios), ADM (Pet Solutions), Nestlé Health Science (Purina)

Functional Pet Ingredients Market Market Value Analysis

Metric Value
Industry Size (2025E) USD 12.5 billion
Industry Value (2035F) USD 19.6 billion
CAGR (2025 to 2035) 4.6%

This positive trend reflects rising consumer focus on preventative pet health and tailored nutrition. The market benefits from increasing inclusion of ingredients that support joint health, digestive function, skin and coat condition, and cognitive well-being in both food and supplements.

After 2030, growth is further supported by expanding product innovation, particularly in probiotic, plant-based, and omega-rich formulations. With pet owners treating animals more like family members, demand for functional nutrition is expected to continue expanding across premium and mass-market tiers.

The functional pet ingredients segment holds a unique position within several converging industries. Within the global pet care market valued at USD 280 billion, functional nutrition makes up 6-8%, supported by rising demand for targeted health solutions.

In the USD 140 billion pet food space, 12-15% of new product development focuses on functional additives like probiotics, omega-3s, and joint-support compounds. Veterinary-backed supplements contribute nearly 10% of the USD 40 billion pet supplement industry, signaling clinical alignment. Premium brands allocate 8-12% of formulation costs to health-focused ingredients to differentiate offerings.

Even in the natural pet products segment, valued at USD 50 billion, around 7-9% is driven by clean-label functional inputs that reflect human wellness trends being mirrored in companion animal care.

Functional Pet Ingredients Market by Top Investment Segments

Sales of functional pet ingredients are being led by probiotics, soft chews, and digestive health claims. Dogs remain the dominant pet type, with strong retail traction in specialty stores and growing demand for plant-based, clean-label ingredient formulations.
Probiotics Lead as Preferred Functional Ingredient

Functional Pet Ingredients Market Analysis By Product Type

Probiotics are expected to capture 23% of the market by product type in 2025. Demand for functional pet ingredients with gut-supportive benefits is rising as awareness of microbiome health expands among pet owners. Probiotic strains help balance intestinal flora, boost immunity, and improve nutrient absorption. Manufacturers are introducing species-specific formulations tailored for dogs and cats.

  • Increasing usage of Bacillus and Lactobacillus strains in pet food formulations.
  • Growing veterinary endorsements for probiotics in chronic digestive care.
  • Probiotics gaining ground in freeze-dried treats and daily supplements.

Digestive Health Tops Functional Benefit Claims

Digestive health is forecast to account for 24.1% of the market by health claim in 2025. Functional pet ingredients targeting gastrointestinal wellness are resonating with owners focused on preventive care. Digestive aids like enzymes, fibers, and prebiotics are increasingly integrated into treats, toppers, and complete diets. Veterinary trends show strong alignment between gut health and overall vitality.
  • Pet owners are prioritizing products that prevent bloating, gas, and irregular stools.
  • Digestive claims often co-occur with immune and skin health benefits.
  • Functional labeling around gut support boosts shelf visibility and premium pricing.

Soft Chew Emerges as Popular Delivery Form

Functional Pet Ingredients Market Analysis By Form Type

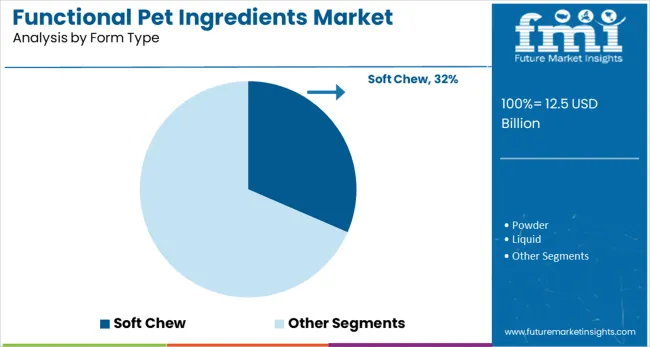
Soft chew formats are projected to hold a 32% share by form type in 2025. Sales of functional pet ingredients in soft chew delivery are increasing due to ease of administration and palatability. These treats double as supplements, eliminating the need for pills or powders. Senior pets and picky eaters particularly benefit from this form.
  • Functional chews combine vitamins, botanicals, and active ingredients in tasty formats.
  • Brands use appealing flavors like peanut butter and bacon to ensure compliance.
  • Soft chew products often come in daily-dose packaging for convenience.

Plant-Based Sources Expand Market Penetration

Functional Pet Ingredients Market Analysis By Source Type

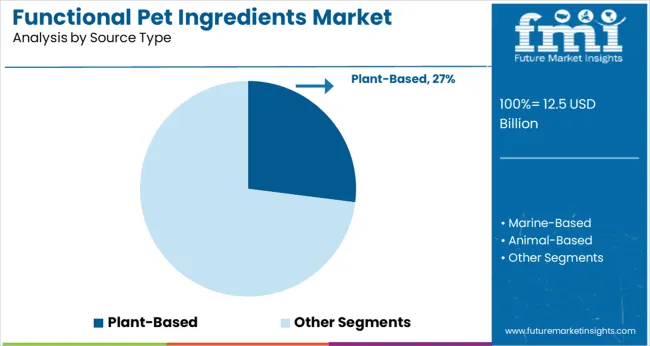
Plant-based ingredients are expected to contribute 27% of market share by source type in 2025. Demand for functional pet ingredients derived from natural botanicals is rising due to sustainability and perceived safety. Pea protein, turmeric, flaxseed, and ashwagandha are among the top-performing sources.
  • Plant-based ingredients are marketed as clean-label and allergen-friendly.
  • Growing alignment between human and pet food trends fuels innovation.
  • Formulators highlight adaptogenic and antioxidant-rich botanicals for wellness support.

Dogs Remain Primary Consumers of Functional Products

Functional Pet Ingredients Market Analysis By Pet Type

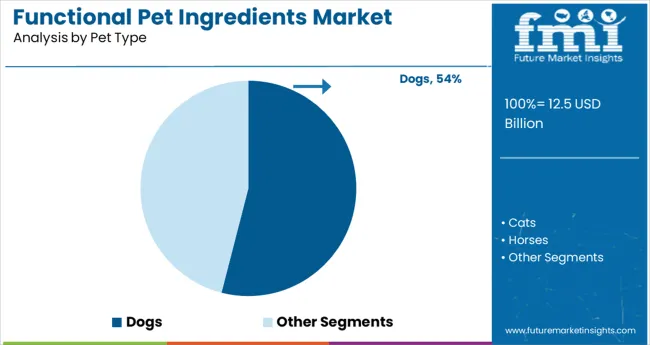
Dogs are expected to dominate with a 54% market share by pet type in 2025. Functional pet ingredient manufacturers are focusing heavily on canine-targeted SKUs, especially in large breeds and seniors. Dog owners actively seek solutions for joint, skin, gut, and cognitive health.
  • Nutraceuticals and functional kibbles are widely available for dogs across age groups.
  • Aging dogs drive sales of glucosamine, omega-3s, and probiotics.
  • Breed-specific and weight-adjusted formulations are gaining popularity.

Pet Specialty Retail Channels Continue to Lead

Functional Pet Ingredients Market Analysis By Sales Channel

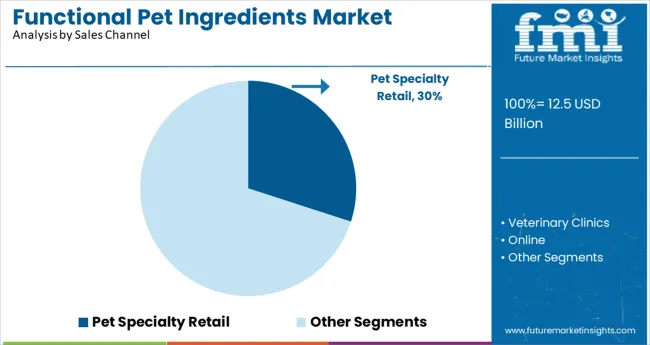
Pet specialty retail stores are projected to account for 30% of the market by sales channel in 2025. These outlets are preferred for their curated selections and staff expertise. Sales of functional pet ingredients through this channel benefit from premium positioning and brand storytelling.

  • Retailers often stock niche or emerging ingredient formulations not found in grocery stores.
  • In-store demos and product education increase shopper conversion.
  • Subscription models and loyalty programs support long-term consumer retention.

Top Functional Pet Ingredients Market Dynamics

The industry is accelerating as owners seek condition-specific formulations targeting immunity, digestion, mobility, and coat health. Ingredient innovations like postbiotics, adaptogens, and collagen peptides are driving premiumization. Growth is strongest in vet-recommended SKUs, senior pet nutrition, and gut-health-focused supplements across both canine and feline categories.

Postbiotics and Prebiotics Expand Gut-Health Segment

Postbiotic inclusion in dog and cat foods surged 41% in 2025, addressing microbiome balance and stool quality in high-sensitivity breeds. Brands using heat-treated Lactobacillus and yeast fermentates saw a 23% improvement in digestibility metrics. Functional treats with FOS and inulin grew 36%, especially in senior dog SKUs.

Subscription-based pet food services reported a 19% increase in repeat orders for gut-health lines featuring synbiotic blends. Veterinary channel formulations incorporating prebiotic fibers achieved 27% higher conversion in first-time customers. The combination of shelf-stable postbiotics with soluble fibers is reshaping product development in digestive care and establishing a new premium tier in functional formulations.

Joint Health SKUs Drive Collagen and Omega Inclusion

Pet food and supplements with collagen peptides and omega-3s saw a 38% YoY increase, driven by mobility support claims. Cold-pressed treats with type II collagen gained traction in aging dogs, with a 31% rise in reorder rates for SKUs targeting large-breed stiffness. EPA-DHA-rich algae oils replaced fish oil in 22% of new soft chew launches, offering better taste and shelf stability.

Veterinary-prescribed joint formulas grew 28%, with green-lipped mussel and MSM combinations gaining credibility in clinical trials. The convergence of clean-label mobility support and plant-sourced omegas is opening up cross-category innovations in functional jerky, toppers, and condition-specific wet diets.
Top Countries Developing, Integrating, and Commercializing Functional Pet Ingredients

Functional Pet Ingredients Market Cagr Analysis By Country

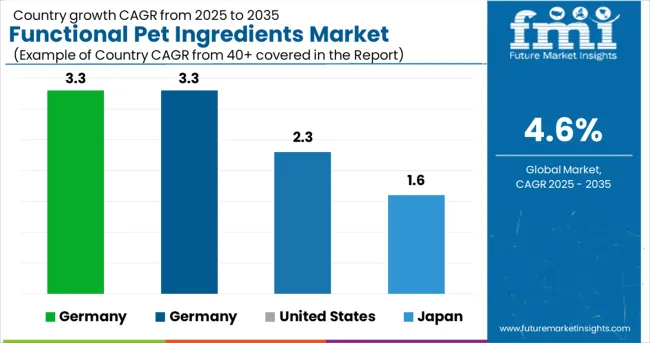
Countries CAGR (2025 to 2035)
Germany 3.3%
Australia 3.3%
United States 2.3%
Japan 1.6%

The global market is anticipated to expand at a CAGR of 4.6% from 2025 to 2035. This growth is largely fueled by shifting consumer attitudes toward pet wellness, particularly in emerging economies. Some OECD countries are seeing more subdued growth. The United States, for instance, is expected to register a CAGR of just 2.3% as the market reaches maturity and innovation plateaus in established pet food categories.

Similarly, Japan is forecast to grow at only 1.6%, reflecting an aging pet population and lower new product demand. In contrast, Germany and Australia are projected to grow at 3.3%, supported by evolving preferences for fortified pet food and premium dietary supplements.

While the global average remains robust, momentum is increasingly driven by emerging markets in Asia and Latin America rather than legacy economies. Strategic investments are shifting accordingly to capitalize on demand for functional formulations.

The report provides insights across 40+ countries. The four below are highlighted for their strategic influence and growth trajectory.

Germany’s Functional Pet Ingredients Market Expands with Natural Wellness Focus

Germany is forecasted to grow at a CAGR of 3.3% by 2035. During the 2020-2024 period, interest in natural supplements and herbal additives spurred demand for Functional Pet Ingredients. Moving forward, sales will benefit from increased awareness around pet obesity, digestive care, and age-related conditions.

  • Growing preference for natural and organic inputs in dog and cat food
  • Sales of Functional Pet Ingredients are supported by a rise in veterinary recommendations
  • Domestic brands are reformulating products to align with EU feed additive regulations

Functional Pet Ingredients Market Broadening in Australia

The market in Australia is set to grow at a CAGR of 3.3% through 2035. Over 2020-2024, the market expanded through direct-to-consumer channels and pet wellness startups. From 2025 onward, demand for Functional Pet Ingredients is expected to accelerate in natural kibble, grain-alternative diets, and holistic supplements.

  • Sales of Functional Pet Ingredients are driven by pet humanization trends
  • High protein and gut-health enhancing formulas are gaining visibility
  • Brands are integrating native Australian botanicals for added functionality

Demand Trends for Functional Pet Ingredients in the United States

The USA market is poised to grow at a CAGR of 2.3% through 2035. Between 2020 and 2024, the primary momentum came from premium pet food brands incorporating ingredients like omega-3s, probiotics, and antioxidants. Looking ahead, demand for Functional Pet Ingredients is expected to shift toward condition-specific formulations such as those targeting gut health and joint support.

  • Sales of Functional Pet Ingredients are stable in freeze-dried and wet pet food formats
  • Consumers are increasingly seeking clean-label and grain-free formulations
  • Regulatory clarity from AAFCO is encouraging broader ingredient adoption

Japan’s Aging Pet Population Shaping Ingredient Preferences

Japan is expected to see a modest CAGR of 1.6% through 2035. Between 2020 and 2024, Functional Pet Ingredients were primarily adopted in limited-edition wellness pet food products. Going forward, an aging pet population will shape future demand for Functional Pet Ingredients that support mobility, vision, and immune health.
  • Functional proteins and calcium-rich additives are gaining traction in senior pet diets
  • Sales of Functional Pet Ingredients are driven by urban households seeking premium nutrition
  • Niche brands are promoting fish oil, glucosamine, and taurine in small-batch formats

Leading Functional Pet Ingredients Providers

Functional Pet Ingredients Market Analysis By Company

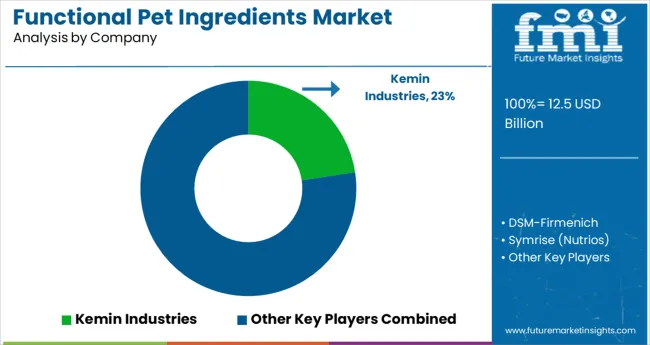
The market is witnessing intense competition, shaped by advancements in gut health, cognitive support, and mobility-enhancing solutions. Kemin Industries leads with a 22.6% share, driven by its patented postbiotics and natural antioxidant systems. DSM-Firmenich closely follows at 18.3%, leveraging innovations in algae-based omega-3s and immune-supporting nutrients.

ADM controls 16.1% of the market, with a stronghold in plant-based proteins and digestive prebiotics. Symrise, through its Nutrios division, commands 14.8%, particularly in palatability enhancers. Nestlé Health Science (Purina) contributes 12.4%, supported by clinical research and expanding functional portfolios.

Growth in the sector is projected at a 7.9% CAGR through 2035, with consumer demand favoring brands that combine science-backed efficacy with clean-label ingredient transparency.

Recent Functional Pet Ingredients Industry News

  • In May 2025, Nestlé acquired a minority stake in India-based Drools Pet Food, pushing the company’s valuation past USD1 billion. The investment is expected to accelerate Drools’ expansion into functional pet ingredients, particularly in the alternative protein segment, and enhance its product innovation and global distribution capabilities.

Leading Players in Functional Pet Ingredients Market

  • Kemin Industries
  • DSM-Firmenich
  • Symrise (Nutrios)
  • ADM (Pet Solutions)
  • Nestlé Health Science (Purina)

Report Coverage and Scope Summary

Report Attributes Details
Industry Size (2025) USD 12.5 billion
Projected Industry Size (2035) USD 19.6 billion
CAGR (2025 to 2035) 4.6%
Base Year for Estimation 2024
Historical Period 2020 to 2024
Projections Period 2025 to 2035
Quantitative Units USD billion for value
Product Types Analyzed (Segment 1) Prebiotics (Inulin, FOS, MOS), Probiotics, Postbiotics, Digestive Enzymes, Omega Fatty Acids (EPA, DHA, ALA), Collagen & Gelatin, Botanicals (Chamomile, Valerian Root, Turmeric, Green Tea, Milk Thistle), Functional Fibers (Pumpkin, Beet Pulp), Vitamins (C, E, D, B-complex), Minerals (Zinc, Magnesium, Selenium), Amino Acids, Antioxidants
Health Benefit Areas Analyzed (Segment 2) Digestive Health, Immune Support, Joint & Mobility, Skin & Coat Health, Cognitive & Brain Health, Stress & Anxiety Relief, Cardiovascular Health, Weight Management & Metabolism, Urinary Tract Support, Dental & Oral Care, Vision Health, Liver Support
Form Types Analyzed (Segment 3) Powder, Liquid, Soft Chew, Capsule/Tablet, Gel/Paste, Premix/Blend, Spray, Infused Treat, Functional Kibble Coating
Source Types Analyzed (Segment 4) Plant-Based, Marine-Based (Fish Oil, Algae), Animal-Based (Collagen, Organ Extracts), Fermentation-Derived (Probiotics, Enzymes, Postbiotics), Synthetic/Isolated Nutrients
Pet Types Analyzed (Segment 5) Dogs, Cats, Horses, Small Mammals (Rabbits, Guinea Pigs), Birds, Reptiles, Aquatic Pets (Fish)
Sales Channels Analyzed (Segment 6) Pet Specialty Retail, Veterinary Clinics, Online (DTC e-Commerce, Amazon, Brand Stores), Mass Merchandisers (Walmart, Target), Grocery Retail, Subscription Box/Auto-Ship Services, B2B/Ingredient Supply
Regions Covered North America, Latin America, Western Europe, Eastern Europe, East Asia, South Asia & Pacific, Middle East & Africa
Countries Covered United States, Canada, Germany, United Kingdom, France, Italy, Spain, China, India, Japan, South Korea, Australia, Brazil, Mexico, Argentina, Saudi Arabia, UAE, South Africa
Key Players Kemin Industries, DSM- Firmenich, Symrise ( Nutrios ), ADM (Pet Solutions), Nestlé Health Science (Purina)
Additional Attributes Dollar sales, share by ingredient category and health benefit, rising demand for natural and functional supplements in pet nutrition, wide adoption in canine and feline diets, regional variation in formulation trends

Functional Pet Ingredients Market Analyzed by Key Investment Segments

By Product Type:

Includes prebiotics (Inulin, FOS, MOS), probiotics, postbiotics, digestive enzymes, omega fatty acids (EPA, DHA, ALA), collagen & gelatin, botanicals (Chamomile, Valerian Root, Turmeric, Green Tea, Milk Thistle), functional fibers (Pumpkin, Beet Pulp), vitamins (C, E, D, B-complex), minerals (Zinc, Magnesium, Selenium), amino acids, and antioxidants.

By Health Claim / Benefit Area:

Covers digestive health, immune support, joint & mobility, skin & coat health, cognitive & brain health, stress & anxiety relief, cardiovascular health, weight management & metabolism, urinary tract support, dental & oral care, vision health, and liver support.

By Form Type:

Available formats include powder, liquid, soft chew, capsule/tablet, gel/paste, premix/blend, spray, infused treat, and functional kibble coating.

By Source Type:

Derived from plant-based, marine-based (Fish Oil, Algae), animal-based (Collagen, Organ Extracts), fermentation-derived (Probiotics, Enzymes, Postbiotics), and synthetic/isolated nutrients.

By Pet Type:

Target animals include dogs, cats, horses, small mammals (rabbits, guinea pigs), birds, reptiles, and aquatic pets (fish).

By Sales Channel:

Distributed via pet specialty retail, veterinary clinics, online (DTC e-commerce, Amazon, brand stores), mass merchandisers (Walmart, Target), grocery retail, subscription box/auto-ship services, and B2B/ingredient supply.

By Region:

Covers North America, Latin America, East Asia, South Asia & Pacific, Eastern Europe, and Western Europe.

Table of Content

  1. Executive Summary
    • Global Market Outlook
    • Demand-side Trends
    • Supply-side Trends
    • Technology Roadmap Analysis
    • Analysis and Recommendations
  2. Market Overview
    • Market Coverage / Taxonomy
    • Market Definition / Scope / Limitations
  3. Market Background
    • Market Dynamics
      • Drivers
      • Restraints
      • Opportunity
      • Trends
    • Scenario Forecast
      • Demand in Optimistic Scenario
      • Demand in Likely Scenario
      • Demand in Conservative Scenario
    • Opportunity Map Analysis
    • Product Life Cycle Analysis
    • Supply Chain Analysis
      • Supply Side Participants and their Roles
        • Producers
        • Mid-Level Participants (Traders/ Agents/ Brokers)
        • Wholesalers and Distributors
      • Value Added and Value Created at Node in the Supply Chain
      • List of Raw Material Suppliers
      • List of Existing and Potential Buyer’s
    • Investment Feasibility Matrix
    • Value Chain Analysis
      • Profit Margin Analysis
      • Wholesalers and Distributors
      • Retailers
    • PESTLE and Porter’s Analysis
    • Regulatory Landscape
      • By Key Regions
      • By Key Countries
    • Regional Parent Market Outlook
    • Production and Consumption Statistics
    • Import and Export Statistics
  4. Global Market Analysis 2020 to 2024 and Forecast, 2025 to 2035
    • Historical Market Size Value (USD Billion) & Volume (MT) Analysis, 2020 to 2024
    • Current and Future Market Size Value (USD Billion) & Volume (MT) Projections, 2025 to 2035
      • Y-o-Y Growth Trend Analysis
      • Absolute $ Opportunity Analysis
  5. Global Market Pricing Analysis 2020 to 2024 and Forecast 2025 to 2035
  6. Global Market Analysis 2020 to 2024 and Forecast 2025 to 2035, By Product Type
    • Introduction / Key Findings
    • Historical Market Size Value (USD Billion) & Volume (MT) Analysis By Product Type, 2020 to 2024
    • Current and Future Market Size Value (USD Billion) & Volume (MT) Analysis and Forecast By Product Type, 2025 to 2035
      • Prebiotics
        • Inulin
        • FOS
        • MOS
      • Probiotics
      • Postbiotics
      • Digestive Enzymes
      • Omega Fatty Acids
        • EPA
        • DHA
        • ALA
      • Collagen & Gelatin
      • Botanicals;
        • Chamomile
        • Valerian Root
        • Turmeric
        • Green Tea
        • Milk Thistle
      • Functional Fibers;
        • Pumpkin
        • Beet Pulp
      • Vitamins
        • Vitamin C
        • Vitamin E
        • Vitamin D
        • B-complex
      • Minerals
        • Zinc
        • Magnesium
        • Selenium
      • Amino Acids
      • Antioxidants
    • Y-o-Y Growth Trend Analysis By Product Type, 2020 to 2024
    • Absolute $ Opportunity Analysis By Product Type, 2025 to 2035
  7. Global Market Analysis 2020 to 2024 and Forecast 2025 to 2035, By Health Claim / Benefit Area
    • Introduction / Key Findings
    • Historical Market Size Value (USD Billion) & Volume (MT) Analysis By Health Claim / Benefit Area, 2020 to 2024
    • Current and Future Market Size Value (USD Billion) & Volume (MT) Analysis and Forecast By Health Claim / Benefit Area, 2025 to 2035
      • Digestive Health
      • Immune Support
      • Joint & Mobility
      • Skin & Coat Health
      • Cognitive & Brain Health
      • Stress & Anxiety Relief
      • Cardiovascular Health
      • Weight Management & Metabolism
      • Urinary Tract Support
      • Dental & Oral Care
      • Vision Health
      • Liver Support
    • Y-o-Y Growth Trend Analysis By Health Claim / Benefit Area, 2020 to 2024
    • Absolute $ Opportunity Analysis By Health Claim / Benefit Area, 2025 to 2035
  8. Global Market Analysis 2020 to 2024 and Forecast 2025 to 2035, By Form Type
    • Introduction / Key Findings
    • Historical Market Size Value (USD Billion) & Volume (MT) Analysis By Form Type, 2020 to 2024
    • Current and Future Market Size Value (USD Billion) & Volume (MT) Analysis and Forecast By Form Type, 2025 to 2035
      • Powder
      • Liquid
      • Soft Chew
      • Capsule / Tablet
      • Gel / Paste
      • Premix / Blend
      • Spray
      • Infused Treat
      • Functional Kibble Coating
    • Y-o-Y Growth Trend Analysis By Form Type, 2020 to 2024
    • Absolute $ Opportunity Analysis By Form Type, 2025 to 2035
  9. Global Market Analysis 2020 to 2024 and Forecast 2025 to 2035, By Source Type
    • Introduction / Key Findings
    • Historical Market Size Value (USD Billion) & Volume (MT) Analysis By Source Type, 2020 to 2024
    • Current and Future Market Size Value (USD Billion) & Volume (MT) Analysis and Forecast By Source Type, 2025 to 2035
      • Plant-Based
      • Marine-Based
        • Fish
        • Oil
        • Algae
      • Animal-Based;
        • Collagen
        • Organ Extracts
      • Fermentation-Derived
        • Probiotics
        • Enzymes
        • Postbiotics
      • Synthetic / Isolated Nutrients
    • Y-o-Y Growth Trend Analysis By Source Type, 2020 to 2024
    • Absolute $ Opportunity Analysis By Source Type, 2025 to 2035
  10. Global Market Analysis 2020 to 2024 and Forecast 2025 to 2035, By Pet Type
    • Introduction / Key Findings
    • Historical Market Size Value (USD Billion) & Volume (MT) Analysis By Pet Type, 2020 to 2024
    • Current and Future Market Size Value (USD Billion) & Volume (MT) Analysis and Forecast By Pet Type, 2025 to 2035
      • Dogs
      • Cats
      • Horses
      • Small Mammals;
        • Rabbits
        • Guinea Pigs
      • Birds
      • Reptiles
      • Aquatic Pets
        • Fish
    • Y-o-Y Growth Trend Analysis By Pet Type, 2020 to 2024
    • Absolute $ Opportunity Analysis By Pet Type, 2025 to 2035
  11. Global Market Analysis 2020 to 2024 and Forecast 2025 to 2035, By Sales Channel
    • Introduction / Key Findings
    • Historical Market Size Value (USD Billion) & Volume (MT) Analysis By Sales Channel, 2020 to 2024
    • Current and Future Market Size Value (USD Billion) & Volume (MT) Analysis and Forecast By Sales Channel, 2025 to 2035
      • Pet Specialty Retail
      • Veterinary Clinics
      • Online
        • DTC E-commerce
        • Amazon
        • Brand Stores
      • Mass Merchandisers;
        • Walmart
        • Target
      • Grocery Retail
      • Subscription Box / Auto-ship Services
      • B2B / Ingredient Supply
    • Y-o-Y Growth Trend Analysis By Sales Channel, 2020 to 2024
    • Absolute $ Opportunity Analysis By Sales Channel, 2025 to 2035
  12. Global Market Analysis 2020 to 2024 and Forecast 2025 to 2035, By Region
    • Introduction
    • Historical Market Size Value (USD Billion) & Volume (MT) Analysis By Region, 2020 to 2024
    • Current Market Size Value (USD Billion) & Volume (MT) Analysis and Forecast By Region, 2025 to 2035
      • North America
      • Latin America
      • Western Europe
      • Eastern Europe
      • East Asia
      • South Asia & Pacific
      • Middle East and Africa
    • Market Attractiveness Analysis By Region
  13. North America Market Analysis 2020 to 2024 and Forecast 2025 to 2035, By Country
    • Historical Market Size Value (USD Billion) & Volume (MT) Trend Analysis By Market Taxonomy, 2020 to 2024
    • Market Size Value (USD Billion) & Volume (MT) Forecast By Market Taxonomy, 2025 to 2035
      • By Country
        • USA
        • Canada
        • Mexico
      • By Product Type
      • By Health Claim / Benefit Area
      • By Form Type
      • By Source Type
      • By Pet Type
      • By Sales Channel
    • Market Attractiveness Analysis
      • By Country
      • By Product Type
      • By Health Claim / Benefit Area
      • By Form Type
      • By Source Type
      • By Pet Type
      • By Sales Channel
    • Key Takeaways
  14. Latin America Market Analysis 2020 to 2024 and Forecast 2025 to 2035, By Country
    • Historical Market Size Value (USD Billion) & Volume (MT) Trend Analysis By Market Taxonomy, 2020 to 2024
    • Market Size Value (USD Billion) & Volume (MT) Forecast By Market Taxonomy, 2025 to 2035
      • By Country
        • Brazil
        • Argentina
        • Rest of LATAM
      • By Product Type
      • By Health Claim / Benefit Area
      • By Form Type
      • By Source Type
      • By Pet Type
      • By Sales Channel
    • Market Attractiveness Analysis
      • By Country
      • By Product Type
      • By Health Claim / Benefit Area
      • By Form Type
      • By Source Type
      • By Pet Type
      • By Sales Channel
    • Key Takeaways
  15. Western Europe Market Analysis 2020 to 2024 and Forecast 2025 to 2035, By Country
    • Historical Market Size Value (USD Billion) & Volume (MT) Trend Analysis By Market Taxonomy, 2020 to 2024
    • Market Size Value (USD Billion) & Volume (MT) Forecast By Market Taxonomy, 2025 to 2035
      • By Country
        • Germany
        • Italy
        • France
        • UK
        • Spain
        • BENELUX
        • Nordic
        • Rest of W.Europe
      • By Product Type
      • By Health Claim / Benefit Area
      • By Form Type
      • By Source Type
      • By Pet Type
      • By Sales Channel
    • Market Attractiveness Analysis
      • By Country
      • By Product Type
      • By Health Claim / Benefit Area
      • By Form Type
      • By Source Type
      • By Pet Type
      • By Sales Channel
    • Key Takeaways
  16. Eastern Europe Market Analysis 2020 to 2024 and Forecast 2025 to 2035, By Country
    • Historical Market Size Value (USD Billion) & Volume (MT) Trend Analysis By Market Taxonomy, 2020 to 2024
    • Market Size Value (USD Billion) & Volume (MT) Forecast By Market Taxonomy, 2025 to 2035
      • By Country
        • Russia
        • Hungary
        • Poland
        • Balkan & Baltics
        • Rest of E. Europe
      • By Product Type
      • By Health Claim / Benefit Area
      • By Form Type
      • By Source Type
      • By Pet Type
      • By Sales Channel
    • Market Attractiveness Analysis
      • By Country
      • By Product Type
      • By Health Claim / Benefit Area
      • By Form Type
      • By Source Type
      • By Pet Type
      • By Sales Channel
    • Key Takeaways
  17. East Asia Market Analysis 2020 to 2024 and Forecast 2025 to 2035, By Country
    • Historical Market Size Value (USD Billion) & Volume (MT) Trend Analysis By Market Taxonomy, 2020 to 2024
    • Market Size Value (USD Billion) & Volume (MT) Forecast By Market Taxonomy, 2025 to 2035
      • By Country
        • China
        • Japan
        • South Korea
      • By Product Type
      • By Health Claim / Benefit Area
      • By Form Type
      • By Source Type
      • By Pet Type
      • By Sales Channel
    • Market Attractiveness Analysis
      • By Country
      • By Product Type
      • By Health Claim / Benefit Area
      • By Form Type
      • By Source Type
      • By Pet Type
      • By Sales Channel
    • Key Takeaways
  18. South Asia & Pacific Market Analysis 2020 to 2024 and Forecast 2025 to 2035, By Country
    • Historical Market Size Value (USD Billion) & Volume (MT) Trend Analysis By Market Taxonomy, 2020 to 2024
    • Market Size Value (USD Billion) & Volume (MT) Forecast By Market Taxonomy, 2025 to 2035
      • By Country
        • India
        • Australia & New Zealand
        • ASEAN
        • Rest of SAP
      • By Product Type
      • By Health Claim / Benefit Area
      • By Form Type
      • By Source Type
      • By Pet Type
      • By Sales Channel
    • Market Attractiveness Analysis
      • By Country
      • By Product Type
      • By Health Claim / Benefit Area
      • By Form Type
      • By Source Type
      • By Pet Type
      • By Sales Channel
    • Key Takeaways
  19. Middle East and Africa Market Analysis 2020 to 2024 and Forecast 2025 to 2035, By Country
    • Historical Market Size Value (USD Billion) & Volume (MT) Trend Analysis By Market Taxonomy, 2020 to 2024
    • Market Size Value (USD Billion) & Volume (MT) Forecast By Market Taxonomy, 2025 to 2035
      • By Country
        • GCC Countries
        • Northern Africa
        • South Africa
        • Turkiye
        • Rest of MEA
      • By Product Type
      • By Health Claim / Benefit Area
      • By Form Type
      • By Source Type
      • By Pet Type
      • By Sales Channel
    • Market Attractiveness Analysis
      • By Country
      • By Product Type
      • By Health Claim / Benefit Area
      • By Form Type
      • By Source Type
      • By Pet Type
      • By Sales Channel
    • Key Takeaways
  20. Key Countries Market Analysis
    • USA
      • Pricing Analysis
      • Market Share Analysis, 2024
        • By Product Type
        • By Health Claim / Benefit Area
        • By Form Type
        • By Source Type
        • By Pet Type
        • By Sales Channel
    • Canada
      • Pricing Analysis
      • Market Share Analysis, 2024
        • By Product Type
        • By Health Claim / Benefit Area
        • By Form Type
        • By Source Type
        • By Pet Type
        • By Sales Channel
    • Brazil
      • Pricing Analysis
      • Market Share Analysis, 2024
        • By Product Type
        • By Health Claim / Benefit Area
        • By Form Type
        • By Source Type
        • By Pet Type
        • By Sales Channel
    • Mexico
      • Pricing Analysis
      • Market Share Analysis, 2024
        • By Product Type
        • By Health Claim / Benefit Area
        • By Form Type
        • By Source Type
        • By Pet Type
        • By Sales Channel
    • Argentina
      • Pricing Analysis
      • Market Share Analysis, 2024
        • By Product Type
        • By Health Claim / Benefit Area
        • By Form Type
        • By Source Type
        • By Pet Type
        • By Sales Channel
  21. Market Structure Analysis
    • Competition Dashboard
    • Competition Benchmarking
    • Market Share Analysis of Top Players
      • By Regional
      • By Product Type
      • By Health Claim / Benefit Area
      • By Form Type
      • By Source Type
      • By Pet Type
      • By Sales Channel
  22. Competition Analysis
    • Competition Deep Dive
      • Kemin Industries
        • Overview
        • Product Portfolio
        • Profitability by Market Segments (Product/Age /Sales Channel/Region)
        • Sales Footprint
        • Strategy Overview
          • Marketing Strategy
          • Product Strategy
          • Channel Strategy
      • DSM-Firmenich
        • Overview
        • Product Portfolio
        • Profitability by Market Segments (Product/Age /Sales Channel/Region)
        • Sales Footprint
        • Strategy Overview
          • Marketing Strategy
          • Product Strategy
          • Channel Strategy
      • Symrise (Nutrios)
        • Overview
        • Product Portfolio
        • Profitability by Market Segments (Product/Age /Sales Channel/Region)
        • Sales Footprint
        • Strategy Overview
          • Marketing Strategy
          • Product Strategy
          • Channel Strategy
      • ADM (Pet Solutions)
        • Overview
        • Product Portfolio
        • Profitability by Market Segments (Product/Age /Sales Channel/Region)
        • Sales Footprint
        • Strategy Overview
          • Marketing Strategy
          • Product Strategy
          • Channel Strategy
      • Nestlé Health Science (Purina)
        • Overview
        • Product Portfolio
        • Profitability by Market Segments (Product/Age /Sales Channel/Region)
        • Sales Footprint
        • Strategy Overview
          • Marketing Strategy
          • Product Strategy
          • Channel Strategy
  23. Assumptions & Acronyms Used
  24. Research Methodology

List of Tables

  • Table 1: Global Market Value (USD Billion) Forecast by Region, 2020-2035
  • Table 2: Global Market Volume (MT) Forecast by Region, 2020-2035
  • Table 3: Global Market Value (USD Billion) Forecast by Product Type, 2020-2035
  • Table 4: Global Market Volume (MT) Forecast by Product Type, 2020-2035
  • Table 5: Global Market Value (USD Billion) Forecast by Health Claim / Benefit Area, 2020-2035
  • Table 6: Global Market Volume (MT) Forecast by Health Claim / Benefit Area, 2020-2035
  • Table 7: Global Market Value (USD Billion) Forecast by Form Type, 2020-2035
  • Table 8: Global Market Volume (MT) Forecast by Form Type, 2020-2035
  • Table 9: Global Market Value (USD Billion) Forecast by Source Type, 2020-2035
  • Table 10: Global Market Volume (MT) Forecast by Source Type, 2020-2035
  • Table 11: Global Market Value (USD Billion) Forecast by Pet Type, 2020-2035
  • Table 12: Global Market Volume (MT) Forecast by Pet Type, 2020-2035
  • Table 13: Global Market Value (USD Billion) Forecast by Sales Channel, 2020-2035
  • Table 14: Global Market Volume (MT) Forecast by Sales Channel, 2020-2035
  • Table 15: North America Market Value (USD Billion) Forecast by Country, 2020-2035
  • Table 16: North America Market Volume (MT) Forecast by Country, 2020-2035
  • Table 17: North America Market Value (USD Billion) Forecast by Product Type, 2020-2035
  • Table 18: North America Market Volume (MT) Forecast by Product Type, 2020-2035
  • Table 19: North America Market Value (USD Billion) Forecast by Health Claim / Benefit Area, 2020-2035
  • Table 20: North America Market Volume (MT) Forecast by Health Claim / Benefit Area, 2020-2035
  • Table 21: North America Market Value (USD Billion) Forecast by Form Type, 2020-2035
  • Table 22: North America Market Volume (MT) Forecast by Form Type, 2020-2035
  • Table 23: North America Market Value (USD Billion) Forecast by Source Type, 2020-2035
  • Table 24: North America Market Volume (MT) Forecast by Source Type, 2020-2035
  • Table 25: North America Market Value (USD Billion) Forecast by Pet Type, 2020-2035
  • Table 26: North America Market Volume (MT) Forecast by Pet Type, 2020-2035
  • Table 27: North America Market Value (USD Billion) Forecast by Sales Channel, 2020-2035
  • Table 28: North America Market Volume (MT) Forecast by Sales Channel, 2020-2035
  • Table 29: Latin America Market Value (USD Billion) Forecast by Country, 2020-2035
  • Table 30: Latin America Market Volume (MT) Forecast by Country, 2020-2035
  • Table 31: Latin America Market Value (USD Billion) Forecast by Product Type, 2020-2035
  • Table 32: Latin America Market Volume (MT) Forecast by Product Type, 2020-2035
  • Table 33: Latin America Market Value (USD Billion) Forecast by Health Claim / Benefit Area, 2020-2035
  • Table 34: Latin America Market Volume (MT) Forecast by Health Claim / Benefit Area, 2020-2035
  • Table 35: Latin America Market Value (USD Billion) Forecast by Form Type, 2020-2035
  • Table 36: Latin America Market Volume (MT) Forecast by Form Type, 2020-2035
  • Table 37: Latin America Market Value (USD Billion) Forecast by Source Type, 2020-2035
  • Table 38: Latin America Market Volume (MT) Forecast by Source Type, 2020-2035
  • Table 39: Latin America Market Value (USD Billion) Forecast by Pet Type, 2020-2035
  • Table 40: Latin America Market Volume (MT) Forecast by Pet Type, 2020-2035
  • Table 41: Latin America Market Value (USD Billion) Forecast by Sales Channel, 2020-2035
  • Table 42: Latin America Market Volume (MT) Forecast by Sales Channel, 2020-2035
  • Table 43: Western Europe Market Value (USD Billion) Forecast by Country, 2020-2035
  • Table 44: Western Europe Market Volume (MT) Forecast by Country, 2020-2035
  • Table 45: Western Europe Market Value (USD Billion) Forecast by Product Type, 2020-2035
  • Table 46: Western Europe Market Volume (MT) Forecast by Product Type, 2020-2035
  • Table 47: Western Europe Market Value (USD Billion) Forecast by Health Claim / Benefit Area, 2020-2035
  • Table 48: Western Europe Market Volume (MT) Forecast by Health Claim / Benefit Area, 2020-2035
  • Table 49: Western Europe Market Value (USD Billion) Forecast by Form Type, 2020-2035
  • Table 50: Western Europe Market Volume (MT) Forecast by Form Type, 2020-2035
  • Table 51: Western Europe Market Value (USD Billion) Forecast by Source Type, 2020-2035
  • Table 52: Western Europe Market Volume (MT) Forecast by Source Type, 2020-2035
  • Table 53: Western Europe Market Value (USD Billion) Forecast by Pet Type, 2020-2035
  • Table 54: Western Europe Market Volume (MT) Forecast by Pet Type, 2020-2035
  • Table 55: Western Europe Market Value (USD Billion) Forecast by Sales Channel, 2020-2035
  • Table 56: Western Europe Market Volume (MT) Forecast by Sales Channel, 2020-2035
  • Table 57: Eastern Europe Market Value (USD Billion) Forecast by Country, 2020-2035
  • Table 58: Eastern Europe Market Volume (MT) Forecast by Country, 2020-2035
  • Table 59: Eastern Europe Market Value (USD Billion) Forecast by Product Type, 2020-2035
  • Table 60: Eastern Europe Market Volume (MT) Forecast by Product Type, 2020-2035
  • Table 61: Eastern Europe Market Value (USD Billion) Forecast by Health Claim / Benefit Area, 2020-2035
  • Table 62: Eastern Europe Market Volume (MT) Forecast by Health Claim / Benefit Area, 2020-2035
  • Table 63: Eastern Europe Market Value (USD Billion) Forecast by Form Type, 2020-2035
  • Table 64: Eastern Europe Market Volume (MT) Forecast by Form Type, 2020-2035
  • Table 65: Eastern Europe Market Value (USD Billion) Forecast by Source Type, 2020-2035
  • Table 66: Eastern Europe Market Volume (MT) Forecast by Source Type, 2020-2035
  • Table 67: Eastern Europe Market Value (USD Billion) Forecast by Pet Type, 2020-2035
  • Table 68: Eastern Europe Market Volume (MT) Forecast by Pet Type, 2020-2035
  • Table 69: Eastern Europe Market Value (USD Billion) Forecast by Sales Channel, 2020-2035
  • Table 70: Eastern Europe Market Volume (MT) Forecast by Sales Channel, 2020-2035
  • Table 71: East Asia Market Value (USD Billion) Forecast by Country, 2020-2035
  • Table 72: East Asia Market Volume (MT) Forecast by Country, 2020-2035
  • Table 73: East Asia Market Value (USD Billion) Forecast by Product Type, 2020-2035
  • Table 74: East Asia Market Volume (MT) Forecast by Product Type, 2020-2035
  • Table 75: East Asia Market Value (USD Billion) Forecast by Health Claim / Benefit Area, 2020-2035
  • Table 76: East Asia Market Volume (MT) Forecast by Health Claim / Benefit Area, 2020-2035
  • Table 77: East Asia Market Value (USD Billion) Forecast by Form Type, 2020-2035
  • Table 78: East Asia Market Volume (MT) Forecast by Form Type, 2020-2035
  • Table 79: East Asia Market Value (USD Billion) Forecast by Source Type, 2020-2035
  • Table 80: East Asia Market Volume (MT) Forecast by Source Type, 2020-2035
  • Table 81: East Asia Market Value (USD Billion) Forecast by Pet Type, 2020-2035
  • Table 82: East Asia Market Volume (MT) Forecast by Pet Type, 2020-2035
  • Table 83: East Asia Market Value (USD Billion) Forecast by Sales Channel, 2020-2035
  • Table 84: East Asia Market Volume (MT) Forecast by Sales Channel, 2020-2035
  • Table 85: South Asia & Pacific Market Value (USD Billion) Forecast by Country, 2020-2035
  • Table 86: South Asia & Pacific Market Volume (MT) Forecast by Country, 2020-2035
  • Table 87: South Asia & Pacific Market Value (USD Billion) Forecast by Product Type, 2020-2035
  • Table 88: South Asia & Pacific Market Volume (MT) Forecast by Product Type, 2020-2035
  • Table 89: South Asia & Pacific Market Value (USD Billion) Forecast by Health Claim / Benefit Area, 2020-2035
  • Table 90: South Asia & Pacific Market Volume (MT) Forecast by Health Claim / Benefit Area, 2020-2035
  • Table 91: South Asia & Pacific Market Value (USD Billion) Forecast by Form Type, 2020-2035
  • Table 92: South Asia & Pacific Market Volume (MT) Forecast by Form Type, 2020-2035
  • Table 93: South Asia & Pacific Market Value (USD Billion) Forecast by Source Type, 2020-2035
  • Table 94: South Asia & Pacific Market Volume (MT) Forecast by Source Type, 2020-2035
  • Table 95: South Asia & Pacific Market Value (USD Billion) Forecast by Pet Type, 2020-2035
  • Table 96: South Asia & Pacific Market Volume (MT) Forecast by Pet Type, 2020-2035
  • Table 97: South Asia & Pacific Market Value (USD Billion) Forecast by Sales Channel, 2020-2035
  • Table 98: South Asia & Pacific Market Volume (MT) Forecast by Sales Channel, 2020-2035
  • Table 99: Middle East and Africa Market Value (USD Billion) Forecast by Country, 2020-2035
  • Table 100: Middle East and Africa Market Volume (MT) Forecast by Country, 2020-2035
  • Table 101: Middle East and Africa Market Value (USD Billion) Forecast by Product Type, 2020-2035
  • Table 102: Middle East and Africa Market Volume (MT) Forecast by Product Type, 2020-2035
  • Table 103: Middle East and Africa Market Value (USD Billion) Forecast by Health Claim / Benefit Area, 2020-2035
  • Table 104: Middle East and Africa Market Volume (MT) Forecast by Health Claim / Benefit Area, 2020-2035
  • Table 105: Middle East and Africa Market Value (USD Billion) Forecast by Form Type, 2020-2035
  • Table 106: Middle East and Africa Market Volume (MT) Forecast by Form Type, 2020-2035
  • Table 107: Middle East and Africa Market Value (USD Billion) Forecast by Source Type, 2020-2035
  • Table 108: Middle East and Africa Market Volume (MT) Forecast by Source Type, 2020-2035
  • Table 109: Middle East and Africa Market Value (USD Billion) Forecast by Pet Type, 2020-2035
  • Table 110: Middle East and Africa Market Volume (MT) Forecast by Pet Type, 2020-2035
  • Table 111: Middle East and Africa Market Value (USD Billion) Forecast by Sales Channel, 2020-2035
  • Table 112: Middle East and Africa Market Volume (MT) Forecast by Sales Channel, 2020-2035

List of Figures

  • Figure 1: Global Market Volume (MT) Forecast 2020-2035
  • Figure 2: Global Market Pricing Analysis
  • Figure 3: Global Market Value (USD Billion) Forecast 2020-2035
  • Figure 4: Global Market Value Share and BPS Analysis by Product Type, 2025 and 2035
  • Figure 5: Global Market Y-o-Y Growth Comparison by Product Type, 2025-2035
  • Figure 6: Global Market Attractiveness Analysis by Product Type
  • Figure 7: Global Market Value Share and BPS Analysis by Health Claim / Benefit Area, 2025 and 2035
  • Figure 8: Global Market Y-o-Y Growth Comparison by Health Claim / Benefit Area, 2025-2035
  • Figure 9: Global Market Attractiveness Analysis by Health Claim / Benefit Area
  • Figure 10: Global Market Value Share and BPS Analysis by Form Type, 2025 and 2035
  • Figure 11: Global Market Y-o-Y Growth Comparison by Form Type, 2025-2035
  • Figure 12: Global Market Attractiveness Analysis by Form Type
  • Figure 13: Global Market Value Share and BPS Analysis by Source Type, 2025 and 2035
  • Figure 14: Global Market Y-o-Y Growth Comparison by Source Type, 2025-2035
  • Figure 15: Global Market Attractiveness Analysis by Source Type
  • Figure 16: Global Market Value Share and BPS Analysis by Pet Type, 2025 and 2035
  • Figure 17: Global Market Y-o-Y Growth Comparison by Pet Type, 2025-2035
  • Figure 18: Global Market Attractiveness Analysis by Pet Type
  • Figure 19: Global Market Value Share and BPS Analysis by Sales Channel, 2025 and 2035
  • Figure 20: Global Market Y-o-Y Growth Comparison by Sales Channel, 2025-2035
  • Figure 21: Global Market Attractiveness Analysis by Sales Channel
  • Figure 22: Global Market Value (USD Billion) Share and BPS Analysis by Region, 2025 and 2035
  • Figure 23: Global Market Y-o-Y Growth Comparison by Region, 2025-2035
  • Figure 24: Global Market Attractiveness Analysis by Region
  • Figure 25: North America Market Incremental $ Opportunity, 2025-2035
  • Figure 26: Latin America Market Incremental $ Opportunity, 2025-2035
  • Figure 27: Western Europe Market Incremental $ Opportunity, 2025-2035
  • Figure 28: Eastern Europe Market Incremental $ Opportunity, 2025-2035
  • Figure 29: East Asia Market Incremental $ Opportunity, 2025-2035
  • Figure 30: South Asia & Pacific Market Incremental $ Opportunity, 2025-2035
  • Figure 31: Middle East and Africa Market Incremental $ Opportunity, 2025-2035
  • Figure 32: North America Market Value Share and BPS Analysis by Country, 2025 and 2035
  • Figure 33: North America Market Value Share and BPS Analysis by Product Type, 2025 and 2035
  • Figure 34: North America Market Y-o-Y Growth Comparison by Product Type, 2025-2035
  • Figure 35: North America Market Attractiveness Analysis by Product Type
  • Figure 36: North America Market Value Share and BPS Analysis by Health Claim / Benefit Area, 2025 and 2035
  • Figure 37: North America Market Y-o-Y Growth Comparison by Health Claim / Benefit Area, 2025-2035
  • Figure 38: North America Market Attractiveness Analysis by Health Claim / Benefit Area
  • Figure 39: North America Market Value Share and BPS Analysis by Form Type, 2025 and 2035
  • Figure 40: North America Market Y-o-Y Growth Comparison by Form Type, 2025-2035
  • Figure 41: North America Market Attractiveness Analysis by Form Type
  • Figure 42: North America Market Value Share and BPS Analysis by Source Type, 2025 and 2035
  • Figure 43: North America Market Y-o-Y Growth Comparison by Source Type, 2025-2035
  • Figure 44: North America Market Attractiveness Analysis by Source Type
  • Figure 45: North America Market Value Share and BPS Analysis by Pet Type, 2025 and 2035
  • Figure 46: North America Market Y-o-Y Growth Comparison by Pet Type, 2025-2035
  • Figure 47: North America Market Attractiveness Analysis by Pet Type
  • Figure 48: North America Market Value Share and BPS Analysis by Sales Channel, 2025 and 2035
  • Figure 49: North America Market Y-o-Y Growth Comparison by Sales Channel, 2025-2035
  • Figure 50: North America Market Attractiveness Analysis by Sales Channel
  • Figure 51: Latin America Market Value Share and BPS Analysis by Country, 2025 and 2035
  • Figure 52: Latin America Market Value Share and BPS Analysis by Product Type, 2025 and 2035
  • Figure 53: Latin America Market Y-o-Y Growth Comparison by Product Type, 2025-2035
  • Figure 54: Latin America Market Attractiveness Analysis by Product Type
  • Figure 55: Latin America Market Value Share and BPS Analysis by Health Claim / Benefit Area, 2025 and 2035
  • Figure 56: Latin America Market Y-o-Y Growth Comparison by Health Claim / Benefit Area, 2025-2035
  • Figure 57: Latin America Market Attractiveness Analysis by Health Claim / Benefit Area
  • Figure 58: Latin America Market Value Share and BPS Analysis by Form Type, 2025 and 2035
  • Figure 59: Latin America Market Y-o-Y Growth Comparison by Form Type, 2025-2035
  • Figure 60: Latin America Market Attractiveness Analysis by Form Type
  • Figure 61: Latin America Market Value Share and BPS Analysis by Source Type, 2025 and 2035
  • Figure 62: Latin America Market Y-o-Y Growth Comparison by Source Type, 2025-2035
  • Figure 63: Latin America Market Attractiveness Analysis by Source Type
  • Figure 64: Latin America Market Value Share and BPS Analysis by Pet Type, 2025 and 2035
  • Figure 65: Latin America Market Y-o-Y Growth Comparison by Pet Type, 2025-2035
  • Figure 66: Latin America Market Attractiveness Analysis by Pet Type
  • Figure 67: Latin America Market Value Share and BPS Analysis by Sales Channel, 2025 and 2035
  • Figure 68: Latin America Market Y-o-Y Growth Comparison by Sales Channel, 2025-2035
  • Figure 69: Latin America Market Attractiveness Analysis by Sales Channel
  • Figure 70: Western Europe Market Value Share and BPS Analysis by Country, 2025 and 2035
  • Figure 71: Western Europe Market Value Share and BPS Analysis by Product Type, 2025 and 2035
  • Figure 72: Western Europe Market Y-o-Y Growth Comparison by Product Type, 2025-2035
  • Figure 73: Western Europe Market Attractiveness Analysis by Product Type
  • Figure 74: Western Europe Market Value Share and BPS Analysis by Health Claim / Benefit Area, 2025 and 2035
  • Figure 75: Western Europe Market Y-o-Y Growth Comparison by Health Claim / Benefit Area, 2025-2035
  • Figure 76: Western Europe Market Attractiveness Analysis by Health Claim / Benefit Area
  • Figure 77: Western Europe Market Value Share and BPS Analysis by Form Type, 2025 and 2035
  • Figure 78: Western Europe Market Y-o-Y Growth Comparison by Form Type, 2025-2035
  • Figure 79: Western Europe Market Attractiveness Analysis by Form Type
  • Figure 80: Western Europe Market Value Share and BPS Analysis by Source Type, 2025 and 2035
  • Figure 81: Western Europe Market Y-o-Y Growth Comparison by Source Type, 2025-2035
  • Figure 82: Western Europe Market Attractiveness Analysis by Source Type
  • Figure 83: Western Europe Market Value Share and BPS Analysis by Pet Type, 2025 and 2035
  • Figure 84: Western Europe Market Y-o-Y Growth Comparison by Pet Type, 2025-2035
  • Figure 85: Western Europe Market Attractiveness Analysis by Pet Type
  • Figure 86: Western Europe Market Value Share and BPS Analysis by Sales Channel, 2025 and 2035
  • Figure 87: Western Europe Market Y-o-Y Growth Comparison by Sales Channel, 2025-2035
  • Figure 88: Western Europe Market Attractiveness Analysis by Sales Channel
  • Figure 89: Eastern Europe Market Value Share and BPS Analysis by Country, 2025 and 2035
  • Figure 90: Eastern Europe Market Value Share and BPS Analysis by Product Type, 2025 and 2035
  • Figure 91: Eastern Europe Market Y-o-Y Growth Comparison by Product Type, 2025-2035
  • Figure 92: Eastern Europe Market Attractiveness Analysis by Product Type
  • Figure 93: Eastern Europe Market Value Share and BPS Analysis by Health Claim / Benefit Area, 2025 and 2035
  • Figure 94: Eastern Europe Market Y-o-Y Growth Comparison by Health Claim / Benefit Area, 2025-2035
  • Figure 95: Eastern Europe Market Attractiveness Analysis by Health Claim / Benefit Area
  • Figure 96: Eastern Europe Market Value Share and BPS Analysis by Form Type, 2025 and 2035
  • Figure 97: Eastern Europe Market Y-o-Y Growth Comparison by Form Type, 2025-2035
  • Figure 98: Eastern Europe Market Attractiveness Analysis by Form Type
  • Figure 99: Eastern Europe Market Value Share and BPS Analysis by Source Type, 2025 and 2035
  • Figure 100: Eastern Europe Market Y-o-Y Growth Comparison by Source Type, 2025-2035
  • Figure 101: Eastern Europe Market Attractiveness Analysis by Source Type
  • Figure 102: Eastern Europe Market Value Share and BPS Analysis by Pet Type, 2025 and 2035
  • Figure 103: Eastern Europe Market Y-o-Y Growth Comparison by Pet Type, 2025-2035
  • Figure 104: Eastern Europe Market Attractiveness Analysis by Pet Type
  • Figure 105: Eastern Europe Market Value Share and BPS Analysis by Sales Channel, 2025 and 2035
  • Figure 106: Eastern Europe Market Y-o-Y Growth Comparison by Sales Channel, 2025-2035
  • Figure 107: Eastern Europe Market Attractiveness Analysis by Sales Channel
  • Figure 108: East Asia Market Value Share and BPS Analysis by Country, 2025 and 2035
  • Figure 109: East Asia Market Value Share and BPS Analysis by Product Type, 2025 and 2035
  • Figure 110: East Asia Market Y-o-Y Growth Comparison by Product Type, 2025-2035
  • Figure 111: East Asia Market Attractiveness Analysis by Product Type
  • Figure 112: East Asia Market Value Share and BPS Analysis by Health Claim / Benefit Area, 2025 and 2035
  • Figure 113: East Asia Market Y-o-Y Growth Comparison by Health Claim / Benefit Area, 2025-2035
  • Figure 114: East Asia Market Attractiveness Analysis by Health Claim / Benefit Area
  • Figure 115: East Asia Market Value Share and BPS Analysis by Form Type, 2025 and 2035
  • Figure 116: East Asia Market Y-o-Y Growth Comparison by Form Type, 2025-2035
  • Figure 117: East Asia Market Attractiveness Analysis by Form Type
  • Figure 118: East Asia Market Value Share and BPS Analysis by Source Type, 2025 and 2035
  • Figure 119: East Asia Market Y-o-Y Growth Comparison by Source Type, 2025-2035
  • Figure 120: East Asia Market Attractiveness Analysis by Source Type
  • Figure 121: East Asia Market Value Share and BPS Analysis by Pet Type, 2025 and 2035
  • Figure 122: East Asia Market Y-o-Y Growth Comparison by Pet Type, 2025-2035
  • Figure 123: East Asia Market Attractiveness Analysis by Pet Type
  • Figure 124: East Asia Market Value Share and BPS Analysis by Sales Channel, 2025 and 2035
  • Figure 125: East Asia Market Y-o-Y Growth Comparison by Sales Channel, 2025-2035
  • Figure 126: East Asia Market Attractiveness Analysis by Sales Channel
  • Figure 127: South Asia & Pacific Market Value Share and BPS Analysis by Country, 2025 and 2035
  • Figure 128: South Asia & Pacific Market Value Share and BPS Analysis by Product Type, 2025 and 2035
  • Figure 129: South Asia & Pacific Market Y-o-Y Growth Comparison by Product Type, 2025-2035
  • Figure 130: South Asia & Pacific Market Attractiveness Analysis by Product Type
  • Figure 131: South Asia & Pacific Market Value Share and BPS Analysis by Health Claim / Benefit Area, 2025 and 2035
  • Figure 132: South Asia & Pacific Market Y-o-Y Growth Comparison by Health Claim / Benefit Area, 2025-2035
  • Figure 133: South Asia & Pacific Market Attractiveness Analysis by Health Claim / Benefit Area
  • Figure 134: South Asia & Pacific Market Value Share and BPS Analysis by Form Type, 2025 and 2035
  • Figure 135: South Asia & Pacific Market Y-o-Y Growth Comparison by Form Type, 2025-2035
  • Figure 136: South Asia & Pacific Market Attractiveness Analysis by Form Type
  • Figure 137: South Asia & Pacific Market Value Share and BPS Analysis by Source Type, 2025 and 2035
  • Figure 138: South Asia & Pacific Market Y-o-Y Growth Comparison by Source Type, 2025-2035
  • Figure 139: South Asia & Pacific Market Attractiveness Analysis by Source Type
  • Figure 140: South Asia & Pacific Market Value Share and BPS Analysis by Pet Type, 2025 and 2035
  • Figure 141: South Asia & Pacific Market Y-o-Y Growth Comparison by Pet Type, 2025-2035
  • Figure 142: South Asia & Pacific Market Attractiveness Analysis by Pet Type
  • Figure 143: South Asia & Pacific Market Value Share and BPS Analysis by Sales Channel, 2025 and 2035
  • Figure 144: South Asia & Pacific Market Y-o-Y Growth Comparison by Sales Channel, 2025-2035
  • Figure 145: South Asia & Pacific Market Attractiveness Analysis by Sales Channel
  • Figure 146: Middle East and Africa Market Value Share and BPS Analysis by Country, 2025 and 2035
  • Figure 147: Middle East and Africa Market Value Share and BPS Analysis by Product Type, 2025 and 2035
  • Figure 148: Middle East and Africa Market Y-o-Y Growth Comparison by Product Type, 2025-2035
  • Figure 149: Middle East and Africa Market Attractiveness Analysis by Product Type
  • Figure 150: Middle East and Africa Market Value Share and BPS Analysis by Health Claim / Benefit Area, 2025 and 2035
  • Figure 151: Middle East and Africa Market Y-o-Y Growth Comparison by Health Claim / Benefit Area, 2025-2035
  • Figure 152: Middle East and Africa Market Attractiveness Analysis by Health Claim / Benefit Area
  • Figure 153: Middle East and Africa Market Value Share and BPS Analysis by Form Type, 2025 and 2035
  • Figure 154: Middle East and Africa Market Y-o-Y Growth Comparison by Form Type, 2025-2035
  • Figure 155: Middle East and Africa Market Attractiveness Analysis by Form Type
  • Figure 156: Middle East and Africa Market Value Share and BPS Analysis by Source Type, 2025 and 2035
  • Figure 157: Middle East and Africa Market Y-o-Y Growth Comparison by Source Type, 2025-2035
  • Figure 158: Middle East and Africa Market Attractiveness Analysis by Source Type
  • Figure 159: Middle East and Africa Market Value Share and BPS Analysis by Pet Type, 2025 and 2035
  • Figure 160: Middle East and Africa Market Y-o-Y Growth Comparison by Pet Type, 2025-2035
  • Figure 161: Middle East and Africa Market Attractiveness Analysis by Pet Type
  • Figure 162: Middle East and Africa Market Value Share and BPS Analysis by Sales Channel, 2025 and 2035
  • Figure 163: Middle East and Africa Market Y-o-Y Growth Comparison by Sales Channel, 2025-2035
  • Figure 164: Middle East and Africa Market Attractiveness Analysis by Sales Channel
  • Figure 165: Global Market - Tier Structure Analysis
  • Figure 166: Global Market - Company Share Analysis

Frequently Asked Questions

What is the projected size of the functional pet ingredients market in 2025?

The market is valued at USD 12.5 billion in 2025.

What is the outlook on functional pet ingredients demand by 2035?

The market is forecasted to reach USD 19.6 billion by 2035, reflecting a CAGR of 4.6%.

Which segment leads the functional pet ingredients market by product type in 2025?

Probiotics will lead the product type segment, accounting for 23% of the global market share in 2025.

What is the top health benefit segment for the functional pet ingredients market in 2025?

Digestive health will dominate the benefit area with a 24.1% share in 2025.

Which country is projected to have the fastest-growing functional pet ingredients market?

Germany and Australia are projected to grow at the fastest rate, with a CAGR of 3.3% from 2025 to 2035.

Explore Similar Insights

Future Market Insights

Functional Pet Ingredients Market